HAL Id: hal-02380916
https://hal.archives-ouvertes.fr/hal-02380916
Submitted on 26 Nov 2019
HAL is a multi-disciplinary open access
archive for the deposit and dissemination of
sci-entific research documents, whether they are
pub-lished or not. The documents may come from
teaching and research institutions in France or
abroad, or from public or private research centers.
L’archive ouverte pluridisciplinaire HAL, est
destinée au dépôt et à la diffusion de documents
scientifiques de niveau recherche, publiés ou non,
émanant des établissements d’enseignement et de
recherche français ou étrangers, des laboratoires
publics ou privés.
Sorption of Eu(III) on quartz at high salt concentrations
David Garcia, Johannes Lützenkirchen, Vladimir Petrov, Matthieu
Siebentritt, Dieter Schild, Grégory Lefèvre, Thomas Rabung, Marcus
Altmaier, Stepan Kalmykov, Lara Duro, et al.
To cite this version:
David Garcia, Johannes Lützenkirchen, Vladimir Petrov, Matthieu Siebentritt, Dieter Schild, et al..
Sorption of Eu(III) on quartz at high salt concentrations. Colloids and Surfaces A:
Physicochemi-cal and Engineering Aspects, Elsevier, 2019, 578, pp.123610. �10.1016/j.colsurfa.2019.123610�.
�hal-02380916�
SORPTION OF Eu(III) ON QUARTZ AT HIGH SALT CONCENTRATIONS
1
David Garcíaa,, Johannes Lützenkirchenb,, Vladimir Petrovc,, Matthieu Siebentrittd, Dieter
2
Schildb, Grégory Lefèvred, Thomas Rabungb, Marcus Altmaierb, Stepan Kalmykovc, Lara Durob,
3
Horst Geckeisb
4
a. Amphos 21, Carrer Veneçuela 103, 08019, Barcelona (ES)
5
b. Karlsruhe Institute of Technology (KIT) Institut für Nukleare Entsorgung (INE)
,Hermann-von-6
Helmholtz-Platz 1, 76344 Eggenstein-Leopoldshafen (GER)
7
c. Lomonosov Moscow State University, Department of Chemistry, Leninskie gory, 1/3, 119991,
8
Moscow (RU)
9
d. PSL Research University, Chimie ParisTech — CNRS, Institut de Recherche de Chimie
10
Paris, 75005, Paris, France (FR)
11
12
Abstract
13
Sorption of Eu(III) onto quartz from highly saline solutions (up to 5M NaCl) has been studied by
14
sorption edges. The acid-base titrations of the solid surface suggest the rather unusual
15
presence of two different sites that has been the object of recent discussions in the literature.
16
Europium uptake results show the usual behaviour with a steep pH-edge and nearly complete
17
removal at sufficiently high pH. Previous spectroscopic data on this system suggest the
18
presence of two bidentate surface complexes with different proton stoichiometry. Based on this,
19
a self-consistent Surface Complexation Model (SCM) was fitted to the full set of experimental
20
data, from 0.1 to 5 M NaCl, using a coupled Pitzer/surface complexation approach. The Pitzer
21
model was applied to aqueous species. A Basic Stern Model was used for interfacial
22
electrostatics of the system, which includes ion-specific effects via ion-pair formation. Parameter
23
fitting was done using the general parameter estimation software UCODE coupled to a modified
24
version of FITEQL2 involving separate calculations of the respective ionic strength corrections.
25
At high ionic strength (>1 M), the surface potential is strongly screened by ion-pair formation
26
and the diffuse layer potential is negligibly low, which justifies the extension of the standard
27
electrostatic model to these harsh conditions. Overall, our model is able to describe the full set
28
of analysed data. It is expected that these first systematic data acquisition along with the
29
detailed modelling can serve as a benchmark for the modelling of future studies on sorption in
30
highly saline systems.
31
32
Keywords
33
Sorption, radionuclides, silica, high ionic strength, modelling, europium
34
Corresponding author: Dr. David García. E-mail: david.garcia@amphos21.com. +34 935 830 500
Corresponding author: Dr. Johannes Lützenkirchen. E-mail: johannes.luetzenkirchen@kit.edu. +49 721 608-2402
1. Introduction
35
36
Adsorption processes are important in retarding the potential migration of radionuclides from a
37
nuclear waste repository to the biosphere 1,2. Many studies have been carried out to
38
characterize the interactions of key radionuclides on many surfaces for a wide range of solution
39
compositions. The major body of the studies was performed with salt concentrations of 0.1M
40
and below (3 and references therein). Surface complexation modelling approaches 4–6 have
41
rationalized the adsorption of dissolved ions (such as heavy metal ions or radionuclides) in a
42
fashion similar to the treatment of aqueous complexation equilibria. In particular, on oxides,
43
surface ligands (surface hydroxyl groups) undergo protonation and/or deprotonation which
44
allow, along with an electrostatic model for the interface, the description of the charging curves
45
of the surfaces under study. The fundamental charging of oxide surfaces occurs via proton
46
uptake or release from the surface functional groups. The surface charge is pH dependent and
47
influenced by the electrolyte ions and increases with ionic strength. Adsorption of other solutes
48
like radionuclides is also pH dependent and affected by the variable charge of the surface. For
49
salt concentrations significantly higher than 0.1M there is no systematic data set to allow an
50
extension of the present modelling approaches to higher salt contents within a variable charge
51
model. In one case, data for sorption on montmorillonite were modelled using a combined Pitzer
52
and triple layer approach by Mahoney and Langmuir7. In Mahoney and Langmuir study’s, the
53
data were more adequately modelled up to 4.0 M NaCl (encompassing data at 1.0 and 2.0 M
54
NaCl for the high concentration range) using activity coefficients calculated by the Davies
55
equation than by using Pitzer based activity coefficient models. It is unclear how the pH
56
measurements were actually done at the high salt level8 and if the charges were accurately
57
determined in the high salt level range, a Basic Stern model coupled to the Davies equation was
58
successful in describing the reported data also in 4.0 M NaCl9. The situation is different for
59
aqueous solubility and speciation of radionuclides where a large body of systematic
60
experimental data exists. In these cases, SIT and Pitzer modelling approaches set
61
thermodynamic frameworks that can be applied to performance assessment for repositories in
62
salt formations 10 to include solubility limits and concomitant effects of aqueous solution
63
complexation effects. The importance of obtaining accurate data and using consistent
64
thermodynamic data to model them is obvious. For the aqueous solution this concerns the
65
measurement of the proton activity, which is a master variable, and which is not trivial at high
66
salt levels, and the calculation of correct activity coefficients11.
67
Radionuclide retention due to surface reactions is typically represented in Performance
68
Assessment calculations by the equilibrium distribution coefficient (Kd), which is a quotient
69
between the adsorbed concentration of radionuclide (mass of radionuclide per unit mass of
70
solid) and the aqueous concentration of radionuclide (mass of radionuclide per unit volume of
71
solution)12. Overall, Kd values lump together various processes (e.g. surface complexation,
ion-72
exchange, precipitation, co-precipitation, etc.) and do not provide appreciable insight into the
73
retention mechanism. Alternatively, radionuclide retention processes can be assessed through
the use of surface complexation models. Such approach, based on the definition on a
75
mechanistic reaction model, can represent a variety of retention reactions (equilibrium and
76
kinetic). It has become highly desirable to approach adsorption in more concentrated solutions,
77
covering intermediate (0.1-1 M) and high ionic strength (>1 M), by similar procedures. This
78
involves collection of experimental data in a systematic way on a model system in a first step
79
and a subsequent attempt to rationalize the data in terms of a surface complexation model.
80
As a model surface, quartz is studied in this work. Quartz presents well-known surface
81
properties, with surface functional groups also present on the surface of clays and clay
82
minerals. On the other hand, trivalent lanthanides, and more precisely, Eu has been selected as
83
adsorbing solute of interest for the adsorption studies. This trivalent lanthanide cation is often
84
used as a proxy for the radionuclides Am and Cm, which constitute an important fraction of the
85
minor lanthanides/actinides present in the high-level liquid waste generated during the
86
reprocessing of spent nuclear fuel13. In the scenario of a repository failure, these radionuclides
87
could migrate away from the waste disposal site, finally entering the geosphere. During this
88
migration process they will be interacting with the surrounding host-rock minerals.
89
Consequently, a reliable understanding of their behaviour in contact with surfaces is crucial
90
whenever retention processes are to be taken advantage of in the Safety Case for a given
91
repository. Extensive studies have been carried out on the uptake of trivalent actinides onto
92
mineral surfaces under different conditions 13–18, but a study for high salt content on silica
93
minerals is missing. In Germany and some other countries (Canada, USA, etc.) some options
94
for repositories in areas that would involve highly saline aqueous solutions have been discussed
95
and experimental data and models for treating such systems are required.
96
97
It is expected that such a model can be applied in Performance Assessment for a nuclear waste
98
repository in highly saline environment in a similar way as is nowadays envisaged or applied for
99
sorption from low ionic strength solutions in the licensing process for nuclear waste repositories
100
or practised in general environmental contexts with respect to contaminant transport. Data on
101
Eu adsorption on clay surfaces have been recently published up to high ionic strength and were
102
modelled by a non-electrostatic surface complexation model coupled to the Pitzer approach16.
103
While the coupling itself is rather a technical problem, the more interesting scientific issue is
104
how traditional electrostatic models perform at high salt concentrations. One issue is whether
105
coupled models yield a good fit to experimental data over the full range of background
106
electrolyte content. Another arises from the fact that the application of the Gouy-Chapman-type
107
treatment that is part of many of those models is beyond the limits of the underlying theory. For
108
this reason, the constant capacitance model has been traditionally used as the equivalent of the
109
constant ion medium approach in solution studies to treat the interfacial electrostatics at high -
110
medium concentrations 19. Although the constant capacitance model allows for variable ionic
111
strength in a semi-predictive way 20, it is preferable to have a fully consistent set of surface
112
complexation parameters to describe a given system. We therefore test a Basic Stern model to
113
describe electrostatics at the mineral water interface up to high salt concentrations. Hiemstra
and co-workers 9 modelled data on silica from Bolt 21 up to 4M NaCl applying conventional
115
activity corrections involving the Davies-equation. At the highest salt level, such approaches fail
116
to correctly describe the activity corrections of the dissolved species. Except for the works of
117
Schnurr et al. 16 and Zoll and Schifj22, on clay minerals and algae respectively, we have no
118
knowledge of a consistent treatment of the activity corrections up to salt brines in an adsorption
119
study. This work therefore is the first attempt to couple Pitzer equations with an electrostatic
120
model for the interface. The use of Pitzer equations to calculate activity coefficients at high ionic
121
strength conditions is preferred because this model allows a robust description of the complex
122
ion-interaction processes in saline media. As will be seen later, the model performs very well for
123
our system. Furthermore, due to the high salt content, the impact of the Gouy-Chapman part
124
(i.e. the diffuse part of the double layer) is of minor importance, since the fundamental charge
125
caused by proton ad- and desorption from surface functional groups is sufficiently screened by
126
counter-ion adsorption.
127
128
2. Materials and Methods
129
130
2.1 Materials
131
132
Commercially available MINUSIL 5 particles (pure quartz particles of nominal 5 µm size) were
133
obtained from U.S. silica company. The solids were washed several times with dilute HNO3
134
solutions, dried and checked for the absence of impurities by XPS. The XPS spectra (not
135
shown) did not reveal any significant impurities on the pre-treated particles. The specific surface
136
area (measured by BET using Nitrogen gas) of the pre-treated particles was 6.5 m2/g.
137
138
2.2 Surface titrations and zeta potentials measurements
139
140
The MINUSIL solids were titrated at different NaCl concentrations (0.1, 1, 3 and 5M). Titrations
141
were carried out in fast mode with small additions of titrant and short waiting times between
142
additions. Calibration of the measurement set-up was done with standard procedure but
143
considering the “A”-factor which allows to correct operational, measured pH values at high ionic
144
strength to pHc (-log[H +
])20. The set-up was purged by purified and humidified Argon to avoid
145
intrusion of carbon dioxide and limit evaporation. The data treatment followed standard
146
procedures. The values for pKw at the different ionic strengths were calculated using the Pitzer
147
formalisms. The Pitzer parameters were those used by Schnurr et al. 16 (for the
Am-Na-Cl-148
system). They are self-consistent, and consistent between the treatment of the titration data and
149
the modelling of our experimental titration and adsorption data. The raw data yielded the relative
150
surface charge as a function of pHc. For the modelling it is necessary to determine the absolute
151
charge. It is not straightforward to decide how to treat the data at these high salt contents, as
152
several pH-scales would be possible besides the pHc scale. Plotting the relative data on any of
153
these scales could yield a common intersection point. In the case of standard quartz no
common intersection point is expected, but the observed plateau down to low pH is usually set
155
to absolute zero surface charge. Our data do not show classical quartz behaviour, therefore no
156
clear acidity scale to define common intersection points can be defined. A consistent way to fix
157
the absolute charge is to use the Pitzer pH scale within a model and involve zeta-potential
158
measurements, which give an absolute value of the surface charge within the shear-plane.
159
The DT-300 system from Quantachrome/Dispersion Technology was used for the
160
electroacoustic experiments. Before each new measurement, a calibration of the probe is done
161
in a particle-free solution, and the background current is automatically subtracted from the
162
suspension measurements. Moreover, ultrasounds are applied for 3 min in the suspensions
163
before any experiment using a sonotrode (UP100H model from Hielscher). To calculated zeta
164
potential from electroacoustic measurements, a bimodal size distribution has been used,
165
resulting from laser diffraction granulometry. The pH was measured in the usual way, i.e. by
166
calibrating against three commercial buffers. With the lower ionic strength, no extra corrections
167
were required.
168
169
2.3 Batch Sorption studies
170
171
Eu sorption onto MINUSIL particles was studied in NaCl solutions of different ionic strengths:
172
0.1, 1, 3 and 5M. The total concentration of Eu in all cases was 1·10-7M, the solid to liquid ratio
173
was 10g/L, and pHc values were varied in the range from 2.5 to 8.0 by HCl and NaOH solutions.
174
The pHc values were determined using the known “A”-factors as described in the previous
175
section.
176
177
178
2.4 Speciation calculations and surface complexation modelling
179
180
Thermodynamic data (log 0
values) used in this work are identical to those used by Schnurr et
181
al. 16. We summarize the log 0 values for the aqueous Eu-species, which have been taken from
182
the NEA compilation for Americium 23 (see Table 1). The Pitzer activity coefficients were used
183
as indicated above. Europium and Americium, generally featuring analogous aqueous species
184
with comparable structures, are usually treated within a common scheme to describe
ion-185
interaction processes. The potential dissolution of quartz may result in the formation of silicic
186
acid that may act as inorganic ligand for cations. However, in a related study it was found that
187
addition of dissolved silica is required to affect the speciation in this system 17. Moreover,
188
increasing the system ionic strength largely decrease the stability of ternary aqueous species
189
Eu-H2O-Si. Thus, no attempt was made to include Si aqueous speciation in the model, i.e.
190
ternary aqueous or surface species were not considered.
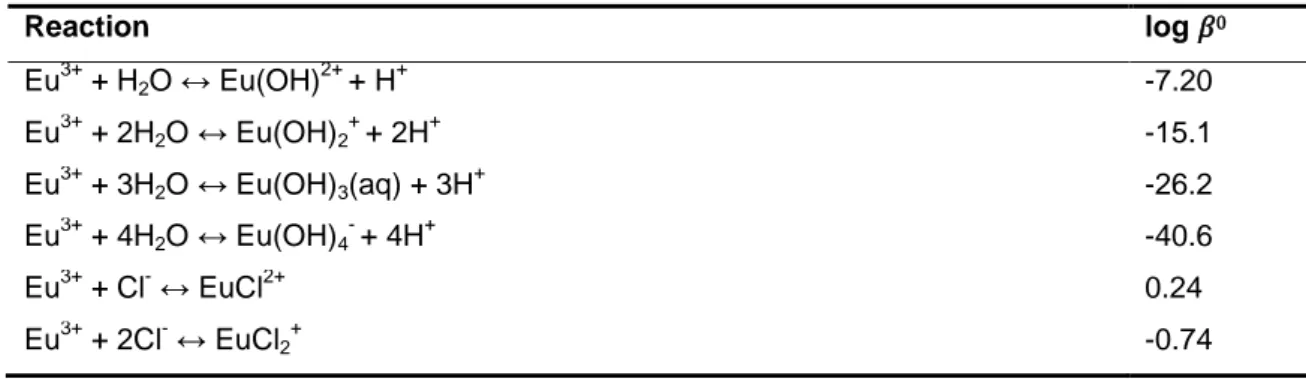
Table 1. log 0 used for calculating the aqueous speciation of Eu(III).
192
Reaction log 0 Eu3+ + H2O ↔ Eu(OH) 2+ + H+ -7.20 Eu3+ + 2H2O ↔ Eu(OH)2 + + 2H+ -15.1 Eu3+ + 3H2O ↔ Eu(OH)3(aq) + 3H + -26.2 Eu3+ + 4H2O ↔ Eu(OH)4 - + 4H+ -40.6 Eu3+ + Cl- ↔ EuCl2+ 0.24 Eu3+ + 2Cl- ↔ EuCl2 + -0.74193
Quartz surface protonation is modelled with a 2-site protolysis model 24. The MINUSIL sample
194
used in this study presents two distinct types of functional groups that govern the reactions
195
taking place at the quartz surface. A basic Stern model is used for interfacial electrostatics of
196
the system, which includes ion-specific effects via the formation of ion-pairs between ionized
197
surface functional groups and ions of the background electrolyte 25. For the fundamental
198
charging the titration and zeta-potential results were fitted simultaneously. As previously
199
explained, a major problem in the treatment of the titration data is that the absolute charge
200
cannot be determined. Zeta-potentials are an absolute measure of the net-charge within the
201
shear-plane and are affected by the proton ad- and desorption reactions. The coupling of the
202
various data sets via UCODE is possible and allows the relative charging data obtained in the
203
titrations 26 to be transformed to absolute values, while simultaneously fitting capacitance and
204
stability constants. Site densities were constrained as described below.
205
Metal ion adsorption is modelled by applying those parameters derived from titration results, i.e.
206
capacitance and surface hydrolysis constants, and fitting a hypothetical surface complex
207
stoichiometry with a charge distribution to the experimental Eu uptake data. Parameter fitting is
208
done using the general parameter estimation software UCODE 27 coupled to a modified version
209
of FITEQL2 28.
210
No separate activity corrections apart from electrostatic factors are applied to the surface
211
species, i.e. in the mass law equations for adsorption reactions only activity coefficients for
212
dissolved species and activities of water are considered in the calculation of the ionic strength
213
dependence of stability constants for surface species. The activity coefficients were separately
214
calculated using the Pitzer formalism and available self-consistent databases, as described in
215
detail elsewhere 16. The resulting activity coefficients were then used to calculate conditional
216
stability constants at infinite dilution, or corrections factors to stability constants that were to be
217
fitted. Fitting thus yields the stability constants at infinite dilution.
218
219
3. Results
220
221
3.1 Surface titrations and zeta potentials
222
223
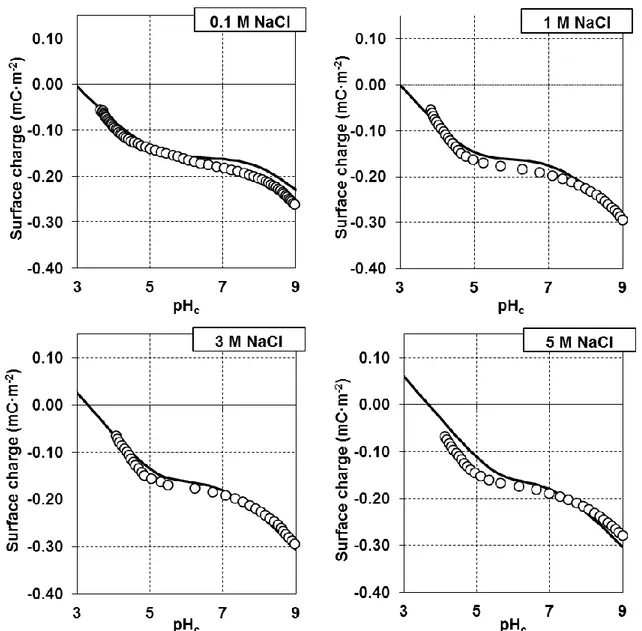
Surface titration results are presented as symbols in Figure 1 in terms of surface charge (in
224
mC·m-2) vs pHc. The charging curves agree with some previously published studies 29
, but only
225
differ from the bulk of the literature data for quartz and silica, which show the deprotonation step
226
at high pH. Our data are surprising in the sense that a distinct two step behaviour is observed.
227
Usually such stepwise deprotonation is overshadowed by electrostatics and/or site distributions
228
30
. Ong et al. 29 used second harmonic generation to study the interface between fused silica
229
and sodium chloride solutions as a function of pH. They found a two step-behaviour and
230
reported log values of -4.5 and -8.5 in 0.5 M NaCl and a ratio of 1:4 between the two types of
231
sites. There are various independent studies that report the existence of two distinct sites on
232
various silica samples 24,31–35. Our proposed model involves two sites, as does the Ong et al.
233
model, and Figure 1 and Figure 3 show the fits to the surface titrations and the zeta-potentials.
234
Solid lines in Figure 1 represent the best fit results. The SCM parameters used in the fitting are
235
detailed in Table 2. The site densities were constrained according to Ong et al. assuming a total
236
site density of 4.6 sites/nm218.
237
In the acidic pH range (pHc<6), for the same pHc value the negative surface charge increases
238
when increasing the ionic strength of the system. A further decrease in the negative charge was
239
observed in the basic pH range (pHc>7). This behaviour can be described by the speciation
240
scheme presented in Figure 4. Deprotonated species are predominant in both, acidic and basic,
241
pHc conditions. We will refer to the more acidic site as the hydrophobic site x. Counter-ions (Na +
242
and Cl-) adsorption has also been considered (Table 2).
243
The pKa values in our modelling have been placed close to those obtained by Ong et al. within a
244
Diffuse Layer model for data at 0.5M NaCl 29. The site labelled y is the “usual” silanol site with
245
an assigned pK value of about 8.5 and sodium association is also in the range typically reported
246
13,17,29. The “hydrophobic” site involves a pK value fixed at about 4.0. Overall, the two pK values
247
for deprotonation extracted from our experimental data (i.e. 4.0 and 8.5) agree with independent
248
data reported in the literature, i.e. 2-3 and 9-10 from 35, 4.5 and 8.5 from 29, 5.5 and 9.0 from 31.
249
To be able to model the data we had to involve rather strong counter-ion association with the
250
hydrophobic site. There have been recent reports on ion-specific effects on fused silica in the
251
acidic range36, which may be taken as support for our findings. A more direct indication from
252
AFM measurements where the two sites were also identified on one sample shows that
cation-253
specificity is inversed 37 and that the more acidic site is indeed showing the sequence expected
254
for a hydrophobic surface 38.
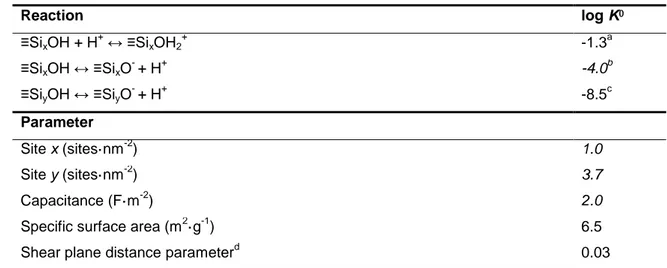
Table 2. Parameters and reactions used to model the amphoteric behaviour of quartz surface
256
with an electrostatic SCM model at infinite dilution. In italics fitted parameters.
257
Reaction log K0 ≡SixOH + H + ↔ ≡Si xOH2 + -1.3a ≡SixOH ↔ ≡SixO - + H+ -4.0b ≡SiyOH ↔ ≡SiyO- + H+ -8.5c Parameter Site x (sites·nm-2) 1.0 Site y (sites·nm-2) 3.7 Capacitance (F·m-2) 2.0Specific surface area (m2·g-1) 6.5
Shear plane distance parameterd 0.03
a. Counter ion (Cl-) constant (log K) for ≡SixOH is 1.9; b. Counter ion (Na +
) constant (log K) for
258
≡SixOH was 5.4; c. Counter ion (Na
+) constant (log K) for ≡Si
yOH is 1.5. d. ratio between
shear-259
plane distance and Debye-length; a value close to zero suggests that the model inherent
shear-260
plane is close to the (theoretical) onset of the diffuse layer.
261
262
Figure 1. Surface charge density as a function of pHc for MINUSIL quartz particles at different
263
ionic strengths (0.1-5M) in NaCl medium. Symbols stand for the experimental results, while lines
264
are the best fit model using Table 2 parameters and Pitzer activity coefficients for aqueous
265
solution speciation.
266
267
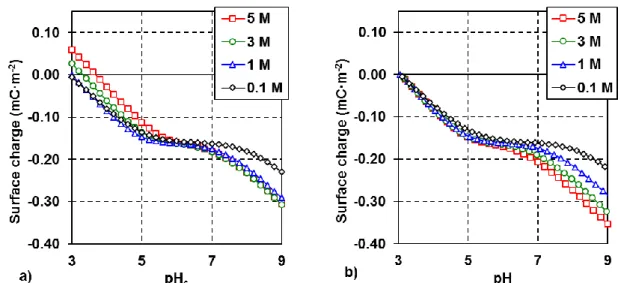
A comparison between surface charge as a function of pHc (concentration scale) respectively
268
pH (activity scale, here Pitzer pH scale) is presented in Figure 2a and Figure 2b respectively.
269
Figure 2 highlights that the mode of presenting the data (either on the concentration or on the
270
activity scale) has some repercussion on how to classify the observations. On the concentration
271
scale, there is strong effect of salt on the hydrophobic site, while there is no effect for the
272
hydrophilic site at salt contents of 1M and above (Figure 2a). On the Pitzer-activity scale, hardly
273
any effect of salt is observed on the hydrophobic site, while the hydrophilic site clearly follows
274
the trend found in comparable studies at salt contents below 1M. The choice of the scales also
275
has repercussions on how to classify specific adsorption as will be discussed later.
277
Figure 2. Calculated surface charge density as a function of a) pHc and b) pH (Pitzer pH scale)
278
for MINUSIL quartz particles at different ionic strengths (0.1-5M) in NaCl medium. Table 2
279
parameters and Pitzer activity coefficients for aqueous solution speciation have been used in
280
these calculations.
281
282
Figure 3. a) Zeta potentials as a function of pHc for two different NaCl concentrations, 0.1 and
283
0.13M. Symbols stand for experimental data while lines are the predictions by the SCM detailed
284
in Table 2. b) Diffuse Layer potentials as a function of pHc for the different NaCl concentrations,
285
from 0.1 to 5M, studied in the present work.
286
287
Figure 3 shows calculated interfacial potentials based on the present model. Figure 3a presents
288
the measured zeta-potentials for the sample at approximately 0.1M NaCl with the concomitant
289
model calculations, showing a rather good fit. Figure 3b shows the model inherent diffuse layer
290
potentials for the various NaCl concentrations used in the titrations. Due to the strong
pairing there is a strong drop in the interfacial potential up to the head end of the diffuse layer.
292
The diffuse layer potentials become very low for I ≥ 1M NaCl. This justifies the application of the
293
conventional diffuse layer, mainly because the diffuse layer potential becomes insignificant. The
294
zeta-potentials can be described by a shear-plane distance parameter close to zero, which
295
means the shear plane is nearly identical with the head end of the diffuse layer.
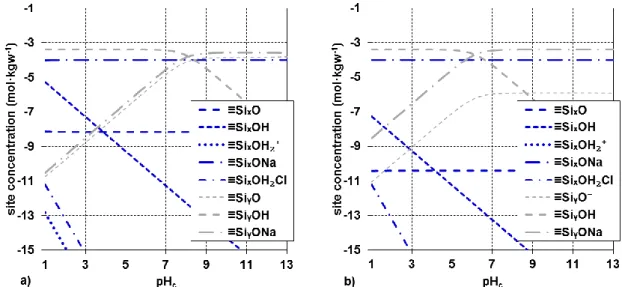
296
Figure 4 shows the surface speciation according to the model for 0.1M (Figure 4 - a) and 5M
297
(Figure 4 - b). The high salt content clearly drives the ion-pairs with sodium to control the
298
speciation on the hydrophilic site.
299
300
Figure 4. Silica surface speciation as a function of pHc according with the model presented in
301
Table 2, at a) 0.1M NaCl and b) 5.0M NaCl.
302
303
3.2 Aqueous speciation of Eu
304
305
Aqueous Eu speciation over a wide range of pHc is shown in Figure 5 for the different NaCl
306
concentrations. Increasing the ionic strength has not an important effect under acid conditions.
307
The two aqueous species, EuCl2+ and EuCl2 +
, are negligible even at Cl concentrations as high
308
as 5M (not shown in the Figure). In the basic pH range (pHc>8), within our speciation scheme,
309
minor differences can be observed with the increase of ionic strength. As pointed out by
310
Schnurr et al. 16, the Pitzer parameters for the chloride complexes in NaCl systems are not
311
complete, but the resulting effects on europium speciation are minor.
312
313
314
Figure 5. Aqueous speciation of Eu vs. pHc based on the available thermodynamic parameters.
315
Fraction of Eu species at different NaCl concentrations for [Eu]T=1·10 -7
M. Thermodynamic data
316
are reported in Table 1.
317
A more interesting feature in Figure 5 is that with increasing salt content, the model predicts a
318
consistent increase in the stability of the first hydrolysis species over the other species. Clearly
319
this species increases from below 50 % (at 0.1M) to almost 70 % (at 5M) of the total Eu in
320
solution at 5M NaCl. The first hydrolysis species has often been considered relevant for the
321
onset of adsorption 39, and linear free energy relationships are often used to relate surface
322
complexation constants with the first hydrolysis constant in the case of cations. This would
323
suggest stronger adsorption of Eu in the 0.1M NaCl system at a given pHc compared to the
324
higher ionic strengths.
326
3.3 Adsorption of Eu onto MINUSIL particles
327
328
Experimentally obtained Eu sorption edges are presented in Figure 6 (symbols) as fractional
329
uptake vs pHc in the various NaCl media (from 0.1 to 5 M). A shift in the sorption edges to
330
higher pHc is found on the log proton concentration (pHc) scale with increasing ionic strength. In
331
the four studied ionic strengths Eu adsorption onto quartz starts at pHc4 and reaches almost
332
95% at pHc6. At more basic conditions, nearly complete uptake is observed. As expected
333
based on the aqueous speciation, enhanced adsorption is observed at the low pHc in 0.1M NaCl
334
compared to the higher ionic strengths.
335
The electrostatic SCM developed for simulating Eu uptake onto quartz by using the surface
336
protonation model and the Eu aqueous speciation described above includes two bidentate
337
surface complexes (Table 3). The stoichiometry was taken from Stumpf et al. 17 and the stability
338
constants have been fitted to the basic (i.e. classical silanol) site. No adsorption on the
339
hydrophobic site was considered. This agrees with the recently reported cation adsorption
340
sequence 37. Charge Distribution (CD) is applied in the SCM and CD factors are optimized as
341
well. Model results are shown as solid lines in Figure 6, and show very good agreement with the
342
experimental results.
343
Table 3. Parameters and reactions used to model Eu sorption onto quartz surface with an
344
electrostatic SCM model at infinite dilution. The fitted parameters are given in italics. The charge
345
distribution is given in terms of the charge of the Europium charge that is allocated to the
346
surface plane.
347
Reaction log K0 Δz0,Eu
2(≡SiyOH)+ Eu
3+ ↔ 2(≡Si yO)HEu
2+
+ H+ -0.65 0.36
2(≡SiyOH)+ Eu3+ +H2O ↔ 2(≡SiyO)EuOH++ 2H+ -10.02 0.02
348
As pointed out above, in previous work 17 the same bidentate model in terms of stoichiometry
349
was already used to describe Am(III) and Cm(III) sorption onto another quartz sample. The
350
authors at the time confirmed the presence of at least two Eu surface complexes on the quartz
351
surface by means of TRLFS measurements and the TRLFS also suggested the applied proton
352
stoichiometry in going from the first to the second surface complex. Differences in the model
353
concepts and parameters, e.g. the use of Pitzer instead of Davies for activity corrections, or in
354
the model parameters, e.g. system capacitance, silica surface protonation, CD factors explain
355
the observed discrepancies in model parameters between the study of Stumpf et al. and ours.
356
Considering the CD-factors, the present results indicate a more outer-sphere-type surface
357
complex formation for the same overall stoichiometry compared to Stumpf et al. 17.
358
In a more recent work, Kar and Tomar 13 modelled Cm(III) sorption onto silica at 0.1M NaCl and
359
reported the formation of two distinct monodentate surface complexes, ≡SiOCm2+
and
360
≡SiOCm(OSi(OH)3)2, with log K of -2.53 and -7.94 respectively. These authors applied a Diffuse
Layer Model (DLM) for describing the interfacial electrostatics of the system. The formation of
362
the ternary aqueous species Cm-H2O-Si, ≡SixOCm(OSi(OH)3)2 as in the study Kar and Tomar,
363
was not pursued in the present work, since no Pitzer parameters are available for the silica
364
system. It has already been mentioned that Stumpf et al. reported no effect on the uptake and
365
the spectroscopic results when adding dissolved silica to the Cm/quartz particle systems. Only
366
when the silica concentration was raised to concentrations as high as 10 mM a significant effect
367
was observed with quartz single crystals. The observations by Stumpf et al. are not necessarily
368
proof for the absence of ternary silicato surface complexes in our study. Yet, the shift in the
369
TRLFS spectra from species 1 to 2 is very similar to that observed for other oxide systems,
370
where no ternary surface complexes were suspected 40.
371
372
Figure 6. Fractional uptake of Eu ([Eu]T=1·10 -7
M), S/L 10g/L, on MINUSIL as a function of pHc
373
and at different NaCl concentrations. Experimental data are given by symbols. Solid lines are
374
calculations using the sub-system parameters (Tables 1 and 2) and the SCM summarized in
375
Table 3 involving Pitzer activity coefficients for aqueous solution speciation. Dashed lines
represent the calculated contribution of 2(≡SiyO)HEu2+ while dashed dotted lines stand for the
377
contribution of 2(≡SiyO)EuOH 2+
according to our SCM results.
378
Overall, it is concluded that the proposed model is able to describe the surface charge and
Eu-379
uptake data up to 5M NaCl concentrations. As in the case of the titrations, Figure 7 highlights
380
that the mode of presenting the data has some repercussion on how to classify the
381
observations. On the concentration scale, a clear shift in the sorption edges to higher pHc is
382
found with increasing ionic strength (Figure 7a). On the Pitzer-activity scale, such a trend
383
cannot be clearly observed for salt contents of 1M and above (Figure 7b).
384
385
Figure 7. Predicted sorption edges for Eu ([Eu]T=1·10 -7
M), S/L 10g/L, on MINUSIL as a function
386
of a) pHc and b) pH (Pitzer pH scale) at different NaCl concentrations. Predictions obtained with
387
Table 2 - Table 3 parameters and Pitzer activity coefficients for aqueous solution speciation.
388
389
4. Conclusions
390
391
In the present study, the amphoteric quartz surface behaviour as well as the adsorption of
392
Eu(III) onto quartz surface were reported up to high ionic strengths of 5M in NaCl. An
393
electrostatic surface complexation model has been designed to describe the acid-base,
zeta-394
potential and Eu(III) uptake data in a comprehensive, self-consistent way We obtained the
395
following results:
396
397
-The titration of the quartz sample showed the clear presence of two sites from dilute to
398
concentrated conditions.
399
-The salinity effects on quartz surface charge density can be described in different ways
400
depending on the pH scale chosen. On the concentration scale a major effect occurs at acid pH
401
conditions, while on the activity scale, the effect at low pH is absent.
-The presence of the two sites and their concomitant surface protonation within the model
403
developed in this work is in fair agreement with previously published models covering lower
404
ionic strength conditions for quartz showing similar behaviour.
405
-Within the model, at high ionic strength (I>1M), the surface potential is strongly screened by
406
ion-pair formation and the diffuse layer potential is negligibly low, which justifies the extension of
407
the standard electrostatic model to the highly saline conditions.
408
-Eu(III) sorption edges onto quartz shift towards higher pHc with increasing ionic strength, as
409
expected based on the Eu(III) hydrolysis behaviour. As for the charging data, the chosen pH
410
scale affects the observation or not of an ionic strength effect on Eu(III) uptake.
411
-A charge distribution SCM has been fitted to the Eu(III) adsorption data involving two bidentate
412
Eu surface species.
413
-The proposed new model is in agreement with previous studies at low ionic strength conditions
414
17
, but the derived log K values differ somewhat probably related to the CD-factors and related
415
to the presence of the hydrophobic site.
416
-Coupling a Pitzer approach for the aqueous phase to a conventional surface complexation
417
model is fairly successful in describing the experimental data even when an electrostatic model
418
is used.
419
-Trivalent lanthanide uptake will be of significant importance even in solutions of high ionic
420
strengths.
421
-The model approach applied in this work can contribute to the Safety Case for nuclear waste
422
repositories in formations potentially involving high salt content.
423
424
Acknowledgements
425
Authors acknowledge funding from ACTINET-I3 project – Contract Number: 232631.
426
427
References

![Figure 6. Fractional uptake of Eu ([Eu] T =1·10 -7 M), S/L 10g/L, on MINUSIL as a function of pH c373](https://thumb-eu.123doks.com/thumbv2/123doknet/7766388.256016/15.892.131.770.386.1022/figure-fractional-uptake-eu-eu-t-minusil-function.webp)
![Figure 7. Predicted sorption edges for Eu ([Eu] T =1·10 -7 M), S/L 10g/L, on MINUSIL as a function 386](https://thumb-eu.123doks.com/thumbv2/123doknet/7766388.256016/16.892.132.767.358.663/figure-predicted-sorption-edges-eu-eu-minusil-function.webp)
