Science Arts & Métiers (SAM)
is an open access repository that collects the work of Arts et Métiers Institute of
Technology researchers and makes it freely available over the web where possible.
This is an author-deposited version published in:
https://sam.ensam.eu
Handle ID: .
http://hdl.handle.net/10985/19296
To cite this version :
H. LAMNII, Moussa NAITABELAZIZ, Georges AYOUB, Xavier COLIN, U. MASCHKE
-Experimental investigation and modeling attempt on the effects of ultraviolet aging on the fatigue
behavior of an LDPE semi-crystalline polymer - International Journal of Fatigue - Vol. 142, p.1-12
- 2021
Any correspondence concerning this service should be sent to the repository
Administrator :
archiveouverte@ensam.eu
Experimental investigation and modeling attempt on the effects of
ultraviolet aging on the fatigue behavior of an LDPE semi-crystalline
polymer
H. Lamnii
a, M. Nait Abdelaziz
a,⁎, G. Ayoub
b,⁎, X. Colin
c, U. Maschke
daUniversité de Lille, UML EA 7512, Unité de Mécanique de Lille, 59000 Lille, France
bDepartment of Industrial and Manufacturing Systems Engineering, University of Michigan-Dearborn, Dearborn, MI, 48128, USA cPIMM, Arts et Métiers Institute of Technology, CNRS, CNAM, HESAM University, 151 boulevard de l’Hôpital, 75013 Paris, France dUniversité de Lille, UMR8207(CNRS), Unité Matériaux et Transformation (UMET), 59000 Lille, France
Keywords: Ultraviolet aging Photo-degradation Fatigue life Semi-crystalline polymers Damage A B S T R A C T
The objective of this study was to investigate the effect of UV irradiation on the fatigue life of a bulk semi-crystalline polymer. Low-density polyethylene samples exposed to different UV irradiation doses were fatigue tested. Fatigue indicator based on dissipated energy per cycle was found to present the best correlation with the experimental fatigue results. A master curve unifying the experimental fatigue results for as-received and UV-aged materials was obtained when subtracting the dissipated energy threshold from the total dissipated energy. Finally, the evolution of the damage with cyclic loading was analyzed and preliminary modeling was attempted.
1. Introduction
It has become very common to find semi-crystalline polymers used in outdoor structural applications, such as solar cells, pipelines, and greenhouses, and in the automotive and aerospace industries, electrical insulation, and thermal energy storage applications. Such widespread use of these materials is explained by their good strength-to-weight ratio and their relatively low cost[1]. There are polymers with a large variety of molecular and supramolecular structures, but only two basic macromolecular arrangements can be distinguished: totally amorphous and semi-crystalline structures. Their durability and resistance to en-vironmental factors and operating conditions, such as UV radiation
[2,3,4], chemical reagents[5,6,7], heat[8,9,10], mechanical loadings
[6,11,12,13], humidity, and contact with microorganisms [14], de-termine the polymers’ useful life and their economic and environmental impact [15]. Different and competing degradation mechanisms were reported depending on environmental and operating conditions[16]. Hence, the identification of the preponderant degradation mechanism is essential for structural and durability design of polymeric materials. Degradation mechanisms induced by UV exposure, such as chain scis-sions and/or crosslinking, lead to an alteration of the mechanical and aesthetic properties that usually define the usability of a polymer pro-duct. Subsequently, a significant loss in the materials’ ductility and
fatigue strength is induced by UV degradation
[17,18,19,20,21,22,23,24,25,26]. In this study, we investigated the effect of UV aging on the fatigue life of a widespread semi-crystalline polymer: polyethylene (PE). The attractiveness of this material is prompted by its relatively low cost, outstanding mechanical properties, and suitable chemical resistance and toughness[27].
Photo-oxidation in polymers is initiated in the presence of oxygen and UV light. The absorption of a photon by the polymer and the chemical reaction with oxygen induce an alteration of the chemical and macromolecular structures of the polymer[28]. In addition to hydro-peroxide decomposition, photo-oxidation of polyolefins can be initiated by two other types of reactions involving ketone groups: Norrish type I and Norrish type II[4,23]. These three initiation reactions lead pre-dominantly to chain scissions and secondarily to crosslinking, but Norrish type II also leads to the formation of unsaturations. These re-actions take place in the amorphous phase and in the amorphous-la-mellar interface[29], where oxygen diffusion is easier[16]. On the other hand, the crystalline phase remains typically inert[30]. The de-gradation can be accelerated by increasing the UV irradiation dose absorbed by the polymer through longer exposure time[3,4,31,32,33]. The chemical formulation of polymers (antioxidants, reactive fillers, etc.) and their physical properties, such as crystallinity, molecular weight, and orientation of macromolecular chains, influence their sensitivity to photo-oxidation. The effect of chain scissions on the macromolecular structure is measured through the noticeable decrease
⁎Corresponding authors.
E-mail addresses:moussa.nait-abdelaziz@polytech-lille.fr(M. Nait Abdelaziz),gayoub@umich.edu(G. Ayoub).
in the average molecular weight and a narrowing of the polydispersity (i.e., the distribution of molecular weight[23,34]). Numerous experi-mental techniques are employed to track the changes in the polymer’s chemical and mechanical properties during and after degradation. UV degradation affects a thin superficial layer of a bulk polymer. The thickness of the UV-degradation-affected region ranges from about ten micrometers up to 1 mm[35,36]. Furthermore, crosslinking is reported to decrease such mechanical properties as elongation at break [15], fracture behavior[28], viscoelastic flow (creep)[31,23], etc. The UV-degradation embrittlement of a semi-crystalline polymer can be as-sessed by using, for example, a fracture mechanics approach [29]. Many indicators, such as crystallinity growth[37 38], tensile strength
[39], stiffness[19], hardness[35], and density[40], allow identifica-tion of which mechanism is prevalent.
Fatigue refers to the deterioration of material properties as a con-sequence of cyclic mechanical loading and subsequent damage accu-mulation[41]. Although many investigations have studied the influ-ence of UV irradiation on the mechanical behavior of thermoplastics, fewer examined its effects on fatigue life. The fatigue behavior of polymers is influenced by external factors, such as stress amplitude, stress ratio, mean stress, frequency, temperature, geometry, surface condition, and environment, and also by internal material variables such as: polymer network structure, viscoelastic and hyper-elastic properties [11], molecular weight, etc.[42]. Since polymers are vis-coelastic, weak heat conductors, and strain-rate sensitive, the effect of the self-heating phenomenon on their fatigue strength is not negligible. Thus, the failure under fatigue could also be the result of thermal cyclic creep. Recently, Qi et al.[43] investigated the fatigue life of HDPE under strain and stress controlled loading and proposed a unified model to predict fatigue life under complex loading conditions, including the load-ratio effects. Dealing with multiaxial fatigue of thermoplastics, Amjadi and Fatemi[44]found a damage parameter able to account for the mean stress and stress concentration, leading to interesting pre-dictions for 4 materials. Using an energy approach and a thermographic technique, Risitano et al.[45]proposed an innovative method to pre-dict the fatigue limit of an HDPE material. Damage of an HDPE material induced by different kinds of loadings, including monotonic and cyclic loading, was studied by Zhang et al. [46]. They found an interesting correlation between damage and plastic strain, independent of the kind of loading. Using X-ray tomography combined with SEM images, Ra-phael et al.[47]proposed a scenario of fatigue damage in a PA 6-6 and underlined the key role of the spherulitic microstructure. Shrestha et al.
[48,49] reported that energy-based models coupled with a direct cu-mulative damage approach provide the best correlation with various experimental cyclic loading conditions. Shojaei et al.[50]developed a hyperelastic-plastic-continuum damage model to describe the cyclic behavior of thermoplastics. A semi-empirical low-cycle fatigue-life model was proposed by Yang et al.[51]to predict the rate dependence of fatigue life and the effect of ratcheting. Makki et al.[13]proposed a unified viscohyperelastic-viscoelastic-viscoplastic constitutive model coupled with an alteration theory and successfully captured the low-cycle behavior of polyethylene with variable crystal content.
The intended period of use of structural thermoplastics varies be-tween 10 and 50 years and in rare cases can be 100 years[52]. To evaluate the degradation of polymer properties, the time-temperature equivalence principle is currently used[53]. These evaluation methods are used to predict fatigue resistance as a function of temperature and exposure time. For example, analyses of the effects of thermal aging on the fatigue of carbon black–reinforced EPDM rubber[54]and HNBR (hydrogenated nitrile butadiene rubber) blends [55]showed drastic reduction of the fatigue life with time exposure. Ivanova et al.[56]
studied the effects of UV degradation on the fatigue behavior of thick specimens of ethylene carbon monoxide copolymer (ECO). It was re-ported that the fatigue life in single-edge-notch samples decreased by 10 times after a UV exposure of about 20 h. Wee et al.[57]studied the effects of weathering-induced degradation on the fatigue properties of a
polypropylene and reported an increase of the fatigue life at the early stage of aging but a significant decrease at a longer exposure time. Investigations on the influence of γ-irradiation aging is also a major issue for materials operating in radiative environments. Tanaka et al.
[58]studied these effects on the fatigue crack growth properties of an ultra-high molecular weight polyethylene (UHMWPE). It was reported that the fatigue life is divided by 100 at high gamma radiation doses. Other studies show globally the same trends[59,60].
The present work is devoted to investigating the effects of UV aging on the fatigue behavior of LDPE bulk specimens. While a number of investigations explored the UV aging of films, presenting homogeneous degradation, very few studied the degradation of thick specimen, pre-senting degradation gradient. Furthermore, very few explored the effect of UV aging on the fatigue behavior of semi-crystalline polymers polymer. The present work expends the experimental results published by the authors[61]and explores the efficiency of several quantities that can be used as fatigue indicators accounting for the effect of UV aging on the fatigue life of bulk LDPE. The paper is organized as follows: Section 2 presents the properties of the studied material and the ex-perimental methodology. The exex-perimental mechanical and fatigue results are presented in Section 3. Additionally, two fatigue indicators for UV aged materials are presented in Section 3 and their modeling capability is discussed. The evolution of the damage with cyclic loading for the as-received and UV-aged LDPE is discussed and modeled in Section 4. Finally, a summary of the study and conclusions are provided in Section 5.
2. Materials and experimental setups 2.1. Material
The material is an unstabilized (additive-free: no antioxidant, UV stabilizer, slip agent, or anti-blocking agent) low-density polyethylene (LDPE) supplied by Qatar Petrochemical Company© (QAPCO). The physical properties of the studied material as provided by the supplier are as follows: melting temperature, 109 °C; melt flow index, 0.30 g/ 10 min; density, 0.92 g/cm3; and crystal content, 55.5%. The
weight-average molecular weight of the LDPE is equal toMw=164,500 g/mol, while the number-average molecular weight is equal toMn=18,200 g/
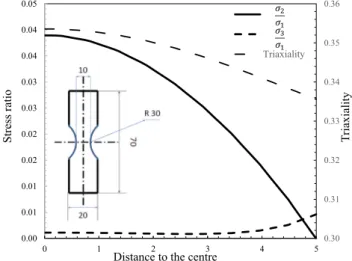
mol. The fatigue samples were cut from plates 2 mm thick. The geo-metry of the specimen is shown inFig. 1. The specimen geometry was designed to localize the deformation at the center zone by imposing a notch radius of 30 mm and hence allowing fatigue crack initiation in the weakest cross section. This choice also obeys the imperative of optimizing the quantity of available material. Finite element analysis
Fig. 1. Stress ratio 2 1 and
3
1 and triaxiality along the mid-width; the inset
was performed to verify that the stress state developed by the specimen was comparable to uniaxial tension. The stress triaxiality ratio
= =
TX H/eq tr( )/3 eq
Ì¿
, defined as the ratio between the hydrostatic stress (the first stress invariant) Hand the equivalent stress (the second
stress invariant) eq, was used to verify that the stress state was close to
uniaxial tension ( =TX 1/3), as highlighted in Fig. 1. Moreover, when
studying the stress distribution along the mid-section, the stress in the loading direction remained prevalent, as also shown inFig. 1. Note that subscripts 1, 2, and 3 indicate the loading, transverse, and thickness directions, respectively.
2.2. UV aging procedure
The LDPE specimens were UV irradiated using an accelerated pho-toaging device (Dymax UV light-curing flood 2000) equipped with a filtered UV-A radiation source emitting light in the wavelength range between 320 and 400 nm. The samples were placed side by side in a tray and then positioned under the UV radiation source. The irradiation process was achieved in the absence of controlled temperature and humidity. The irradiation lamps raised the surface temperature of the specimens to 69 °C. To ensure homogenous UV exposure, all the spe-cimen surfaces were irradiated for the same length of time by peri-odically rotating the specimens along their major axis. The radiance of the photoaging setup was determined by plotting the UV emitted dose as a function of the UV exposure time.Fig. 2shows a linear evolution of the UV emitted dose with exposure time. The slope of the straight line is the radiance C and is equal to 115 kJ/m2/h. In this study, the specimens
were irradiated for 1, 5, 9, 13, and 20 h per surface; the corresponding UV emitted doses are reported in the table inserted inFig. 2.
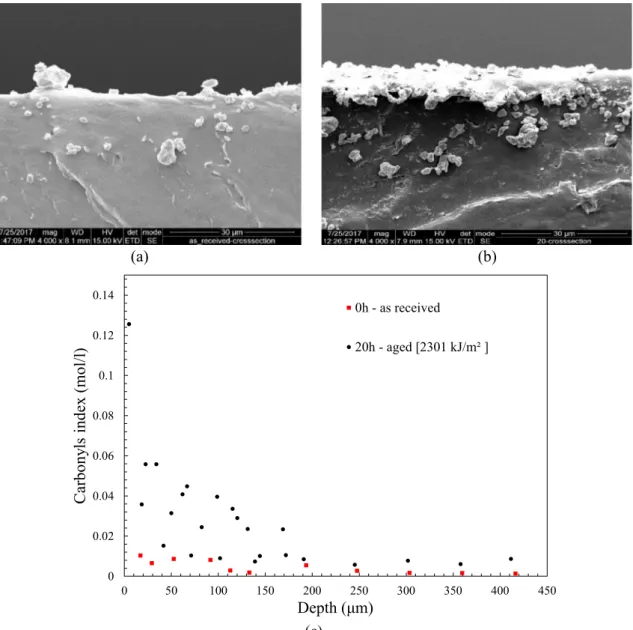
The degradation gradient through the thickness of the UV aged LDPE specimen was analyzed by conducting scanning electron micro-scopy observation (SEM) and Fourier Transform Infrared Spectromicro-scopy (FTIR). SEM was used to study the structural change of the LDPE cross-section after UV aging. The samples were broken in liquid nitrogen to prevent inducing plastic deformation. The samples surfaces were gold coated and observed under a SEM FEI model Quanta 400 with 15 kV voltage and a spot size of 3.5.Fig. 3a and 3c show the cross-sections of virgin and aged (20 h) specimens. Compared to the virgin sample the aged one presents a larger number of deposition distributed on over 10 µm depth from the UV exposed surface. FTIR was used to measure the extent of the photodegradation through the depth of the sample, by measuring the concentration of the carbonyl group. The IR spectra of virgin and photo-oxidized LDPE were determined with a Perkin-Elmer Frontier device within the 4000–400 cm−1range by averaging the 32
scans obtained with a minimal resolution of 4 cm−1. The photo
oxidation reactions of polyethylene are expected to generate carbonyl groups (C=O) such as ketones, aldehydes, carboxylic acids and esters. The absorption bands of the carbonyl groups at a wavelength of 1720 cm−1was followed using a Brucker IFS 28 IR spectrophometer.
The evolution of the carbonyl concentration through the depth (from the UV exposed surface) of the specimen is presented inFig. 3c. Few micron thin layers were extracted at different depth from the surface using a microtome and then analyzed with the FTIR in transmission mode. While the carbonyl concentration of virgin material is very low and constant through the depth, a clear carbonyl concentration gra-dient is observed for the UV aged specimen (20H). The photo de-gradation depth can be estimate from the carbonyl concentration pro-file. The thickness of the superficial oxidized layer reaches a steady value around 180 µm.
2.3. Mechanical tests
Uniaxial tension and fatigue tests were performed using two dif-ferent experimental setups. The uniaxial fatigue tests were performed on an INSTRON ElectroPulse E3000 electromagnetic device equipped with a ± 1 kN load cell. A noncontact video extensometer (VideoTraction©) consisting of a CCD camera interfaced with a com-puter was used to measure the local true strains. This technique consists of following 4 markers printed on the front surface of the sample, 2 of the markers vertically aligned along the tensile direction and the 2 others printed in the smallest cross-section aligned along the transverse direction, as shown inFig. 4. The true stresses were calculated by as-suming incompressibility, i.e., no volume change. The INSTRON Elec-troPulse E3000 allows a maximum crosshead displacement of 60 mm, far below the displacement required for achieving tensile tests up to complete fracture. Therefore, the quasi-static tensile properties up to failure were determined using an electromechanical Instron 5867 de-vice equipped with a ± 1 kN load cell. In this case, the local true strain measurement was not possible because of the large displacements that led the video extensometer to lose track of the markers; hence, only global displacements were available. Consequently, a calibration pro-cedure was implemented by comparing local strains measured by the video extensometer with the calculated strains from the global cross-head displacement.
The force-controlled fatigue tests were performed under a load ratio R equal to 0. The force-controlled condition was more desirable than the displacement-controlled condition so as to avoid the compressive tension loading resulting from the fatigue-induced creep (which in-duces a buckling of the specimen).
3. Experimental results 3.1. Uniaxial tension
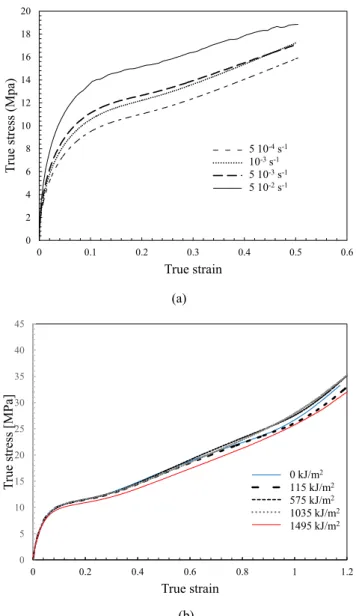
The effect of strain rate on the mechanical behavior of the as-re-ceived LDPE is shown in Fig. 5a. The specimens were subjected to uniaxial tension at room temperatures for local strain rates, controlled by the video extensometer, ranging between 5 10−2s−1and 5 10−4
s−1. The LDPE exhibited a nonlinear behavior characterized by a
homogeneous viscoelastic response followed by a gradual strain hard-ening associated with the alignment of the macromolecular chains with the loading direction and the propagation of necking initiated at yielding at the smallest cross-section. The true stress-true strain beha-vior exhibits a clear dependency on the strain rate. The yield strength increases with increasing strain rate, and at a strain of 0.5 the strength is increased by 18% when increasing the strain rate from 5 10−2s−1to
5 10−4s−1.
The effect of UV aging on the mechanical behavior of LDPE is shown inFig. 5b. The as-received and UV-aged specimens were subjected to uniaxial tension at room temperature for a constant local strain rate of 10−3 s−1. Fig. 5b shows the evolution of the true stress-true strain
Fig. 2. UV dose as a function of time exposure; the inset shows a table with the selected exposure times and their corresponding emitted UV dose.
curves for the as-received and UV-aged specimens exposed to four different emitted doses. The results do not show a significant effect of UV aging on the global mechanical response, although a decrease in the rate of hardening can be noticed with increasing emitted dose.
The effect of UV aging on the fracture behavior was investigated and is discussed in this paragraph. The maximum elongation at failure de-pends on the density of chain entanglements and on the length of the chain segments. A thorough mechanical and physico-chemical char-acterization experimental study by Rodriguez et al.[26]explored the photodegradation mechanisms of LDPE films. The authors reported that chain scission was one of the main degradation mechanisms, mostly operating in the amorphous phase, leading to a significant reduction of the average molecular weight and consequently the ultimate properties such as strain and stress at break.
Fig. 6shows the evolution of the true strain at break with an in-creasing dose of UV exposure. It is observed that the true strain at break decreases with an increasing dose of UV exposure, following an s-shaped curve. At approximately 1150 kJ/m2, a sudden decrease in the
true strain at break is observed, which can be associated with the time-dependent progressive diffusion of damage through the thickness of the specimen. Indeed, oxidation-induced cracking was observed at the ex-posed surfaces and preferentially develops in pre-existent surface Fig. 3. SEM crosssection micrographs of (a) unaged and (b) aged LDPE (20 h), (c) evolution of the carbonyl index through the sample depth.
0 0.2 0.4 0.6 0.8 1 1.2 1.4 1.6 0 0.2 0.4 0.6 0.8 1 1.2 1.4 Lo cal true strai n
Global true strain
Corrective curve 0 kJ/m2 121 kJ/m2 580 kJ/m2 1039 kJ/m2 1498 kJ/m2 uy ux
Fig. 4. Local strain versus global strain; the inset shows the experimental video extensometer setup.
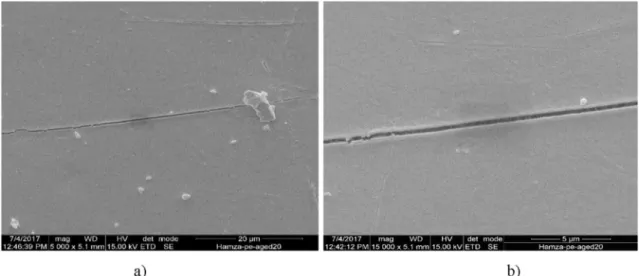
defects, inducing residual stress concentrations[37]. Such cracks ap-pear to propagate preferentially in one direction but present additional ramifications in other directions. These ramifications are explained by the change in the crack propagation direction when reaching ductile areas, which act as barriers. In general, the sample tends to become more brittle with an increasing dose of UV exposure. Audouin and Verdu[62]observed a sharp decrease of ultimate elongation of bulk-aged LDPE when the depth of the oxidized layer is higher than 170–180 μm.Fig. 7shows an SEM micrograph of a specimen irradiated for 20 h (equivalent to a UV exposure dose of 1495 kJ/m2) in which
surface cracks, which we assume were induced by UV irradiation, are observed. When those cracks are of a certain depth they can act as stress raisers, and their multiplication during the aging process leads to an “embrittlement” of the material[63], which consequently decreases the capability of the material to deform and then induces the observed decrease of the strain at break.
3.2. Fatigue results
As mentioned previously, the force-controlled fatigue tests were preferred over the displacement-fatigue-controlled condition to avoid the specimen buckling that would result from the creep-induced cyclic residual strain. The fatigue tests were performed by imposing a trian-gular wave function at room temperature under a frequency of 1 Hz. The frequency of 1 Hz was selected to minimize the strain rate and self-heating effects on the fatigue life of LDPE. The force-controlled fatigue tests were performed at a load ratio =R min/ max equal to 0 on the
specimens exposed to different UV doses, where max is the maximum
applied stress and min is the minimum stress, chosen to be equal to
zero. The Wöhler curve was plotted by varying the maximum stress amplitude and defining a criterion for stopping the tests. Fatigue life prediction is usually associated with crack initiation, and in the lit-erature a criterion such as the development of a 1 mm-size crack is used to stop the test. Since it was difficult to detect crack initiation in the LDPE specimens, the fatigue life was defined as the number of cycles at complete failure.
3.2.1. Aging fatigue indicator based on the maximum true stress
The calibration procedure described previously was used to com-pute the true stress and true strain evolution with the number of cycles.
Fig. 8shows the evolutions of the true stress, the true strain, and the engineering stress as a function of the number of cycles for an applied maximum engineering stress max= 8.9 MPa. As expected, a very small fluctuation of the maximum engineering stress (~0.04 MPa which corresponds to ~0.4% deviation from the maximum stress) is observed, with an average value that stays constant during the fatigue test. The reported fluctuation is certainly induced by the electronic servo-control of the load that is challenging to achieve when investigating soft ma-terials. Although some oscillation is observed, the maximum true strain and stress increase with the number of cycles. The evolution of the true stress with the number of cycles follows an S-shaped reverse curve, and we can clearly distinguish three zones: (i) a stress hardening, followed by a (ii) steady state zone with weak variation of the stress, and finally (iii) a fast increase of the stress before failure.
The Wöhler curves of the as-received and aged LDPE material are presented inFig. 9. The applied true stress used to plot the Wöhler curves was taken as equal to the average of the true stress on the steady-state zone. Only three sets of data are reported inFig. 9for clarity; however, the two other sets exhibit the same trends. The figure shows a high scattering of the data, which is commonly observed when in-vestigating the fatigue life of thermoplastics. This stochastic behavior can be partly associated with the sensitivity of crack initiation to the heterogeneities induced by the compression-molding process[43,44]
(leading to a heterogeneous microstructure). Although the data are scattered, the effect of aging on the fatigue life of LDPE is noticeable. The fatigue life of LDPE decreases with an increasing dose of UV Fig. 5. (a) True stress as a function of true strain for different strain rates. (b)
True stress as a function of true strain for different time exposures to UV ra-diation.
exposure. A maximum decrease of the fatigue life by a factor of 1000 is noticed between the fatigue data of the as-received material and the 2300 kJ/m2aging condition. The highly nonlinear Wöhler curves can
be approximated using the Ostrohmeyer model, expressed as follows:
= D+a e1 b ln N1 ( )f (1)
where is the true stress, Dis the fatigue limit,a1andb1are fitting
parameters and Nf is the fatigue life (number of cycles at failure). The
evolution of the applied true stress as a function of the fatigue life ac-cording to Eq.(1) is plotted as continuous lines in Fig. 9. Table 1
summarizes the Ostrohmeyer model parameters used to fit the experi-mental data of all the fatigue conditions.
It is worth noting inTable 1that fatigue limit Ddecreases while
parameter b, which controls the slope of the curve, increases with re-spect to UV exposure dose. The dependency of the Wöhler curves’ slope on the UV exposure dose was reported in the literature for variable R load ratios [64] and for notched specimens[65]. As discussed pre-viously, the UV aging leads to an alteration of the physicochemical properties along a thin layer from the surface of the polymer, and hence mechanical and physical properties gradients exist through the thick-ness. Consequently, although the macroscopic R ratio is 0, an evolving local R ratio can exist resulting from the residual stresses developed between the aged LDPE layers. The photodegradation of the bulk spe-cimen surface and the UV radiation-induced microcracks, acting as stress raisers, strongly influence the fatigue properties even at low stress levels[66]. Although the provided explanations may qualitatively ex-plain the effect of UV aging on the fatigue life of LDPE bulk specimens, it seems difficult from a quantitative point of view to effectively esti-mate the stress concentration coefficient.
Fig. 10presents a comparison between the predictions of the Os-trohmeyer model and the experimental fatigue life data for the different aging conditions. The fatigue data are plotted in a diagram with the experimental fatigue life as ordinate and the predicted life as abscissa. The data are highly scattered, although the majority of the points are contained within the scattering band of 10.Fig. 10clearly highlights Fig. 7. SEM micrograph of an irradiated surface (20 h): (a) cracks network; (b) magnified view of a crack.
Fig. 8. Evolution of the true stress, the engineering stress, and the true strain with the number of cycles for as-received material and the applied maximum engineering stress max= 8.9 MPa.
Fig. 9. Wöhler curves for different UV aging conditions (markers: experimental data; continuous lines: Ostrohmeyer model).
Table 1
Parameters of Eq.(1).
Exposure time (h)/ absorbed dose (kJ/m2) σ
D(MPa) a1(MPa) b1 0 / 0 9 6.5 0.15 1/ 115 7.2 11 0.17 9 / 1035 6.7 20 0.21 13 / 1495 5 29 0.22 20 / 2300 3 33 0.22
the inability of the Ostrohmeyer model to predict the fatigue life at high-cycle fatigue. To decrease the data scattering, a different fatigue predictor is explored in the next section.
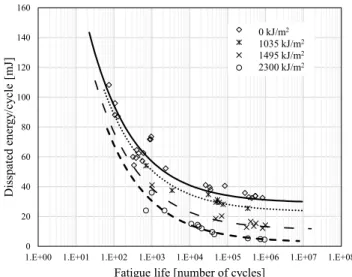
3.2.2. Aging fatigue indicator based on the dissipated energy
In this section, the dissipated energy per cycle is suggested as an alternative fatigue predictor. The dissipated energy is defined as the area of the hysteresis loop formed by the true stress-true strain response under cyclic loading. The evolution of the dissipated energy as a function of the number of cycles for three different fatigue-test and aging conditions is presented inFig. 11. Although only three examples are reported in this figure, similar trends were observed for all the performed tests. Three zones can be distinguished in the evolution of the dissipated energy as a function of the number of cycles: (i) a drop due to the energy associated with the material softening, followed by (ii) a steady-state phase and finally (iii) a fast increase of the dissipated energy before failure. We propose to use the average dissipated energy per cycle in the steady-state zone as the fatigue predictor.
The Wöhler curves of the as-received and aged LDPE material using the dissipated energy are presented inFig. 12. A significant reduction of the data scattering is observed when compared toFig. 9. The evolution of the highly nonlinear dissipated energy as a function of the fatigue life can be approximated using a modified Ostrohmeyer model, expressed as follows:
= +
W WD a e2 b ln N2 ( )f (2)
where W is the dissipated energy,WDis the dissipated energy threshold,
a2 andb2are fitting parameters, and Nf is the fatigue life (number of
cycles at failure). The evolution of the applied true stress as function of the fatigue life according to Eq.(2)is plotted as continuous lines in
Fig. 12. The figure shows that the experimental fatigue data points are arranged close to the modified Ostrohmeyer model plots. Table 2
summarizes the modified Ostrohmeyer model parameters used to fit all the fatigue-conditions experimental data. It is noticed that only the dissipated energy thresholdWDevolves with the evolving UV exposure
dose, while the other parameters remain constant.
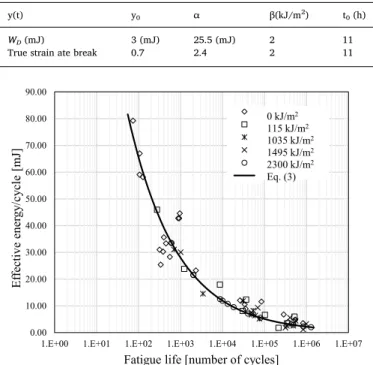
Since only the parameterWDis dependent on the aging condition,
the effective dissipated energy W(t) is defined by rewriting Eq.(2)as follows:
= =
W W tD( ) w t( ) a e2 b ln N2 ( )f (3)
The resulting equation is independent of the aging condition, and therefore a master curve that can unify the whole data set by a simple transformation is obtained. The evolution of the dissipated energy thresholdWDas a function of exposure time can be approximated by an
S-shaped curve as shown inFig. 13. The evolution of the dissipated energy thresholdWDas a function of exposure time follows the same
trend as the evolution of the strain at break, which confirms that the fracture under fatigue loading is essentially strain controlled. These evolutions of both variables are expressed using the same general normalized equation as follows:
= +
y t( ) y C t t
(1 exp ( )
0 0 1
(4) The parameters involved in Eq.(4)are given inTable 3. C is the radiance and depends on the UV aging setup of 115 kJ/m2/h; β and t
0 are parameters controlling the shape and transition of the evolution curve. Only y0and α depend on the variable.
Fig. 10. Comparison between predicted and experimental fatigue life results using the Ostrohmeyer model.
Fig. 11. Dissipated energy per cycle as a function of the number of cycles for LDPE.
Fig. 12. Dissipated energy per cycle versus fatigue life (markers: experimental data, continuous lines: modified Ostrohmeyer model).
Table 2
Parameters of modified Ostrohmeyer model (Eq.(2)).
Exposure time [h] / Absorbed dose (kJ/m2) W
D(mJ) a (mJ) b 0 / 0 29 360 0.37 1 / 115 27.5 360 0.37 9 / 1035 23 360 0.37 13 / 1495 11 360 0.37 20 / 2300 2.5 360 0.37
The evolution of the effective dissipated energy W(t) as a function of the fatigue life is plotted inFig. 14. W(t) is found to unify the fatigue life from the different aging conditions, which again confirms the re-levance of the dissipated energy as a fatigue criterion.Fig. 15presents a comparison between the predictions of the normalized modified Os-trohmeyer model (Eq.(3)) and the experimental fatigue life data for the different aging conditions. The data are arranged around the median line with slight scattering, and the majority of the points are contained within the scattering band of 10, proving the validity of our model.
Of course, the foregoing does not constitute a validation of the predictive capability of Eq.(5), because the parameters were fitted by accounting for the whole of the available data. However, remembering and assuming that only the energy threshold is affected by UV aging, the knowledge of its evolution as a function of time exposure may allow good estimates of the fatigue life.
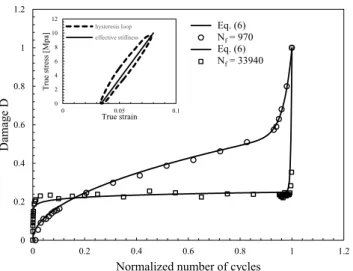
4. Damage quantification
In this section, the damage accumulation is computed from the experimental cyclic true stress-true strain results. The difference in the damage accumulation with the number of cycles for the different aging conditions is attributed to different microscale mechanisms. The cyclic loading creep is a macroscale phenomenon correlated with complex microscale mechanisms such as the entanglement-disentanglement of macromolecular chains. Moreover, chain scission is an irreversible process leading to a reduction of the entanglement density and thus to a progressive loss in the plastic deformation capacity of the amorphous phase[21,26,67]. According to the statistical theory of Saito[67,68], the probability of the occurrence of chain scission is inversely propor-tional to the molecular mass. In other words, chain scission would affect primarily the short chains of the macromolecular network. Finally, UV radiation-induced chain scission could accelerate this last phenomenon. Hence, a phenomenological damage parameter is a macroscopic quantity that can account for all damage micro-mechanisms. Therefore, to predict the fatigue behavior of aged LDPE we propose an aging fa-tigue indicator based on the damage. Damage is generally associated at the macroscale with the loss of material stiffness during fatigue loading. Therefore, we propose to calculate the effective stiffness and its evo-lution as a function of the number of cycles from the strain–stress hysteresis loops. This effective stiffness E N( )at a given cycle N is the slope of the hysteresis loop’s major axis, as schematically shown in the
Fig. 16inset. The damageDis here defined according to the following equation: = D E N E 1 ( ) 0 (5)
whereE0is the initial value of the stiffness.
Fig. 16shows two typical examples of damage evolutions that were recorded for, respectively, a high- and a low-cycle fatigue of an as-re-ceived LDPE. The same trends were observed for all the performed fa-tigue experiments. This kind of evolution has already been reported in the literature[69,70]and can be fitted as follows:
= + D q N N q N N (1 ) f m f n (6) where q, m, and n are damage variables to be determined; these parameters depend on the loading parameter (i.e., the effective dis-sipated energy W). The parameter q controls the average level of the damage, m the intensity of the drop in the beginning of the loading, and n the final stage of the damage process. As a first step, the evolutions of Fig. 13. Dissipated energy threshold and true strain at break versus exposure
time (markers: experimental data, continuous lines: Eq.(4)). Table 3
Parameters of Eq.(4).
y(t) y0 α β(kJ/m2) t0(h)
WD(mJ) 3 (mJ) 25.5 (mJ) 2 11
True strain ate break 0.7 2.4 2 11
Fig. 14. Effective dissipated energy per cycle versus fatigue life (markers: ex-perimental data, continuous lines: Eq.(3)).
Fig. 15. Comparison between predicted and experimental fatigue life results using the modified Ostrohmeyer model.
the damage parameter were determined for only the received material.
Fig. 17show the evolution of the parameter n and of the ratios n m
andm
q as a function of the effective dissipated energy W . These different
evolutions can be empirically fitted using the following equations, where α1, α2, α3, β1,and β2are parameters to be identified, the values of which are reported inTable 4.
= = = n W a W b Wc ) ) ) n m m q 1 2 3 1 2 (7) As shown inFig. 17, parameter n decreases when W increases, ac-cording to a power law evolution. When the loading level is high (low-cycle fatigue), the stationary phase of the damage evolution is drasti-cally reduced. On the opposite side, when the loading corresponds to high-cycle fatigue (low values of W ), the stationary phase is pre-dominant up to sudden fracture, which is characterized by high values of n. Similar evolution of the ration
mis observed. Indeed, for high-cycle
fatigue, the high values of n combined with low values of m correlate with the sudden increase of the damage at the beginning of the fatigue test. Finally, a linear evolution of the ratiom
q is selected. The parameter
q (which is an average value of the damage) slowly increases with re-spect to W , while at the same time m increases more rapidly because of the reduction of the stationary phase.
From Eq.(3), the fatigue life is expressed asNf= b1ln
( )
w ta( ) , and by combining Eqs.(6) and (7), we can explicitly derive the equation for the damageDas follows:Fig. 16. Damage evolution as a function of the normalized number of cycles
N
Nf (as-received material); the inset provides a schematic definition of the
effective stiffness.
Fig. 17. Evolution of (a) the parameter n, (b) the ration
m, and (c) the ratio m
q as a function of the effective dissipated energy W (as-received material).
Table 4
Parameters of Eq.(7).
α1 α2 α3 β1 β2
= +
( )
( )
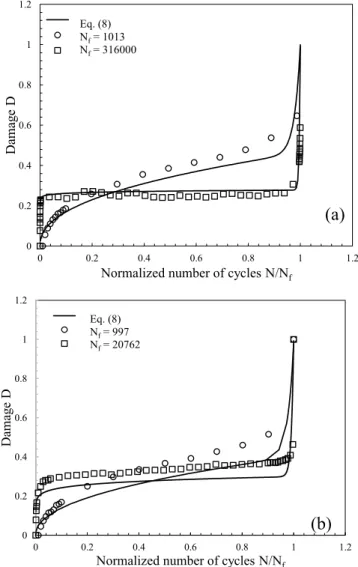
D w N w N ln 1 ln b w a w b w a w 1 2 3 ( 1) 1 1 2 3 ( 1) 1 1 2 1 2 ( 1 2) 1 2 1 1 (8) The predictive capability of the proposed damage model is illu-strated by Fig. 18a and 18b, which show a comparison between the experimental data and the model results. While Eq.(8)was calibrated on the damage evolution of the as-received LDPE,Fig. 18presents the model predictions for the UV-aged LDPE.Fig. 18shows a good corre-lation between the experimental results and the model predictions. The validation of the model was performed on the data sets of one low-cycle fatigue and one high-cycle fatigue. Therefore, Eq.(8)allows estimation of the fatigue life when the value of the damage reaches unity.Fig. 19 presents a comparison between the predictions of the da-mage indicator Eq. (8) and the experimental fatigue life data for the different aging conditions. Fig. 19 presents the predictions of the model calibrated on only the as-received dataset for all the UV-aged LDPE specimens. The data are arranged around the median line with slight scattering, and the majority of the points are contained within the scattering band of 10, proving the validity of the proposed model. The relevance of the proposed damage indicator should be examined in future work on more complex fatigue loading conditions, such as
random loading, biaxial loading, etc. 5. Conclusion
In this study, the effect of UV irradiation on the fatigue life of bulk semi-crystalline LDPE was investigated. Tensile specimens were ex-tracted from 2 mm-thick LDPE plates and then exposed to different UV irradiation doses before fatigue testing. Constant stress-amplitude ten-sile fatigue tests were performed on the as-received and UV-aged spe-cimens. The experimental results showed an important decrease in the fatigue properties with increasing UV-irradiation dose. Fatigue in-dicators for UV-aged materials were developed based on the maximum measured true stress and the dissipated energy per cycle. The evolution of the highly nonlinear the maximum measured true stress and the dissipated energy as a function of the fatigue life was approximated using a modified Ostrohmeyer model. The fatigue indicator based on dissipated energy per cycle was found to present the best correlation with the experimental fatigue results. Furthermore, the parameters of the modified Ostrohmeyer model were found to be independent of UV irradiation doses, except for the dissipated energy threshold WD. Indeed, a master curve, which can be used as a shift factor, unifying the experimental fatigue results for the as-received and UV-aged LDPE was obtained when using the effective dissipated energy (the difference between the total dissipated energy and the dissipated energy threshold). Finally, the evolution of the s-shaped damage with cyclic loading for the as-received and UV-aged LDPE was analyzed. A strong dependency of the damage evolution on the effective dissipated energy was noticed. The damage evolution was captured using a modified rule of mixture, with three model parameters dependent on the effective dissipated energy. The model parameters were calibrated on the ex-perimental fatigue results of the as-received material. A good correla-tion between the experimental results and the model prediccorrela-tions for the UV-aged LDPE was found. Furthermore, satisfactory fatigue life pre-dictions for UV-aged LDPE were obtained.
In this work, the proposed damage model was developed for uni-axial loading conditions. The validity of the approach should be ex-tended for multiaxial loading conditions by developing a three di-mensional mathematical damage framework. Hence, the relevance of the proposed damage approach will be examined in future work on more complex fatigue loading conditions, such as random loading, biaxial loading, etc.
(a)
(b)
Fig. 18. Damage as a function of N/Nffor two times of exposure: (a) 1495 kJ/
m2and (b) 2300 kJ/m2. Comparison between experimental data and model
estimates for UV-aged materials.
Fig. 19. Comparison between predicted and experimental fatigue life results using the derived damage expression.
Declaration of Competing Interest
The authors declare that they have no known competing financial interests or personal relationships that could have appeared to influ-ence the work reported in this paper.
Acknowledgments
This research was supported by the Qatar National Research Fund (NPRP grant No. 7-1562-2-571). We would like to acknowledge the fruitful discussions with Profs. Eddine Gherdaoui and Jean-Michel Gloaguen of the University of Lille.
References
[1] Abdelkader D, Mostefa B, Abdelkrim A, Abderrahim T, Noureddine B, Mohamed B. Fatigue life prediction and damage modelling of high-density polyethylene under constant and two-block loading. Procedia Eng 2015;101:2–9.https://doi.org/10. 1016/j.proeng.2015.02.002.
[2] Babaghayou MI, Mourad A-HI, Lorenzo V, de la Orden MU, Martínez Urreaga J, Chabira SF, et al. Photodegradation characterization and heterogeneity evaluation of the exposed and unexposed faces of stabilized and unstabilized LDPE films. Mater Des 2016;111:279–90.https://doi.org/10.1016/j.matdes.2016.08.065.
[3] François-Heude A, Richaud E, Desnoux E, Colin X. Influence of temperature, UV-light wavelength and intensity on polypropylene photothermal oxidation. Polym Degrad Stab 2014;100:10–20.https://doi.org/10.1016/j.polymdegradstab.2013. 12.038.
[4] Franҫois-Heude A, Richaud E, Desnoux E, Colin X. A general kinetic model for the photothermal oxidation of polypropylene. J Photochem Photobiol A Chem 2015;296:48–65.https://doi.org/10.1016/j.jphotochem.2014.08.015.
[5] Michelot H, Fu S, Stuart B, Shimmon R, Raymond T, Crandell T, et al. Effect of drug precursors and chemicals relevant to clandestine laboratory investigation on plastic bags used for collection and storage. Forensic Sci Int 2017;273:106–12.https://doi. org/10.1016/j.forsciint.2017.02.007.
[6] Xavier C, Ludmila A, Jacques V, Magali R-E, Benjamin R, Florencio M, et al. Aging of polyethylene pipes transporting drinking water disinfected by chlorine dioxide. Part II—Lifetime prediction. Polym Eng Sci 2009;49:1642–52.https://doi.org/10. 1002/pen.21387.
[7] Mikdam A, Colin X, Minard G, Billon N, Maurin R. A kinetic model for predicting the oxidative degradation of additive free polyethylene in bleach desinfected water. Polym Degrad Stab 2017;146:78–94.https://doi.org/10.1016/j.polymdegradstab. 2017.09.020.
[8] Khelidj N, Colin X, Audouin L, Verdu J, Monchy-Leroy C, Prunier V. Oxidation of polyethylene under irradiation at low temperature and low dose rate. Part II. Low temperature thermal oxidation. Polym Degrad Stab 2006;91:1598–605.https://doi. org/10.1016/j.polymdegradstab.2005.09.012.
[9] Sarrabi S, Colin X, Tcharkhtchi A. Kinetic modeling of polypropylene thermal oxi-dation during its processing by rotational molding. J Appl Polym Sci 2010;118.
https://doi.org/10.1002/app.32459.
[10] Da Cruz M, Van Schoors L, Benzarti K, Colin X. Thermo-oxidative degradation of additive free polyethylene. Part I. Analysis of chemical modifications at molecular and macromolecular scales. J Appl Polym Sci 2015;133.https://doi.org/10.1002/ app.43287.
[11] White JR, Teh JW. Fatigue of viscoelastic polymers: 2. Fractography. Polymer (Guildf) 1979;20:764–71.https://doi.org/10.1016/0032-3861(79)90252-0. [12] Ayoub G, Zaïri F, Fréderix C, Gloaguen JM, Naït-Abdelaziz M, Seguela R, et al.
Effects of crystal content on the mechanical behaviour of polyethylene under finite strains: experiments and constitutive modelling. Int J Plast 2011;27.https://doi. org/10.1016/j.ijplas.2010.07.005.
[13] Makki M, Ayoub G, Abdul-Hameed H, Zaïri F, Mansoor B, Naït-Abdelaziz M, et al. Mullins effect in polyethylene and its dependency on crystal content: a network alteration model. J Mech Behav Biomed Mater 2017;75.https://doi.org/10.1016/j. jmbbm.2017.04.022.
[14] Kumar Sen S, Raut S. Microbial degradation of low density polyethylene (LDPE): a review. J Environ Chem Eng 2015;3:462–73.https://doi.org/10.1016/j.jece.2015. 01.003.
[15] Feldman D. Polymer weathering: photo-oxidation. J Polym Environ 2002;10:163–73.https://doi.org/10.1023/A:1021148205366.
[16] Kyrikou I, Briassoulis D. Biodegradation of agricultural plastic films: a critical re-view. J Polym Environ 2007;15:125–50. https://doi.org/10.1007/s10924-007-0053-8.
[17] Sebaa M, Servens C, Pouyet J. Natural and artificial weathering of low-density polyethylene (Ldpe) – calorimetric analysis. J Appl Polym Sci 1993;47:1897.
https://doi.org/10.1002/app.1993.070471101.
[18] Briassoulis D, Aristopoulou A, Bonora M, Verlodt I. Degradation characterisation of agricultural low-density polyethylene films. Biosyst Eng 2004;88:131–43.https:// doi.org/10.1016/j.biosystemseng.2004.02.010.
[19] Carrasco F, Pagès P, Pascual S, Colom X. Artificial aging of high-density poly-ethylene by ultraviolet irradiation. Eur Polym J 2001;37:1457–64.https://doi.org/ 10.1016/S0014-3057(00)00251-2.
[20] Chabira SF, Sebaa M, Huchon R, De Jeso B. The changing anisotropy character of
weathered low-density polyethylene films recognized by quasi-static and ultrasonic mechanical testing. Polym Degrad Stab 2006;91:1887–95.https://doi.org/10. 1016/j.polymdegradstab.2005.11.007.
[21] Fayolle B, Richaud E, Colin X, Verdu J. Review: Degradation-induced embrittlement in semi-crystalline polymers having their amorphous phase in rubbery state. J Mater Sci 2008;43:6999–7012.https://doi.org/10.1007/s10853-008-3005-3. [22] Fayolle B, Colin X, Audouin L, Verdu J. Mechanism of degradation induced
em-brittlement in polyethylene. Polym Degrad Stab 2007;92:231–8.https://doi.org/ 10.1016/j.polymdegradstab.2006.11.012.
[23] Hsu Y-C, Weir MP, Truss RW, Garvey CJ, Nicholson TM, Halley PJ. A fundamental study on photo-oxidative degradation of linear low density polyethylene films at embrittlement. Polymer (Guildf) 2012;53:2385–93.https://doi.org/10.1016/j. polymer.2012.03.044.
[24] Liu M, Horrocks AR, Hall ME. Correlation of physicochemical changes in UV-ex-posed low density polyethylene films containing various UV stabilisers. Polym Degrad Stab 1995;49:151–61.https://doi.org/10.1016/0141-3910(95)00036-L. [25] Miyagawa E, Tokumitsu K, Tanaka A, Nitta K hei. Mechanical property and
mole-cular weight distribution changes with photo- and chemical-degradation on LDPE films. Polym Degrad Stab 2007;92:1948–56. https://doi.org/10.1016/j.poly-mdegradstab.2007.05.019.
[26] Rodriguez AK, Mansoor B, Ayoub G, Colin X, Benzerga AA. Effect of UV-aging on the mechanical and fracture behavior of low density polyethylene. 109185 Polym Degrad Stab2020.https://doi.org/10.1016/J.POLYMDEGRADSTAB.2020.109185. [27] Brydson J. Plastics Materials (7th Edition) - 10 Polyethylene - Knovel. 1999. [28] Rabek JF. Physical aspects of the photodegradation of polymers. Polym.
Photodegradation: Springer, Dordrecht; 1995. p. 1–23.
[29] Roy PK, Surekha P, Raman R, Rajagopal C. Investigating the role of metal oxidation state on the degradation behaviour of LDPE. Polym Degrad Stab 2009;94:1033–9.
https://doi.org/10.1016/j.polymdegradstab.2009.04.025.
[30] Koutny M, Lemaire J, Delort A-M. Biodegradation of polyethylene films with prooxidant additives. Chemosphere 2006;64:1243–52.https://doi.org/10.1016/j. chemosphere.2005.12.060.
[31] White JR, Shyichuk AV. Macromolecular scission and crosslinking rate changes during polyolefin photo-oxidation. Polym Degrad Stab 2007;92:1161–8.https:// doi.org/10.1016/j.polymdegradstab.2007.04.011.
[32] Tidjani A. Comparison of formation of oxidation products during photo-oxidation of linear low density polyethylene under different natural and accelerated weathering conditions. Polym Degrad Stab 2000;68:465–9. https://doi.org/10.1016/S0141-3910(00)00039-2.
[33] Şener S, Sarıdoğan E, Staub S, Adelhafidi A, Babaghayou IM, Chabira SF, et al. World Conference on Technology, Innovation and EntrepreneurshipImpact of Solar Radiation Effects on the Physicochemical Properties of Polyethylene (PE) Plastic Film. Procedia - Soc Behav Sci 2015;195:2210–7. https://doi.org/10.1016/j.sbspro. 2015.06.302.
[34] Rolón-Garrido VH, Kruse M, Wagner MH. Size exclusion chromatography of photo-oxidated LDPE by triple detection and its relation to rheological behavior. Polym Degrad Stab 2015;111:46–54.https://doi.org/10.1016/J.POLYMDEGRADSTAB. 2014.10.022.
[35] Tavares AC, Gulmine JV, Lepienski CM, Akcelrud L. The effect of accelerated aging on the surface mechanical properties of polyethylene. Polym Degrad Stab 2003;81:367–73.https://doi.org/10.1016/S0141-3910(03)00108-3.
[36] Cunliffe AV, Davis A. Photo-oxidation of thick polymer samples—Part II: The in-fluence of oxygen diffusion on the natural and artificial weathering of polyolefins. Polym Degrad Stab 1982;4:17–37.https://doi.org/10.1016/0141-3910(82) 90003-9.
[37] Yakimets I, Lai D, Guigon M. Effect of photo-oxidation cracks on behaviour of thick polypropylene samples. Polym Degrad Stab 2004;86:59–67.https://doi.org/10. 1016/j.polymdegradstab.2004.01.013.
[38] Valadez-Gonzalez A, Cervantes-Uc JM, Veleva L. Mineral filler influence on the photo-oxidation of high density polyethylene: I. Accelerated UV chamber exposure test. Polym Degrad Stab 1999;63:253–60. https://doi.org/10.1016/S0141-3910(98)00102-5.
[39] Kelly CT, White JR. Photo-degradation of polyethylene and polypropylene at slow strain-rate. Polym Degrad Stab 1997;56:367–83. https://doi.org/10.1016/S0141-3910(96)00205-4.
[40] Gulmine JVV, Janissek PRR, Heise HMM, Akcelrud L. Degradation profile of polyethylene after artificial accelerated weathering. Polym Degrad Stab 2003;79:385–97.https://doi.org/10.1016/S0141-3910(02)00338-5.
[41] Pruitt LA. Deformation, yielding, fracture and fatigue behavior of conventional and highly cross-linked ultra high molecular weight polyethylene. Biomaterials 2005;26:905–15.https://doi.org/10.1016/j.biomaterials.2004.03.022. [42] Sauer JA, Richardson GC. Fatigue of polymers. Int J Fract 1980;16:499–532.
https://doi.org/10.1007/BF02265215.
[43] Qi Z, Hu N, Li Z, Zeng D, Su X. A stress-based model for fatigue life prediction of high density polyethylene under complicated loading conditions. Int J Fatigue 2019;119:281–9.https://doi.org/10.1016/j.ijfatigue.2018.10.007.
[44] Amjadi M, Fatemi A. Multiaxial fatigue behavior of thermoplastics including mean stress and notch effects: Experiments and modeling. Int J Fatigue 2020;136:105571.
https://doi.org/10.1016/j.ijfatigue.2020.105571.
[45] Risitano G, Guglielmino E, Santonocito D. Evaluation of mechanical properties of polyethylene for pipes by energy approach during tensile and fatigue tests. Procedia Struct Integr 2018;13:1663–9.https://doi.org/10.1016/j.prostr.2018.12.348. [46] Zhang Y, Ben Jar P-Y, Xue S, Li L, Han L. Damage evolution in high density
poly-ethylene under tensile, compressive, creep and fatigue loading conditions. Eng Fract Mech 2019;215:112–6.https://doi.org/10.1016/j.engfracmech.2019.05.008. [47] Raphael I, Saintier N, Robert G, Béga J, Laiarinandrasana L. On the role of the
spherulitic microstructure in fatigue damage of pure polymer and glass-fiber re-inforced semi-crystalline polyamide 6.6. Int J Fatigue 2019;126:44–54.https://doi. org/10.1016/j.ijfatigue.2019.04.036.
[48] Shrestha R, Simsiriwong J, Shamsaei N, Moser RD. Cyclic deformation and fatigue behavior of polyether ether ketone (PEEK). Int J Fatigue 2016;82, Part 3:411–27. https://doi.org/10.1016/j.ijfatigue.2015.08.022.
[49] Shrestha R, Simsiriwong J, Shamsaei N. Fatigue modeling for a thermoplastic polymer under mean strain and variable amplitude loadings. Int J Fatigue 2017;100:429–43.https://doi.org/10.1016/j.ijfatigue.2017.03.047.
[50] Shojaei AK, Volgers P. A coupled hyperelastic-plastic-continuum damage model for studying cyclic behavior of unfilled engineering polymers. Int J Fatigue 2018;107:33–9.https://doi.org/10.1016/j.ijfatigue.2017.10.006.
[51] Yang J, Kang G, Liu Y, Chen K, Kan Q. Life prediction for rate-dependent low-cycle fatigue of PA6 polymer considering ratchetting: Semi-empirical model and neural network based approach. Int J Fatigue 2020;136:105619https://doi.org/10.1016/j. ijfatigue.2020.105619.
[52] Chudnovsky A, Zhou Z, Zhang H, Sehanobish K. Lifetime assessment of engineering thermoplastics. Int J Eng Sci 2012;59:108–39.https://doi.org/10.1016/j.ijengsci. 2012.03.016.
[53] Naruse T, Hattori T, Yamaguchi Y, Kanai T, Sekiya T. Thermal degradation of chlorosulfonated polyethylene rubber and ethylene propylene diene terpolymer. Mater Des 2012;42:147–55.https://doi.org/10.1016/j.matdes.2012.05.038. [54] Chou H-W, Huang J-S, Lin S-T. Effects of thermal aging on fatigue of carbon
black–reinforced EPDM rubber. J Appl Polym Sci 2007;103:1244–51.https://doi. org/10.1002/app.24967.
[55] Ulu KN, Huneau B, Verron E, Heuillet P, Béranger A-S. Fatigue of HNBR blends and the effects of thermal ageing. Procedia Eng 2018;213:153–60.https://doi.org/10. 1016/j.proeng.2018.02.017.
[56] Ivanova E, Chudnovsky A, Wu S, Sehanobish K, Bosnyak CP. The effect of UV ra-diation on fatigue behavior of polymers. Pro- Ceedings ANTEC 1995;95:3893–7. [57] Wee J-W, Choi M-S, Hyun H-C, Hwang J-H, Choi B-H. Effect of weathering-induced
degradation on the fracture and fatigue characteristics of injection-molded poly-propylene/talc composites. Int J Fatigue 2018;117:111–20.https://doi.org/10. 1016/j.ijfatigue.2018.07.022.
[58] Tanaka K, Kamimura A, Katayama T, Kinoshita S, Sakoda H, Kuramoto K. Influence of environmental degradation and vitamin-E (a-Tocopherol) addition on the fatigue crack growth property of ultra high molecular weight polyethylene. Zairyo 2008;57:875–81.
[59] Benson RS, Martinez Pardo ME. Fatigue crack propagation behavior of gamma ir-radiated LDPE films. Nucl Instruments Methods Phys Res Sect B Beam Interact with Mater Atoms 1998;141:202–5.https://doi.org/10.1016/S0168-583X(98)00067-6. [60] Glaser B, Raue F, Groos G. Cross section ovalization of LDPE reactor tube bends and
the effect on fatigue lifetime. ASME-PUBLICATIONS-PVP 2000;406:37–40. [61] Lamnii H, Nait-Abdelaziz M, Ayoub G, Gloaguen J-M, Maschke U, Mansoor B. Effect
of UV Ageing on the fatigue life of bulk polyethylene. MATEC Web Conf., vol. 165, 2018. https://doi.org/10.1051/matecconf/201816508002.
[62] Audouin L, Verdu J. Change in Mechanical Properties of Low-Density Polyethylene during Radiochemical Aging 1991.
[63] Raquez J-M, Bourgeois A, Jacobs H, Degée P, Alexandre M, Dubois P. Oxidative degradations of oxodegradable LDPE enhanced with thermoplastic pea starch: Thermo-mechanical properties, morphology, and UV-ageing studies. J Appl Polym Sci 2011;122:489–96.https://doi.org/10.1002/app.34190.
[64] Guedes RM. Creep and Fatigue in Polymer Matrix Composites. Elsevier; 2010. [65] Prabhakaran R, Nair EMS, Sinha PK. Notch sensitivity of polymers. J Appl Polym Sci
1978;22:3011–20.
[66] Schoolenberg GE. A fracture mechanics approach to the effects of UV-degradation on polypropylene. J Mater Sci 1988;23:1580–90.https://doi.org/10.1007/ BF01115695.
[67] Saito O. On the effect of high energy radiation to polymers I. Cross-linking and degradation. J Phys Soc Japan 1958;13:198.https://doi.org/10.1143/JPSJ.13.198. [68] Saito O. Effects of high energy radiation on polymers II. End’linking and gel
frac-tion. J Phys Soc Japan 1958;13:1451–64.https://doi.org/10.1143/JPSJ.13.1451. [69] Mao H, Mahadevan S. Fatigue damage modelling of composite materials. Compos
Struct 2002;58:405–10.https://doi.org/10.1016/S0263-8223(02)00126-5. [70] He M, Li N, Zhu C, Chen Y, Wu H. Experimental investigation and damage modeling
of salt rock subjected to fatigue loading. Int J Rock Mech Min Sci 2019;114:17–23.