Particle-in-particle morphology for the dispersed phase formed in reactive
compatibilization of SAN/EPDM blends
C. Pagnoulle and R. Jérôme
University of Liège, Center for Education and Research on Macromolecules (CERM), Sart-Tilman, B6a, 4000 Liège, Belgium
Abstract
Poly(ethylene-co-propylene-co-diene) (EPDM) containing 50 wt% of poly(ethylene-co-propylene) grafted with maleic anhydride (EP-g-MA) has been melt blended with poly(styrene-co-acrylonitrile) (SAN) added with various amounts of reactive SAN, i.e. SAN bearing either primary amine (SAN-NH2) or carbamate groups
(SAN-carb). Carbamate groups are precursors of primary amines by thermal thermolysis during melt processing. These reactive systems are good models for studying the effect of the kinetics of the interfacial reaction on the phase morphology. Reaction of maleic anhydride with the primary amine is indeed very fast, at high
temperature, in contrast to the reaction with carbamate, which is controlled by the carbamate thermolyis into primary amine. Special attention has been paid to the experimental conditions required for the development of the particle-in-particle morphology for the dispersed phase. Depending on the mixing sequence and the grafting kinetics (NH2/MA versus carb/MA), this particular phase morphology can be forced or occurs spontaneously.
Keywords: Reactive compatibilization; Polymer blends; SAN 1. Introduction
The fine control of the phase morphology of multiphase polyblends is the key approach to impart desired mechanical properties to these materials [1]. For instance, the rubber particle size plays a major role in the toughening of brittle thermoplastics [2]. It is worth pointing out that a complex polymer blend morphology known as composite dispersed phase morphology is spontaneously formed in some instances. This microscopic phase structure is composed of three parts: two distinct phases with sub-inclusions of one phase within the other one [3]. Until now, the origin and the possible effect of the particle-in-particle phase morphology on polyblends properties have been disregarded, except for the well known high-impact polystyrenes that typically show polystyrene occlusions in the dispersed rubbery phase. This composite dispersed phase morphology should thus receive a much more general attention as a possible strategy to tailor some properties of polyblends. Moreover, in the case of toughened thermoplastics, inclusion of small thermoplastic particles in the dispersed phase is an easy way to increase the volume fraction of the dispersed phase or to decrease the interparticle distance, while keeping the amount of rubber constant. So, at constant rubber content, the toughening properties can be improved by formation of sub-inclusions.
The spontaneous formation of the composite dispersed phase morphology is strongly dependent on the polyblend constituents. For instance, Ban et al. [4] observed a high content of sub-inclusions and a parallel decrease in the diameter of the dispersed rubber phase, when neat poly(ethylene-co-propylene) rubber (EPR) in a nylon matrix was substituted by maleic anhydride grafted EPR. Sundararaj [5] found that occluded particles are predominantly generated in systems in which phase inversion occurs during the melt processing. When the minor phase melts prior to the major phase, very small particles of the major phase are trapped within the minor phase. This phenomenon is more often observed in reactive blends, in which the occluded particles are stabilized against coalescence by graft copolymer formed at the interface. These observations indicate that the sub-inclusions are formed in the early stage of the mixing, before the phase morphology is stabilized [5-6].
The particle-in-particle phase morphology can also be forced when it does not occur spontaneously [3 ; 7]. An efficient strategy consists in dispersing, firstly, part of phase A within phase B, followed by the addition of large amounts of phase A (the final matrix), which triggers phase inversion. The composite dispersed phase
morphology accordingly formed can be stabilized by either control of the viscosity of the dispersed phase or interfacial reaction between the sub-inclusions and the dispersed phase. This strategy actually relies on the behavior of oil–water emulsions, which go through a phase inversion when additional amount of the component of the dispersed phase is slowly added to the emulsion [8-12].
To the best of our knowledge, no study has been carried out until now, which aims at studying how the kinetics of the interfacial reaction in reactive polymer blending influences the particle-in-particle phase morphology, in relation to the mixing sequence, and thus to the spontaneous or forced generation of sub-inclusions. This question is addressed in this paper which deals with reactive processing of poly(styrene-co-acrylonitrile)
(SAN)/EPR blends. For this purpose, ethylene–propylene–diene terpolymer (EPDM) containing 50 wt% reactive maleic anhydride grafted EPR (EP-g-MA) has been melt blended with SAN added with various amounts of co-reactive SAN: SAN-NH2 (highly reactive towards maleic anhydride) and carbamate (precursor of
SAN-NH2 at the processing temperature), while changing the addition order of the blend components. Four mixing
sequences and their influence on the development of a particle-in-particle phase morphology have been considered.
2. Experimental 2.1. Materials
SAN used in this work was the RONFALIN 2770 from DSM containing 26.5 wt% acrylonitrile. The maleic anhydride grafted rubber (EPR-g-MA), EXXELOR VA 1801 from EXXON, contained 0.6 wt% or
6×10⁻³ mol/wt% succinic/maleic anhydride groups. The nonreactive rubber was the EPDM, KELTAN 4778, from DSM. Terpolymerization of styrene (55 mol%), acrylonitrile (43 mol%) and a carbamate-containing comonomer, {1-methyl-1-[3-(1-methylethenyl)-phenyl]ethyl}carbamic acid 1,1-dimethylethyl ester (see Scheme 1; 2 mol%), was initiated by AIBN in toluene at 60°C for 24 h. It was recovered by precipitation in methanol and characterized by NMR and FTIR. The carbamate pendant groups of functional SAN (i.e. SAN-carb) can be derivatized into primary amines (i.e. SAN-NH2) either in solution prior to blending [13] or in situ during the melt
process [14]. In solution, this deprotection was carried out in a dioxane–HCl (12 N) (2:1) mixture at room temperature. Progress of the reaction was followed by the disappearance of the carbamate IR absorption at 1717 cm−1, and completion was observed after 12 h. The copolymer was recovered as SAN-NH2·HCl salt upon
solvent removal. Neutralization of the salt by NaOH released SAN-NH2. The amine functionality was analyzed
by nonaqueous acid–base titration in a toluene–methanol mixture (potentiometric titration) using a standard solution of HClO4. The actual amine (or carbamate) content was 2 mol%, which corresponds to an average
number of 28 groups per SAN chain of 105 g/mol (as determined by SEC analysis on the basis of a PS calibration curve).
Scheme 1.
An alternative way to release primary amines consists of heating the SAN-carb copolymer [14]. Indeed, thermolysis of the carbamate groups is known to yield primary amines with release of carbon dioxide and isobutene ( Scheme 2). The advantage of this reaction was to produce the primary amine in situ, thus during the melt processing. At the usual mixing temperature of 200°C, the rate constant of the carbamate thermolysis was found to be 0.0084 min−1 [23].
Scheme 2.
2.2. Mixing conditions
Samples (20 g) were melt blended with a laboratory two-roll mill at 200°C. A masterbatch of EPDM and EP-g-MA was first prepared by melt blending 50 wt% EPR-g-EP-g-MA and EPDM, respectively, for 7 min under moderate shear (rolls SPEED=15 and 25 rpm, respectively). The EPDM and EPR-g-MA were stabilized with 0.5 wt% of antioxidant, Pentaerythritol tetrakis(3-(3, 5-di-tert-butyl-4-hydroxyphenyl) propianate) (Irganox 1010 form Ciba-Geigy). After mixing at 200°C, the rubber masterbatch was allowed to cool down to room temperature and then pelletized. The mixing process of SAN/EPR reactive blends was conducted in four different ways:
(a) SAN was melt blended with various amounts of reactive SAN (SAN-NH2 or SAN carbamate containing
0.028 mol/wt% reactive groups) for ca. 2 min at 200°C, under moderate shear, followed by the addition of the (EPDM/EP-g-MA 1:1) pre-mixture. The shear was then increased (rolls SPEED=0–1 and 25 rpm, respectively), and the mixing was extended for 7 additional minutes. The SAN/EPR weight composition was systematically 75/25. This first mixing procedure was denoted as in situ compatibilization.
(b) A reactive two-step procedure was based on the previous melt blending of the (EPDM/EP-g-MA 1:1) masterbatch with a mixture of SAN and reactive SAN under the same blending conditions as in method a. The content of reactive SAN in the SAN phase was kept constant (20 wt%), in contrast to the weight composition of the SAN/EPR pre-dispersion that was changed. In a second step, the SAN/EPR pre-mixture was compounded with neat SAN in order to comply with the final SAN/EPR 75/25 weight composition (7 min, 200°C and high shear). The content of SAN-NH2(carb) in the final polyblend was controlled by the weight composition of the
SAN/EPR pre-dispersion.
(c) The third method was different from the second one in that the SAN/EPR weight composition of the pre-dispersion was kept constant, i.e. 20/80, 30/70 or 50/50, in contrast to the content of reactive SAN in the SAN phase that was changed. This pre-dispersion was then diluted with neat SAN. The content of reactive SAN-NH2(carb) in the final blend was thus controlled by the composition of the SAN phase of the pre-dispersion.
(d) The last mixing procedure was a combination of methods a and c. The pre-dispersions prepared in each of these methods were diluted with SAN/SAN-NH2 mixture rather than with neat SAN during the second mixing
step. The amount of SAN-NH2 added in second step was calculated so as to comply with a reactive SAN content
of 33.33 wt% in the final blend.
The mixing procedures and blends compositions are summarized in Table 1 and Table 2. After mixing, the samples were rapidly compression molded into sheets (2 mm thick) at 200°C for 5–7 min using a hydraulic press, and then allowed to cool down to room temperature.
2.3. Charpy impact resistance
The Charpy impact strength was measured at room temperature with a CEAST Fractoscope, using ASTM D256B notched specimens (0.35 mm notch). These samples were machined form the molded sheets and stored for analysis at room temperature.
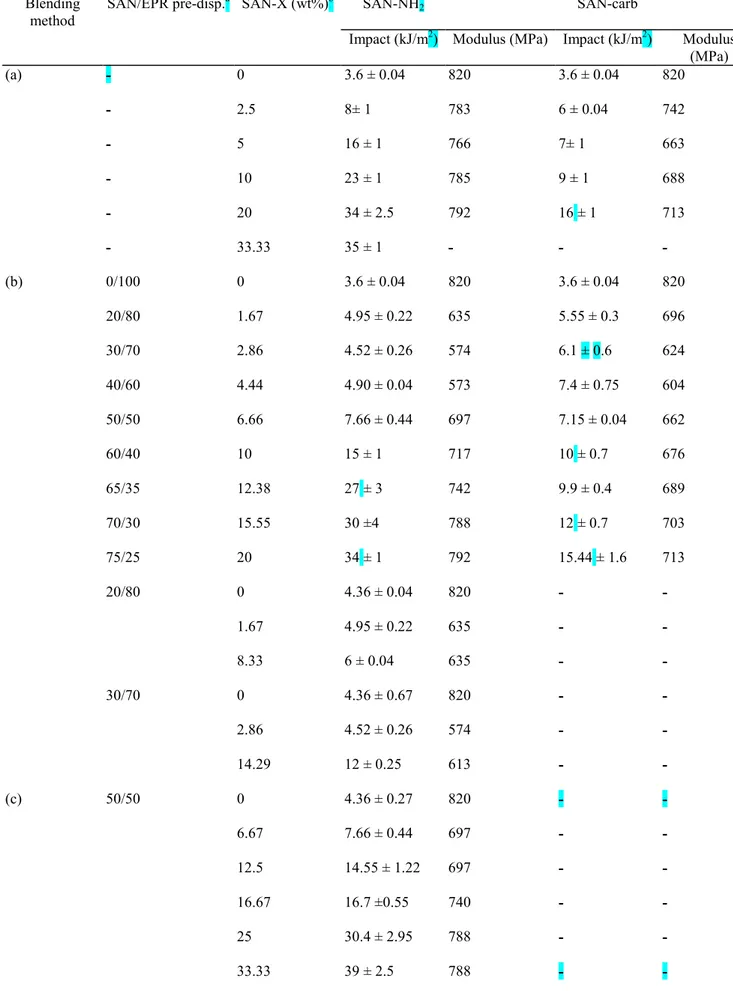
Table 1Effect of blend composition, blending method and reactive SAN groups on Charpy impact strength and elastic modulus (series 2)
Blending method SAN/EPR pre-disp.a SAN-NH2 (wt%) Properties SAN-NH2 (wt% in rubber)b SAN-NH2 (wt% in SAN)c SAN-NH2 (vrt%)d Impact (kJ/m² ) Modulus (Mpa) (c) 20/80 8.33 + 0 = 8.33 6 ± 0.04 644 33/67 16.66 + 0 = 16.66 12 ± 0.8 613 43/57 25 + 0 = 25 32 ± 5 670 (d) 20/80 8.33 + 25 = 33.33 34 ± 2 745 33/67 16.66 + 16.66 = 33.33 38 ± 1.5 705 43/57 25 + 8.33 = 33.33 31 ± 1 745
a Weight composition of the SAN/EPR pre-dispersion, where EPR = (EPDM/EP-g-MA 1:1).
bWt% of reactive SAN (with respect to SAN in the final blend) added to the pre-dispersion (first mixing step). c Wt% of reactive SAN (with respect to SAN in the final blend) added during the second mixing step. 11 Wt% of reactive SAN (with respect
Table 2Effect of blend composition, blending method and reactive SAN groups on Charpy impact strength and elastic modulus (series 1)
Blending method
SAN/EPR pre-disp.a SAN-X (wt%)b SAN-NH2 SAN-carb
Impact (kJ/m2) Modulus (MPa) Impact (kJ/m2) Modulus (MPa) (a) - 0 3.6 ± 0.04 820 3.6 ± 0.04 820 - 2.5 8± 1 783 6 ± 0.04 742 - 5 16 ± 1 766 7± 1 663 - 10 23 ± 1 785 9 ± 1 688 - 20 34 ± 2.5 792 16 ± 1 713 - 33.33 35 ± 1 - - - (b) 0/100 0 3.6 ± 0.04 820 3.6 ± 0.04 820 20/80 1.67 4.95 ± 0.22 635 5.55 ± 0.3 696 30/70 2.86 4.52 ± 0.26 574 6.1 ± 0.6 624 40/60 4.44 4.90 ± 0.04 573 7.4 ± 0.75 604 50/50 6.66 7.66 ± 0.44 697 7.15 ± 0.04 662 60/40 10 15 ± 1 717 10 ± 0.7 676 65/35 12.38 27 ± 3 742 9.9 ± 0.4 689 70/30 15.55 30 ±4 788 12 ± 0.7 703 75/25 20 34 ± 1 792 15.44 ± 1.6 713 20/80 0 4.36 ± 0.04 820 - - 1.67 4.95 ± 0.22 635 - - 8.33 6 ± 0.04 635 - - 30/70 0 4.36 ± 0.67 820 - - 2.86 4.52 ± 0.26 574 - - 14.29 12 ± 0.25 613 - - (c) 50/50 0 4.36 ± 0.27 820 - - 6.67 7.66 ± 0.44 697 - - 12.5 14.55 ± 1.22 697 - - 16.67 16.7 ±0.55 740 - - 25 30.4 ± 2.95 788 - - 33.33 39 ± 2.5 788 - -
a Weight composition of the SAN/EPR pre-dispersion, where EPR = (EPDM/EP-g-MA 1:1). Wt% of reactive SAN in the final blend, with
respect to the SAN phase.
2.4. Transmission electron microscopy (TEM)
Observations were carried out with the transmission electron microscope PHILIPS M100 at an accelerating voltage of 100 kV. Thin sections (90 nm) were prepared by ultramicrotomy (ULTRACUT E from REICHERT-JUNG) at −130°C and stained by exposure to RuO4 vapors for ca. 2 h. SAN was observed as darker phases as
result of a higher affinity for ruthenium tetraoxide compared to EPR. Micrographs were analyzed by using the KS 100 (Kontron Imaging System) software. An average number of 300 particles were considered per sample. The cross-sectional surface area of these particles was converted to an equivalent diameter by Eq. (1):
dequivalent=((4 area)/π)0.5 (1)
2.5. Storage modulus
The shear storage moduli, E, at 25°C were measured by dynamical mechanical spectroscopy at 1 Hz with an equipment provided from Dupont.
2.6. Application of the Kerner model to the multiphase blend morphology
The multiphase morphology of the blends was treated by the two-step application of the Kerner equation to the two-phase dispersed rubber particles [15]. This approach was successfully used by Luzinov et al. [16-17] in order to predict the elastic modulus of ternary blends consisting of PS matrix, SBR dispersed phase and inclusions of polyolefin within the SBR domains.
Several theories were proposed to predict the modulus of composites, which are usually valid to binary systems consisting of dispersion of one component in the matrix of the second one. Kerner proposed a theory for spherical dispersed phases [18-22]. In case of ideal stress transfer across the boundary, the elastic properties are derived by averaging the properties of the individual components, leading to Eq. (2) for the shear storage modulus:
where E is the shear storage modulus of the polyblend, is the volume fraction and ν is the Poisson ratio. Subscript 1 refers to the matrix and 2 refers to the dispersed phase.
When no stress is transferred or when the matrix is much more rigid than the dispersed phase, the Kerner equation is simplified by assuming that E2 is negligible:
The inclusion of small particles (of the same chemical nature as the matrix) within the dispersed phase tends to increase the apparent volume fraction of this phase. Assuming that the SAN matrix is much more rigid than the dispersed phase, Eq. (3) predicts that the increase of the dispersed phase volume fraction results in lower elastic modulus. Conversely, the experimental value of E can provide information on the volume fraction of the dispersed rubber phase and thus on the amount of occluded SAN.
3. Results and discussion 3.1. Phase morphology
In this study, special attention has been paid to the development of composite multiphase morphology in reactive SAN/EPR polyblends in relation to the mixing sequence and the kinetics of the interfacial reaction. This phase morphology, which consists of a SAN matrix and SAN sub-inclusions within the dispersed EPR phase, has been first characterized in terms of the number average diameter of the dispersed rubber particles (Dn). Fig. 1 shows
the dependence of Dn estimated by image analysis of the TEM micrographs on the content of reactive SAN in
the SAN phase and the addition order of the polymers.
Fig. 1. Dependence of the number average diameter of rubber particles on the SAN-X wt% for polyblends prepared according to either the in situ compatibilization (method a) or the reactive two-step process (method b) and modified by either SAN-NH2 or SAN-carb.
When the polyblends are prepared by the in situ compatibilization (method a), Dn decreases continuously upon
addition of SAN-X, but much more rapidly in case of SAN-NH2 than SAN-carb (Fig. 1; method a). In these
experiments, the two reactive polymers, i.e. EPR-g-MA and SAN-X (X being either carbamate or primary amine), were intimately mixed within the host polymer before reaction, which is favorable to the formation of the graft copolymer at the interface. The experimental emulsification curves which compare the capability of SAN-X to participate to the interfacial reaction, confirm the superiority of SAN-NH2. The higher Dn observed in
case of SAN-carb results not only from a less efficient grafting reaction at the interface, but also from SAN sub-inclusions formed in the EPR phase.
Fig. 2 is a typical illustration of the difference observed in the phase morphology when SAN-carb is used rather than SAN-NH2, all the other conditions being the same. Since the solid rubber pellets have been added into the
melted SAN major phase in order to avoid phase inversion and thus formation of SAN sub-inclusions in the rubber, the observation must result from the coalescence of poorly stabilized rubber particles [23]. Indeed, when the compatibilization reaction is slow compared to the phase dispersion, the SAN-g-EP copolymer is not formed in sufficient amounts to stabilize the interface and to inhibit the EPR particles coalescence. Then, SAN can be trapped within these rubber particles on the occasion of coalescence and be ultimately stabilized by the slowly progressing interfacial reaction. This mechanism is consistent with the increasing formation of sub-inclusions with mixing time, as shown elsewhere [23]. Thus the sub-inclusions should be formed not during melting and softening of the blend components [6-7] but rather in the later stage of mixing (when coalescence predominates). Would this speculation be correct, the amount of occluded SAN should decrease as the compatibilization efficiency is increased, thus at a higher interfacial reaction rate. Consistently, the amount of occluded SAN decreases when the more reactive SAN-NH2 is used rather than SAN-carb, as confirmed by Figs. 2a and b.
Fig. 2. Transmission electron micrographs of polyblends prepared according to the in situ compatibilization (method a) and containing 20 wt% of either: (a) SAN-NH2; or (b) SAN-carb. Effect of the type of reactive SAN
on the formation of SAN sub-inclusions.
In contrast to the mixing method (a), when a reactive SAN/EPR pre-dispersion is used (method b), the dependence of Dn on the content of reactive SAN goes through a maximum (Fig. 1; method b). In the mixing
method (b), the SAN-NH2(carb)/EP-g-MA ratio in the pre-dispersion is the same as in the in situ
compatibilization, the difference being in the higher content of reactive SAN in the SAN phase. This is the reason why neat SAN is added during the second mixing step, and the final blend composition is the same whatever the method (a and b) used. It must be noted that the mixing time is two times longer (2×7 min) in method b than in method a (7 min) resulting in more complete formation of SAN-g-EPR copolymer at the interface. It may also be anticipated that the dispersion of the pre-blend in neat SAN (during the second step) will affect the final phase morphology. In this respect, Dn of the dispersed particles has been plotted in Fig. 3
versus the SAN (including SAN-X) content of the pre-dispersion, not only in this pre-blend but also in the final polyblend.
The two types of reactive SAN show a deep change in phase morphology, in the range of 40–50 wt% SAN in the pre-dispersion, which is the signature of the phase inversion. Till up to 40 wt% SAN in the pre-dispersion, the SAN phase is dispersed in the EPR matrix (Fig. 3). Upon addition of neat SAN so as to reach 75 wt% in the final blend, the phase inversion must occur, which is however far from being complete as supported by very large Dn and TEM micrographs shown in Fig. 4a and b and e and f. The progress of the interfacial reaction
between SAN-NH2 and EPR-g-MA is expected to stabilize the SAN occlusions in the rubber domains, which are
very poorly dispersed (large and highly deformed domains) because part of the graft copolymer is not available at the SAN matrix/EPR interface being localized at the SAN occlusion/EPR interface. Consistently, up to 4.44 wt% SAN-NH2 in the final blend (with respect to the SAN phase), thus 40 wt% of SAN in the
pre-dispersion, the diameter of the rubber particles and their content of SAN sub-inclusions are much higher than in the parent polyblends prepared by in situ compatibilization (Fig. 1, comparison of method (a) and (b) for SAN-NH2 modified blends). All these observations suggest that SAN dispersed in the pre-blend contributes essentially
to sub-inclusions in the final blend, which explains that the final dispersed rubber domains are much larger in method b compared to method a (Fig. 1).
Fig. 3. Dependence of the number average diameter, Dn, of the dispersed rubber particles in the final blends
(method b) on the SAN (including SAN-X) wt% of SAN/EPR pre-dispersion (filled symbol) together with Dn of
either SAN (in EPR matrix) or EPR (in SAN matrix) in the pre-dispersion (opened symbol). The dashed region indicates the phase inversion composition; (a) and (b) refer to SAN-NH2 and SAN-carb modified blends,
Fig. 4. Transmission electron micrographs of polyblends prepared according to a reactive two-step process (method b) and containing: (a) 2.86; (b) 6.66; (c) 10; and (d) 12.38 wt% SAN-NH2 and (e) 2.86; (f) 6.66; (g) 10;
and (h) 12.38 wt% SAN-carb.
When the SAN content of the pre-dispersion is higher than 50 wt%, the phase inversion has occurred, and the SAN phase is continuous (Fig. 3). Conversely, the rubber is dispersed, and this dispersion becomes finer as the SAN content is increased and it is stabilized by the interfacial reaction between SAN-NH2 and EPR-g-MA. The
rubber particle size in the final blends is close to the size in the pre-dispersion, indicating that SAN added during the second blending step just contributes to swell the SAN matrix of the pre-dispersion. Therefore, beyond
6.66 wt% of SAN-NH2 in the final blend (i.e. the 50/50 wt%/wt% SAN/EPR pre-dispersion), the average
diameter of the rubber droplets decreases sharply until meeting the emulsification curve reported for the in situ compatibilization (Fig. 1, comparison of method (a) and (b) for SAN-NH2 modified blends). Fig. 4c and d shows
a parallel decrease in the dispersed particle size and the amount of sub-inclusions. This observation suggests that most graft copolymer is now available at the surface of the rubber particles, rather than at the rubber/sub-inclusions interface.
In the case of SAN-carb which is responsible for a slower interfacial reaction, method b leads to final blends with finer rubber dispersion (Fig. 1) and smaller SAN retention in the EPR phase ( Fig. 4e and f) up to 4.44 wt% of SAN in these blends (and thus phase inversion composition for the pre-dispersion). This observation indicates that the comparatively slower interfacial reaction when SAN-carb is used rather than SAN-NH2 results in the
delayed immobilization of the SAN sub-inclusions in EPR and consequently in less important retention of SAN. Beyond the phase inversion composition of the pre-dispersion (SAN-carb content higher than 6.66 wt% in the final blends), the lower reactive SAN-carb leads to coarser rubber dispersion (Fig. 3) and a higher content of sub-inclusions ( Fig. 4g and h versus c and d) compared to SAN-NH2. Beyond the phase inversion of the
pre-dispersion, the SAN-g-EP graft copolymer is expected to be mostly localized at the proper interface, i.e. between the SAN matrix and EPR. The more rapid interfacial reaction of SAN-NH2 compared to SAN-carb allows finer
rubber dispersion to be stabilized in the pre-dispersion. The less efficient stabilization by SAN-carb accounts for particles coalescence and SAN sub-inclusions formation during the first 7 min of mixing. Once again, dilution of the pre-dispersion by neat SAN does not change the rubber particle size indicating that the rubber dispersion is stable enough at the end of the premixing step (Fig. 3b).
As a rule, the lower reactivity of carbamate towards maleic anhydride modulates the effect of the mixing methods (a and b) on the phase morphology (Fig. 1).
3.2. Charpy impact resistance
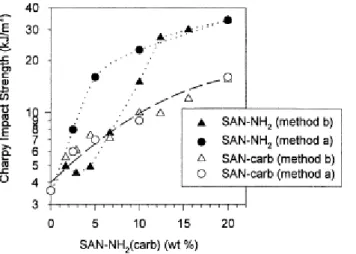
Fig. 5 shows that the impact resistance is rapidly improved as the content of SAN-NH2 is increased in blends
processed by the mixing method a. Charpy impact strength of 34 kJ/m2 is reached for 20 wt% of SAN-NH2. In
sharp contrast, when blending method b is used, the impact strength does not change significantly until reactive SAN content of 4.44 wt%, i.e. until the pre-dispersion contains 40 wt% SAN. Beyond this composition, a sharp increase in the impact resistance is firstly observed, which seems, however, to level off as the reactive SAN content is further increased (>10 wt%).
Fig. 5. Dependence of the Charpy impact resistance on the SAN-X wt% for polyblends prepared according to either the in situ compatibilization (method a) or the reactive two-step process (method b) and modified by either SAN-NH2 or SAN-carb.
This observation highlights the importance of the wt composition of the SAN/EPR pre-dispersion in the control of the impact properties. Beyond 10 wt% SAN-NH2 (thus a SAN/EPR pre-dispersion of 60/40 wt%/wt%), the
SAN phase of the pre-dispersion tends to be continuous, so that the SAN/EPR interface will not be much perturbed during the second mixing step and the experimental impact resistance is no longer dependent on the mixing methods a and b.
The slowly reactive SAN-carb is basically less efficient than SAN-NH2 in promoting the SAN toughness. For
instance, the highest impact strength observed for 20 wt% SAN-carb (i.e. 16 kJ/m2) is much smaller than the "plateau value" noted when SAN-NH2 is substituted for SAN-carb (i.e. 34 kJ/m2). Therefore it is not surprising
that the blending procedure has a comparatively less pronounced effect on the SAN toughening in the case of SAN-carb-containing polyblends. A unique relationship is then observed between the impact strength and the SAN-carb content for the two mixing sequences a and b.
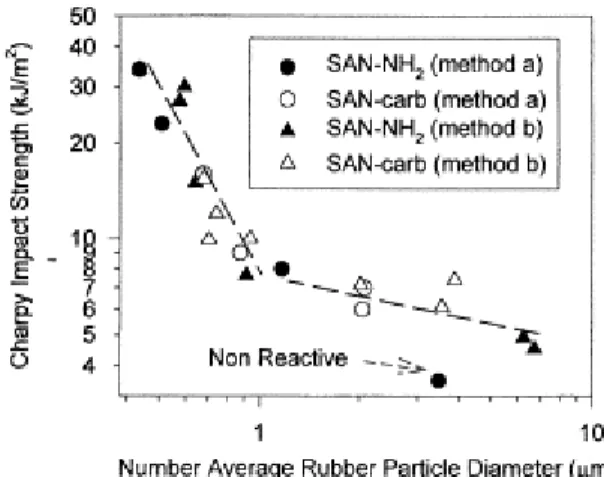
3.3. Impact strength–morphology relationship
The control of the phase morphology is one of the key factors able to provide polyblends with the desired mechanical properties. It is usually accepted that the rubber particle size has to be optimized for imparting the best toughness to a brittle matrix. The explanation has to be found in the crazing characteristic of brittle matrices, which is most efficiently stopped by small rubber particles, thus by a larger number of termination sites per unit volume at constant composition [24-26]. Notched Charpy impact strengths for the four series of blends are plotted in Fig. 6 against the number average rubber particle diameter. Clearly, the refinement of the rubber dispersion contributes to improve the SAN toughness. Moreover, below 0.9 µm, further decreasing in the rubber particle diameter (down to 0.45 µm thus in the range of the optimum size for SAN toughening [24-26]), the increase in impact strength is spectacular whatever the way this particle size has been reached (SAN-NH2 or
SAN-carb, mixing method a and b).
Fig. 6. Charpy impact resistance versus number average rubber particle diameter for polyblends prepared according to either the in situ compatibilization (method a) or the reactive two-step process (method b), and modified by either SAN-NH2 or SAN-carb.
3.4. Shear storage modulus
The shear storage modulus, E, has been measured at room temperature by dynamic mechanical spectroscopy. Experimental values of E for the four series of blends are reported in Fig. 7 versus the content of reactive SAN in the final blends. The elastic behavior of these reactive polyblends appears to be strongly dependent on both the mixing method, i.e. the use of a SAN/EPR pre-dispersion, and the type of reactive groups attached onto SAN, i.e. the interfacial grafting kinetics.
The mixing method b results in a sharp decrease of the elastic modulus when the reactive SAN-NH2 content is
increased up to 4.44 wt%, beyond which content the modulus increases although as slowly as the reactive SAN content is larger. Beyond this critical reactive SAN-NH2 (which corresponds to the phase inversion of the
pre-mixture, Fig. 3), the impact resistance and the rubber dispersion were also observed to be improved ( Fig. 1 and Fig. 5). In the case of in situ compatibilization, the general shape of the curves observed with method b is maintained, although the effect of the reactive SAN content on the modulus is much less pronounced, particularly for SAN-NH2. This observation will be explained later in the discussion.
The influence of the mixing method vanishes when the content of reactive SAN is high enough (>15 wt%). The modulus which is then measured is however higher by ca. 100 MPa in case of SAN-NH2 compared to SAN-carb.
Fig. 7. Dependence of the shear storage modulus on the SAN-X wt% for polyblends prepared according to either the in situ compatibilization (method a) or the reactive two-step process (method b), and modified by either SAN-NH2 or SAN-carb.
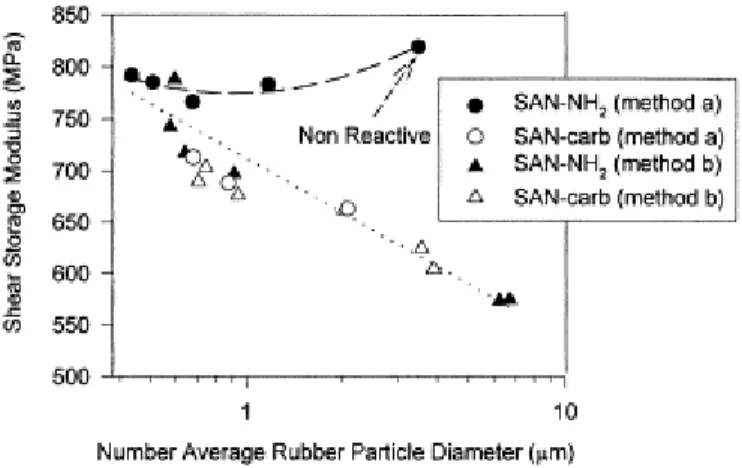
In order to understand better the strong dependence of the shear storage modulus on the content of the compatibilizer precursors, the shear storage modulus has been plotted in Fig. 8 versus the number average diameter of rubber particles for the four series of blends. Although a unique relationship was observed when the impact strength was similarly analyzed (Fig. 6), the modulus is dependent on the rubber particle size, in a way that changes with the mixing sequence and the type of reactive SAN.
Fig. 8. Shear storage modulus versus number average rubber particle diameter for polyblends prepared according to either the in situ compatibilization (method a) or the reactive two-step process (method b), and modified by either SAN-NH2 or SAN-carb.
Whatever the SAN reactive groups, E regularly decreases when Dn is increased in method b. Conversely, in the
case of polyblends prepared by method a, the intrinsic reactivity of SAN (amine or carbamate) is of prime importance. When SAN-carb is concerned, the same behavior as in method b is observed, in contrast to what happens with SAN-NH2, since E is then essentially independent of the rubber particle size. This discrepancy
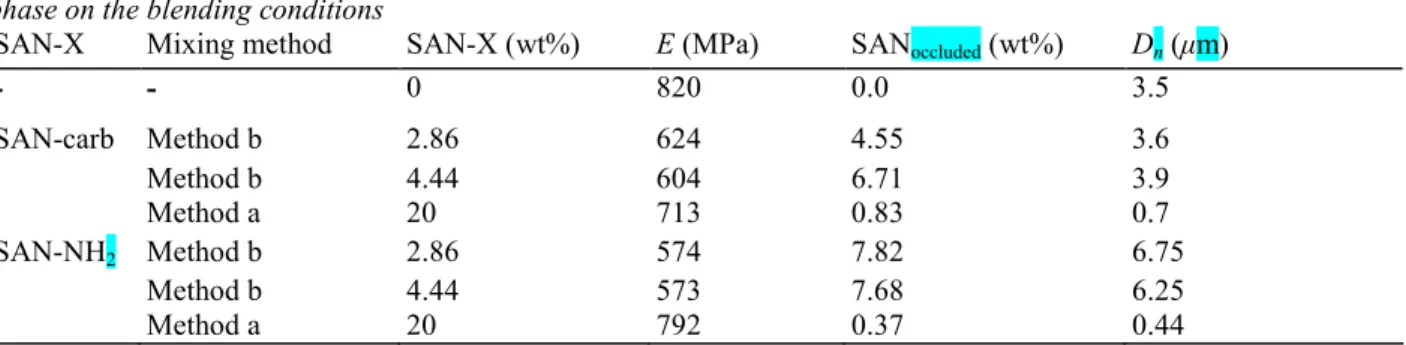
suggests that the stiffness of the polyblends is not governed exclusively by the rubber dispersion. From the comparison of the rubber particle diameter, the shear storage modulus and the wt% of SAN occluded in the EPR phase (as determined by image analysis, [23]) in Table 3, it appears that E is inversely proportional to the wt% of occluded SAN at constant particle size. Indeed, for particle size of ca. 3.5 µm (Table 3), E decreases from 820 to 604 MPa when the sub-inclusion content increases from 0 to 6.71%. Actually, the apparent volume fraction of the dispersed rubber phase, 2, is increased upon inclusion of very small particles of the same chemical nature as
the matrix. According to the Kerner equations ((2) and (3), see Section 2.6), the elastic modulus has to decrease as 2 is higher. Thus, the shear storage modulus of the SAN/EPR reactive blends is controlled by the SAN
sub-inclusions in the EPR phase, rather than by the average size of this phase. Nevertheless, more than often, a high SAN sub-inclusions concentration within the rubber droplets can be observed in parallel to the increase of EPR particle size, such that an apparent relationship between E and Dn can be drawn (Fig. 8).
Table 3
Dependence of shear storage modulus (E), wt% of occluded SAN and average diameter of the EPR phase on the blending conditions
SAN-X Mixing method SAN-X (wt%) E (MPa) SANoccluded (wt%) Dn (µm)
- - 0 820 0.0 3.5 SAN-carb Method b 2.86 624 4.55 3.6 Method b 4.44 604 6.71 3.9 Method a 20 713 0.83 0.7 SAN-NH2 Method b 2.86 574 7.82 6.75 Method b 4.44 573 7.68 6.25 Method a 20 792 0.37 0.44
Conversely, information on the volume fraction of the dispersed domains and, thus on the fraction of occluded SAN could be extracted from the shear storage modulus.
In order to know how the elastic modulus of the polyblends depends on the fraction of SAN occluded in the rubber phase, experimental values of E for blends reported in Table 3 have been plotted as a function of their wt% of occluded SAN (as determined by image analysis) ( Fig. 9). In parallel, the Kerner model (see Section 2.6) has been applied to these two-phase dispersed-phase-containing blends ( Table 3). Firstly, the modulus of the dispersed rubber particles containing well-defined amounts of SAN sub-inclusions has been calculated, assuming a strong interfacial adhesion (interfacial reaction) between these sub-inclusions and the rubber. Eq. (2) was used on the assumption that the stress distribution is uniform in the EPR and the SAN dispersed phases. Constituent 1 of Eq. (2) is EPR and the Poisson ratio is 0.49. In a second step, the modulus of the final blend has been calculated from the modulus calculated for the composite rubber particles (component 2) and the stiffness of the continuous SAN phase (component 1, Poisson ratio of 0.35). For the sake of completeness, the two Kerner models ( (2) and (3)) have been used and compared. In the two cases, the calculated Es of the final blend are very similar, as illustrated by the single straight line in Fig. 9, but they decrease rapidly when the weight fraction of SAN sub-inclusions is increased.
Fig. 9. Shear storage modulus, E, versus wt% of SAN occluded within the EPR phase (Table 3) and comparison with theoretical values of E predicted by the two-step application of the Kerner model (straight line; see (2) and (3)).
Then, the amount of SAN immobilized within the EPR phase has been estimated from the shear storage modulus of the four series of blends and the dependence shown in Fig. 9 ( Fig. 10). Before phase inversion occurs in the pre-dispersion, thus up to 4–6 wt% of SAN-X in the final blend, the pre-dispersed SAN (whose the fate is formation of sub-inclusions in the final blend) is more efficiently immobilized in case of SAN-NH2 compared to
SAN-carb, consistent with the higher reactivity of the former. Beyond the phase inversion, the situation is reversed such that fewer sub-inclusions are observed in the case of SAN bearing primary amine. Then, the topology of the dispersed composite phase (in the final blend) is reminiscent of the morphology of the SAN/EPR pre-dispersion, which is stable enough to resist perturbations when SAN is added during the second mixing step.
Fig. 10. Theoretical dependence of the wt% of occluded SAN (2) and (3)) on the SAN-X wt% for polyblends prepared according to either the in situ compatibilization (method a) or the reactive two-step process (method b) and modified by either SAN-NH2 or SAN-carb.
3.5. SAN retention
SAN has been extracted from polyblends by acetone which is its selective solvent. The amount of unextracted SAN has been quantified by FTIR analysis of the insoluble material and reference to a calibration curve [23]. This amount includes the fraction of SAN occluded within the dispersed rubber and SAN grafted at the interface between the matrix and the dispersed rubber phase, as expressed by Eq. (4):
[SAN]unextracted=[SAN/SAN-X]occluded+[SAN-X]grafted (4)
The percentage of SAN retention has been plotted in Fig. 11 versus the reactive SAN content for polyblends prepared by method b. The percentage of retention is defined as the wt% of SAN (including reactive SAN) in the pre-dispersion which cannot be extracted in the final blend [3]. This percentage has to be related to the amount of pre-dispersed SAN which does not undergo phase inversion upon addition of SAN in the final blend and/or which is chemically grafted to the EPR phase. Before phase inversion occurs in the pre-dispersion, i.e. up to 4– 6 wt% SAN-X in the final blend, the SAN retention is higher than the weight content of reactive SAN (20 wt%) in the SAN phase. This indicates that a significant amount of neat SAN cannot be extracted by acetone, being occluded within the EPR phase.
However, the percentage of retention is much higher in the case of SAN-NH2 than SAN-carb. For instance,
88 wt% SAN retention is observed for polyblend containing 1.67 wt% SAN-NH2 (thus 20/80 wt%/wt%
SAN/EPR pre-dispersion) compared to 39 wt% in case of SAN-carb. Clearly, the more reactive and thus more rapidly reacting SAN-NH2 is more efficient than SAN-carb in stabilizing the composite phase morphology of
EPR. Beyond 6.66 wt% reactive SAN, the SAN retention falls down below the weight fraction of reactive SAN indicating that most neat SAN has been extracted. Indeed, the fraction of reactive SAN retained after phase inversion is expected to be partitioned between chains grafted at the SAN matrix/EPR interface and sub-inclusions in the EPR phase. Moreover, Fig. 11 shows that SAN retention becomes independent of the reactive SAN groups, as the content of reactive SAN is increased. Since SAN-NH2 provides finer rubber dispersion,
fewer sub-inclusions and higher impact strength compared to SAN-carb, it appears that SAN-NH2 is mostly
grafted at the interface, although SAN-carb mainly serves to stabilize the SAN sub-inclusions. So, when the interfacial reaction is faster (SAN-NH2 versus SAN-carb), this reaction preferably stabilizes the matrix/dispersed
Fig. 11. SAN retention versus the SAN-X wt% for polyblends prepared according to the reactive two-step process (method b) and modified by either SAN-NH2 or SAN-carb.
3.6. Interfacial activity of bound SAN
Fig. 12 shows the partition of the unextracted SAN between chains grafted at the matrix/EPR interface and sub-inclusions in the rubber phase.
The wt% of occluded SAN has been extracted from the shear storage modulus (Fig. 10), and the fraction of SAN grafted at the interface has been estimated from Eq. (4). Where method (b) and SAN-NH2 are concerned (Fig.
12a), and the wt% of reactive SAN in the final blend does not exceed 4–6 wt% (i.e. up to the phase inversion region in the pre-dispersion), the very small amount of SAN grafted at the interface suggests that reaction of SAN-NH2 mainly contributes to stabilize the SAN sub-inclusions. Beyond the phase inversion, the amount of
SAN-NH2 grafted at the matrix/rubber interface increases dramatically at the expense of the sub-inclusions
stabilization. Then the main role of SAN-NH2 is to emulsify the rubber dispersion and to improve the SAN/EPR
interfacial adhesion. These results are in line with the sharp improvement in both the rubber dispersion and the SAN toughness observed beyond 4–6 wt% SAN-NH2. The lower reactivity of SAN-carb towards maleic
anhydride, and thus the slower interfacial reaction, explains that the SAN sub-inclusions are less efficiently stabilized before the phase inversion and that the interfacial reaction predominates at the EPR/SAN occlusion interface beyond the phase inversion (Fig. 12b).
The in situ compatibilization leads to a decrease of the total amount of unextracted SAN. In case of primary amine (Fig. 12c), SAN is mainly localized at the matrix/EPR interface, in sharp contrast to what happens when SAN-carb is used ( Fig. 12d). These results are in line with the differences observed for the two types of reactive SAN in phase morphology and impact strength.
As expected, both the impact resistance (Fig. 13a) and the rubber dispersion (Fig. 13b) are improved when the wt% of SAN grafted at the SAN matrix/EPR interface is increased. More SAN-g-EPR compatibilizer is then available at the proper interface. It is worth noting that at constant amount of grafted SAN, the in situ
compatibilization results in higher impact strength and higher specific interfacial surface area compared to the mixing method b which requires a step of pre-dispersion. Difference in the reaction time (7 min for method a versus 14 min for method b) can at least partly account for this observation.
All the above observations demonstrate that the interface between the SAN matrix and the dispersed rubber component must be stabilized by SAN-g-EP copolymer in order to impart high performances to the reactive blends. Increasing amount of reactive SAN-X increases the probability of copolymer formation at the interface, whereas the preferential localization of the compatibilizer at one of the EPR/SAN matrix or EPR/SAN
sub-inclusions interfaces strongly depends on both the rate of the interfacial reaction and the wt composition of the SAN/EPR pre-dispersion (in method b) (see Scheme 3; loci of formation of the SAN-g-EPR copolymer. The SAN-g-EPR can be localized at two interfaces: (1) the EPR/SAN matrix interface; and (2) the EPR/SAN sub-inclusions interface. The grafting at interface (2) stabilizes the sub-sub-inclusions, which results in smaller elastic modulus E. The grafting at interface (1) is favorable to the dispersion of the rubber particles and to their adhesion to the matrix at the expense of the sub-inclusions stabilization).
Fig. 12. Partition of unextracted SAN between sub-inclusions in the EPR domains and SAN grafted at the EPR/SAN matrix interface; (a) and (b) refer to polyblends prepared according to the reactive two-step process (method b) and modified by SAN-NH2 and SAN-carb, respectively; (c) and (d) refer to polyblends prepared
Fig. 13. (a) Charpy impact strength; and (b) specific interfacial area, Ssp, versus the wt% of SAN grafted at the
EPR/SAN matrix interface for polyblends prepared according to either the in situ compatibilization (method a) or the reactive two-step process (method b) and modified by either SAN-NH2 or SAN-carb.
Scheme 3.
The effect of reactive SAN content and pre-dispersion composition is illustrated in Fig. 14. At constant SAN content in the pre-dispersion, i.e. 20, 30 and 50 wt%, the amount of SAN-NH2 has been varied (method c, see
Table 2). The sharp increase in both the impact strength and the elastic modulus observed in the vicinity of 50 wt% SAN in the pre-dispersion at constant SAN-X is associated to phase inversion. Before the phase inversion, increasing amounts of SAN-NH2 in method c mostly result in improved stability of the originally
dispersed SAN and, as result, in decreasing modulus. Beyond the phase inversion, the increase in both the impact strength (see also Fig. 15) and the elastic modulus with the amount of SAN-NH2 is the signature of the beneficial
effect of grafting at the EPR/SAN matrix interface rather than at the EPR/SAN sub-inclusions interface.
Fig. 14. Double dependence of both: (a) Charpy impact strength; and (b) the shear storage modulus on the SAN-NH2 wt% and the SAN (including SAN-NH2) wt% of SAN/EPR pre-dispersion for polyblends modified by
Fig. 15. Initial slope (IS) of the dependence of the impact strength on the SAN-NH2 content in the final blend for
various compositions (i.e. SAN wt%) of the SAN/EPR pre-dispersion. 3.7. Progress in SAN toughening
Sub-inclusions of SAN in the EPR phase increases the volume fraction of the dispersed phase, so that less rubber would be required to reach the desired volume fraction of dispersed phase. Nevertheless, a high sub-inclusions concentration is generally found at the expense of the stabilization of the SAN matrix/EPR interface. As result, the stress transfer is not effective across this interface and no improvement in SAN toughness is observed. This suggests that it could be interesting to compatibilize the SAN matrix/EPR interface, while keeping a high amount of occluded SAN. For this purpose, a fourth mixing method (method d, see Table 1, Section 2) has been used, which is a combination of methods a and c. SAN/EPR pre-dispersions have been dispersed in a pre-mixture of SAN and SAN-NH2 rather than in virgin SAN (method c). The content of SAN-NH2 in the SAN phase is such
that the total SAN-NH2 content is 33.33 wt%.
At constant composition of the SAN/EPR pre-dispersion, a sharp improvement in both the impact strength and the shear storage modulus is observed when additional SAN-NH2 is added to the SAN phase (method d, see
Table 1) compared to the case where the whole reactive SAN is added to the rubber phase (method c, see Table 1). The explanation is that the SAN-NH2 added to the SAN phase during the second mixing step reacts with
EPR-g-MA at the SAN matrix/EPR interface which destabilizes the original particle-in-particle morphology of the EPR phase. As result, a fraction of the SAN initially trapped as sub-inclusions within the rubber is released, the amount of occluded SAN decreases and the elastic modulus increases. In parallel, the proper interface of SAN matrix and EPR dispersed phase is compatibilized, such that the stress transfer across this interface and the impact performances are improved.
4. Conclusions
This work has discussed a strategy able to generate composite multiphase morphology and has clearly shown the strong dependence of mechanical properties on phase morphology. Formation of sub-inclusions within the dispersed rubber phase basically results from coalescence of dispersed rubber phases and local phase inversion. These phenomena occur spontaneously whenever the SAN/SAN-X matrix is melted first. The SAN occluded particles are then stabilized by the (delayed) interfacial reaction. As a rule, higher grafting rate has a depressive effect on the phase coalescence and thus on the formation of sub-inclusions (Scheme 3; method a). As an alternative, this sub-structure can be forced by pre-blending a small part of SAN (including reactive SAN) with the rubber phase. Dilution of the SAN/rubber pre-dispersion by the rest of SAN can trigger phase inversion of the originally dispersed SAN. In contrast to the previous technique, faster reaction is favorable to the retention of occluded SAN, since it prevents, more efficiently, the phase inversion of predispersed SAN and coalescence with the matrix ( Scheme 3; method b).
These observations emphasize the importance of the rate at which the interfacial reaction occurs with respect to the coalescence rate which governs phase inversion. The grafting rate affects not only the amount of the
compatibilizer formed in situ but also its localization with direct consequence on the size and the morphology of the dispersed phase, i.e. composite morphology or not. It is essential to note that these kinetic effects can be modulated by changing the mixing sequence (or at least the order of addition) of blend components. The experimental data collected in this work indicate that the melting rate of the reactive polymers, mixed in one step, can have a strong effect on the development of the phase morphology and must be taken into account whenever the scaling up of the process is considered.
Acknowledgements
The authors are very much indebted to DSM for financial support and a fellowship to one of them (C.P.). They are grateful to the "Services Fédéraux des Affaires Scientifiques, Techniques et Culturelles" for general support to CERM in the frame of the "PAI-4: Chimie Supramoléculaire et Catalyse Supramoléculaire" and to Mrs M. Dejeneffe for ultramicrotoming and technical assistance.
References
[1] Van Duin M, Koning CE, Pagnoulle C, Jerome R. Prog Polym Sci 1998;23:707. [2] Wu S. Polym Eng Sci 1990;30(13):753.
[3] Favis BD, Lavallee C, Deredouri A. J Mater Sci 1992;27:4211.
[4] Ban LL, Doyle MJ, Disko MM, Smith GR. Polym Commun 1988;29:163. [5] Sundararaj U. PhD thesis, University of Minnesota, 1994.
[6] Maréchal Ph. PhD thesis, Université Catholique de Louvain, Belgium, 1993.
[7] Yamaguchi N, Chikanari T. Soc Plast Ind/Soc Plast Eng Conf Preprints, Las Vegas, 1990, p. 165.
[8] Salager JL. In: Becher P, editor. Encyclopedia of emulsion technology, vol. 3. New York: Marcel Dekker, 1988 (Chap. 2). [9] Smith DH, Nwosu SN, Johnson GK, Lim KH. Langmuir 1992; 8:1076.
[10] Smith DH, Lee KH. J Phys Chem 1990;94:3746. [11] Lee KH, Smith DH. J Colloid Interface Sci 1991;142:278. [12] Dickinson K. J Colloid Interface Sci 1981;84:284.
[13] Pagnoulle C, Koning CE, Leemans L, Jerome R. 1997. Dutch Application No. 1007074. [14] England WP, Stoddard GJ, Scobbo JJ. 1994. US Patent No. 5310795.
[15] Rôsch J. J Polym Eng Sci 1995;35:1917.
[16] Luzinov I, Xi K, Pagnoulle C, Huynh-Ba G, Jerome R. Polymer 1999;40:2511. [17] Luzinov I, Pagnoulle C, Jerome R. Polymer 2000;41:3381.
[18] Kerner EH. Proc Phys Soc 1956;69B:808.
[19] Hashin Z, Shtrikman S. J Mech Phys Solids 1963;11:127. [20] Uemura S, Takayanagi M. J Appl Polym Sci 1966;10:113. [21] Kraus G, Rollman KW. Adv Chem Ser 1971:99. [22] Leclair A, Favis BD. Polymer 1996;37:4723.
[23] Pagnoulle C, Koning CE, Leemans L, Jérôme R. Macromolecules 2000;33:6275 [24] Bragaw CG. Adv Chem Ser 1971;99:86.
[25] Kambour RP. J Polym Sci 1966;4:17. [26] Wu S. Polym Engng Sci 1990;30(13):753.