What are the best upland river characteristics for glass eel
restocking practice?
Billy Nzau Matondo
a,⁎
,
Jean-Philippe Benitez
a,
Arnaud Dierckx
a,
Séverine Renardy
a,
Xavier Rollin
b,
Dylan Colson
a, Loïc Baltus
a, Vasthi Rose Myrielle Romain
a, Michaël Ovidio
aa
Laboratory of Fish Demography and Hydroecology, Management of Aquatic Resources and Aquaculture Unit, Freshwater and Oceanic science Unit of Research-FOCUS, University of Liège, 22 Quai E. Van Beneden, B-4020 Liège, Belgium
b
SPWARNE-DNF-Public Service of Wallonia - Agriculture, Natural Ressources & Environnement, Wildlife & Forestry Department, 15 Avenue Prince de Liège, B-5100 Jambes, Belgium
H I G H L I G H T S
• Eel stocks decline in upland rivers. • Glass eel restocking tested in diverse
river typologies.
• Optimal abiotic and biotic factors identi-fied to increase eel yields.
• Endangered species conservation through good habitat/river choice.
G R A P H I C A L A B S T R A C T
a b s t r a c t
a r t i c l e i n f o
Article history: Received 20 January 2021
Received in revised form 18 March 2021 Accepted 6 April 2021
Available online xxxx Editor: Jan Vymazal
Keywords: Restocking Freshwater ecosystems Capture-mark-recapture Endangeredfish Species conservation European eel
Thefitness of restocked European eel (Anguilla anguilla), an endangered fish species, was studied in relation to the environmental variables of habitats in six upland rivers that are typologically different in terms of their hydromorphological and physicochemical characteristics, food resources andfish communities. These rivers re-ceived a total of 76,370 imported glass eels in 2017. During a three-year period, we monitored eels with respect to total length, annual growth rate, condition factor and density using capture-mark-recapture experiments to understand the effects of the characteristics of receiving rivers on restocking success levels. Our results showed the survival of the restocked eels in the six rivers and revealed significant differences between them in terms of total length, condition factor and density. Better performance in eel yield variables was observed in a eutrophic alkaline river with greater roughness of riverbed substrates, dominant pool- and riffle-type flow facies and lower brown trout density. The variables conductivity and total hardness had higher explanatory power and were strongly associated with increased eel density. This study suggests that a well-selected habitat/river in a restocking programme can be beneficial for the species and recommends restocking practice as a management tool to achieve eel conservation goals.
© 2021 Elsevier B.V. All rights reserved.
1. Introduction
The European eel Anguilla anguilla is a facultative catadromousfish species that reproduces in the Sargasso Sea in the western Atlantic Ocean and migrates from its spawning areas to growing marine and brackish environments and inland freshwaters (Tesch and Thorpe,
⁎ Corresponding author.
E-mail addresses:[email protected](B. Nzau Matondo),[email protected]
(J.-P. Benitez),[email protected](A. Dierckx),[email protected](S. Renardy),
[email protected](X. Rollin),[email protected](M. Ovidio).
https://doi.org/10.1016/j.scitotenv.2021.147042
0048-9697/© 2021 Elsevier B.V. All rights reserved.
Contents lists available atScienceDirect
Science of the Total Environment
j o u r n a l h o m e p a g e :w w w . e l s e v i e r . c o m / l o c a t e / s c i t o t e n v2003;van Ginneken and Maes, 2005). The species successfully occupies a broad range of growing habitats in the continental shelf where it spends most of its lifecycle, developing from juvenile eels in the growth phase to silver eels in the maturation phase, before migrating back to the spawning grounds of the Sargasso Sea for breeding and death (van den Thillart et al., 2004; Prigge et al., 2013; Nzau Matondo et al., 2019). With their phenotypic plasticity and ontogenetic changes in hab-itat use, riverine ecosystems from the estuary to the headwaters may provide important growing areas (Vøllestad, 1992; Jacoby and Gollock, 2014; International Council for the Exploration of the Sea
-ICES, 2019).
Since the 1970s, this species' stocks have been continuously de-pleted throughout its entire geographic range and seem to have reached an unprecedentedly low level in recent years. Eel stocks andfishing yields throughout the world have declined by about 5% per year for more than half a century, now representing less than 10% of their histor-ical levels (Dekker, 2019;ICES, 2019). From 1980 to 2010, glass eel re-cruitment from the ocean to the continent declined by approximately 15% per year, representing 1–10% of its previous levels. In 2019, glass eel recruitment has fallen to 1.4% of the 1960–1979 average in the North Sea (ICES, 2020).
The causes of this eel population decline include habitat loss, barriers to migration in freshwaters, riverine habitat oligotrophisation, re-duced food availability, predation, turbine mortality, overfishing, pollu-tion, parasite disseminapollu-tion, virus infection and oceanographic and climatic changes (Moriarty and Dekker, 1997; Feunteun, 2002;
Friedland et al., 2007;Simon, 2007;Belpaire et al., 2009;Delrez et al., 2021). This drastic decline in eel led the Council of the European Union to adopt in 2007 a framework regulation with conservation mea-sures aimed at restoring the altered stocks of European eel at sustain-able levels of adult eel abundance and glass eel recruitment (Council of the European Communities, 2007). To be effective, these measures should improve both the stocks of the species and the quality of its growth, movement and migration environments. The restocking of glass eels is one of the conservation measures included within the Eel Recovery Plan of Europe that enhances the stocks of eels.
Eel restocking consists of translocating young stages of the species from estuarine habitats with high eel density to riverine ecosystems where there is no or little natural colonisation of eels (Pedersen, 2000;
Ovidio et al., 2015;Nzau Matondo et al., 2019). However, the timing and potential importance of within-generation local selection acting on genes that influence local life-history characteristics at local level is not yet sufficiently documented.Stacey et al. (2015)suggested for restocking with long-distance transfers of young eels to match the life-history char-acteristics of the donor and recipient sites to increase the likelihood that conservation goals will be achieved. Restocking process is dependent on wild-caught glass eels and elvers, as artificial reproduction of the species has not yet been achieved (Pedersen and Rasmussen, 2016). This practice offers hope but also constitutes a suitable tool for countries with growing eel riverine ecosystems that are distant from the sea, so that they can con-tribute to eel sustainability by boosting the number and biomass of poten-tial spawners, which escape to the sea at the silver eel stage (Brämick et al., 2016;Nzau Matondo et al., 2020). However, a habitat's carrying ca-pacity, defined as the maximum density or biomass that aquatic habitats can sustainably support, affects eel yields during restocking (Acou et al., 2011;Boulenger et al., 2014). This is because environmental conditions, including both abiotic and biotic factors, greatly affect eel survival and growth. The growth of eels is depressed in habitats where food resources are depleted or insufficient and where space resources are unsuitable (Sinclair, 1989;Pedersen and Rasmussen, 2016). Eels feed on benthic fauna comprising invertebrates and small fish, whose composition changes according to type of habitat. Higher eel growth rates have been reported in individuals dwelling in riffle-type habitats because benthic community productivity is higher in riffles than in run- and pool-type habitats (Whitledge and Rabeni, 2000;Boulenger et al., 2014). The larger granulometry of riverbed substrates has been found to be positively
correlated with eel density and the size of the areas used by eels as it pro-vides better protection against currents and predators and offers abun-dant food resources through the occurrence of more diverse communities of macroinvertebrates (Nzau Matondo et al., 2019;Félix et al., 2020a, 2020b). Temperatures in riverine ecosystems also affect the growth of eels through food availability and eel activity: eel growth and activity generally stop below 8 °C (Nyman, 1972;Sadler, 1979;
Baras et al., 1998;Morin et al., 1999;Ovidio et al., 2013;Itakura et al., 2017). Eels are less vulnerable to low pH than most freshwaterfish spe-cies, but higher pH increases eel density, as revealed by studies showing that eel abundance greatly increased in acidified Norwegian rivers after liming operations during a period in which species abundance continued to decline in Europe as well as in Norwegian rivers that were not limed (Almer et al., 1974;Larsen Bjørn et al., 2015). Biotic factors such as the composition of sympatric fauna to eels also have an impact on the eel re-sponse. Negative interactions like predation, exclusion and food competi-tion can occur between sympatric fauna and eels. Predacompeti-tion and exclusion affect eel survival, as eels have been found in the stomachs of European catfish Silurus glanis, which compete with them for food and space (Wysujack and Mehner, 2005;Gualtieri et al., 2006;Guillerault et al., 2017). Prey competition influences food availability, which directly affects the growth performance of eels, as certainfish species (including salmo-nids) co-occur with eels and feed on the same types of prey (Bridcut and Giller, 1995;Vignes, 1995;Bardonnet and Baglinière, 2000;Heggenes and Wollebæk, 2013;Boulenger et al., 2014).
Growth directly affects eels' reproductive success via good age/ size at maturity, higher fecundity and short sensitivity time to size-selection predators; moreover, better individual growth is beneficial for the recovery of altered stocks of eels (Werner and Gilliam, 1984;
Wootton, 1990;Rose et al., 2001). According toBoulenger et al. (2014), growth rate is a key parameter infish population manage-ment and therefore a major component in the managemanage-ment of en-dangeredfish species like the European eel. However, eel growth performance is closely linked to the carrying capacity of habitats, es-pecially the hydromorphological, physicochemical, trophic and sym-patric fauna characteristics of eels' growing environments. Most of the environmental factors that influence eel growth are structured along the longitudinal gradient and can greatly vary among catch-ment areas within the same river basin (Daverat et al., 2006, 2012;
Lasne et al., 2008).
Although restocking is an important conservation measure for the enhancement of local eel stocks and over the long run most likely for the achievement of the silver eel escapement target in the Eel Recovery Plan of Europe, it is still poorly understood. Indeed, owing to difficulties in the implementation of efficient monitoring due to eels' low recapture efficiency, many studies on restocking practice have been performed within the same catchment area at sites located along a longitudinal gradient and during short time periods (Desprez et al., 2013;
Kullmann and Thiel, 2018;Félix et al., 2020a, 2020b). In particular, there remains a paucity of information on the possible effects of the ty-pological diversity provided by multiple catchment areas of water-courses within the same river basin on eel yields after restocking. Given the plasticity of the species to colonise and adapt to a wide range of aquatic ecosystems, with encouraging outcomes from restocking in inland freshwaters recently reported (Ovidio et al., 2015;
Nzau Matondo et al., 2019, 2020;Félix et al., 2020a, 2020b;Delrez et al., 2021), this practice sounds interesting to investigate. In the Bel-gian Meuse River, the number of ascending yellow eels entering from the North Sea via the Dutch Meuse has dropped by about 3.6% per year from 1992 to 2020; in 2020 the number represented 0.6% of the historical level recorded in 1992 (Nzau Matondo and Ovidio, 2016, 2018;Nzau Matondo et al., 2019, 2020). This eel decline is due to the low glass eel recruitment in the North Sea (ICES, 2020). If nothing is done, the eel will probably disappear from the Belgian Meuse basin in the next decade, rendering the optimisation of restocking practice an urgent issue.
In this study, we selected six catchment areas of upland rivers belonging to the same river basin (the Belgian Meuse in Southern Belgium, located >320 km from the North Sea) that typologically differ in terms of their hydromorphological and physicochemical characteris-tics, food resources andfish communities. These Belgian upland rivers were restocked with imported glass eels and monitored using analyses of both abiotic and biotic variables of habitats and capture-mark-recap-ture experiments to assess eel yields during thefirst three years of eel freshwater life after restocking. Regarding whether the sampled rivers were sufficiently different in terms of typology, we hypothesised that: (i) glass eelfitness as estimated by annual growth rate, density and con-dition factor is widely distributed among the rivers; (ii) environmental variables of habitats more favourable to optimal eel living conditions are considerably correlated to eelfitness; and (iii) increased abundance of sympatric species and predators corresponds closely with decreased eelfitness, suggesting the existence of competition for space and food resources as well as predation.
2. Material and methods 2.1. Study areas
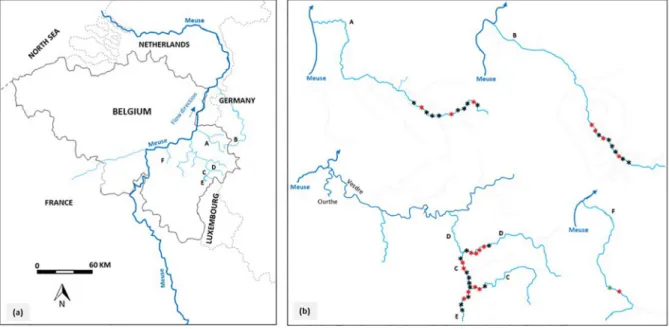
The study was conducted in six typologically different upland rivers: Berwinne (A), Gueule (B), Wayai (C), Hoegne (D), Winamplanche (E) and Oxhe (F) (Fig. 1andTable 1). These rivers belong to the Belgian Meuse River basin and are located >320 km from the North Sea. They have similar thermal regime with daily mean water temperature rang-ing from 10.3 °C (in E) to 11.3 °C (in A). Seasonal changes in water tem-perature indicate that the eel growing period (> 8 °C) mainly occurs from April to late October (Sadler, 1979;Morin et al., 1999;Nzau Matondo et al., 2019) (Fig. 2). Rivers A, B and F are direct tributaries of the Meuse River; the confluences of A and F are located in Belgium and B in the Netherlands. E is a direct tributary of river C, which drains into river D,flowing directly into the Vesdre River (Fig. 1). The Vesdre River is direct tributary of the Ourthe River, which drains into the Meuse River in Belgium. Rivers A, E and F are typical of the brown troutfish zone (Huet, 1949) and have a similar river width, but in A the riverbed substrate mainly consists of large stones and blocks and the riffle-type flow is abundant. River B is deeper and eutrophic, being typical of the lower graylingfish zone (Huet, 1949), with an abundant habitat of the lentic channel type and bottom substrates dominated by
fine stone and coarse gravel. Rivers C and D are flowing and oligotro-phic, with boulders and blocks representing the predominant bottom substrates. They are respectively typical lower and upper brown trout fish zones and along with B the widest rivers. D and F have highly abun-dant plant cover. D and E are slightly acidified rivers because they flow through substrates (sandstone, aluminous shale and quartz-phyllates) that are poor in alkaline cations.
The variables river width, depth, vegetation cover, bottom substrates andflow features were assessed every 5 m on a 200-m long river stretch at each site. Riverbed substrate was specified by measuring bottom sub-strate size according to the standardised method of Malavoi and Souchon (2002). Flow facies were characterised using the geomorphic units' classification keys (Malavoi, 1989;Malavoi and Souchon, 2002). 2.2. Glass eel release
Glass eels caught on France's Atlantic coast were imported through a commercial trade company (SAS Gurruchaga Marée, France) by truck and were translocated into six recipient rivers on the date of arrival, 21 March 2017. Recipient rivers were selected based on their typologi-cal differences; moreover, some of them previously had abundant wild eel stocks that have either completely disappeared or have been re-duced to the presence of a few old individuals because of the shutdown of the natural immigration of wild eels from the Belgian Meuse River, which is distant from the sea and where glass eel stage is naturally ab-sent (Baras et al., 1996;Philippart, 2006;Philippart et al., 2010;Nzau Matondo and Ovidio, 2016, 2018;Nzau Matondo et al., 2019). The re-leased glass eels had a mean value (± standard error) of 67.0 (± 3.6) mm for the total length (TL) and 0.23 (± 0.04) g for the weight (W). The relationship between TL and W was described as follows: log W (g) =−3.19 + 3.06 × log TL (cm), R2= 0.71, p < 0.0001 and n = 51,
and the condition factor (K) was 0.07 (± 0.01). Their identified pigment stages ranged from VBto VIA2according toElie et al.'s (1982)
descrip-tion. They demonstrated an excellent sanitary status and were free of pathogens (Delrez et al., 2021).
Five rivers contained multiple release sites (5 to 11 sites per river), which were spaced at least 250 m apart (Table 1). In these rivers, the number of restocked sites surveyed varied between 2 and 4 sites per river. River F had a higher density of glass eels because it received at a single site the rest of the glass eels released after a fullfield day on 21 March 2017. In F, two neighbouring sites were surveyed, one of which
Fig. 1. Map of the study area in Wallonia, Southern Belgium (a) and the sampling sites in the six restocked rivers (b).
*
indicates the glass eel release sites unsurveyed. indicates the release sites surveyed. indicates the surveyed site without the release of glass eels. Rivers are A, B, C, D, E and F.had not received glass eels. The release sites of the glass eels as surveyed eel sites were selected on the basis of accessibility, feasibility of efficient electrofishing and availability of good habitats for restocked eels (Ovidio et al., 2015;Nzau Matondo et al., 2019).
2.3. Data collection
Each autumn (September to early October) from 2017 to 2019, an-nual electrofishing sessions were performed in the six recipient rivers of glass eels. The sampling of restocked eels was performed using elec-trofishing generators (EFKO, 3.0 kVA FEG 5000, 150–300/300–600 V DC, in accordance with VDE 0686, IEC 60335–2-86, Leutkrich im Allgäu) and hand nets with a 40 × 40 cm diameter and 2 × 2 mm mesh according to the technique described byOvidio et al. (2015)andNzau Matondo et al. (2019, 2020). Electrofishing captures were realised in a 200-m long river stretch, including 100 m upstream and 100 m downstream of the glass eel release point at each selected site, with the exception of one of the two sites in river F, which had no glass eel release point but was surveyed with the same river stretch length. The captured eels were anaesthetised by immersion in a 1:10 ratio of eugenol to
alcohol (0.5 mL L−1) and measured (total length-TL, ± 1 mm), weighed (± 0.01 g) and scanned to identify eels already tagged in preceding sampling sessions (Nzau Matondo et al., 2020). Small bio-compatible radiofrequency identification (RFID) tags (half duplex, 134.2 kHz, size/weight in air: 12 × 2 mm/0.095 g; Texas Instruments Inc., Dallas) were inserted into a 2-mm-long incision made in the vis-ceral cavity of the untagged eels captured (Nzau Matondo et al., 2019). The inserted tags weighed, on average, 1.10% (range = 0.03–4.75%, Q95= 3.28%) of the eel's body mass. After full recovery,
all eels were released into the river at their exact capture point. The variables analysed during the surveys impliedfive eel restocking variables: density of glass eels at release (Di), density of restocked eels (Dr), condition factor (K), total length (TL) and annual growth rate (G). They also implied two biotic variables linked to sympatric fauna: species richness (spe) and density of brown trout (Dtrout) as a potential predatory species.
Eleven water physicochemical variables were measured in each river studied. Temperature (T) was continuously recorded using Tidbit v2 data loggers (Onset Computer Corporation, Bourne, Massachussetts). Dissolved oxygen (O2) and conductivity (con) were monthly measured
Table 1
Characteristics of the studied rivers. Bottom substrate particle sizes (in cm diameter perpendicular to the longest axis) are: boulder (> 102.4); bloc (26-102); large stone (13-25);fine stone (6.4-12.8); coarse pebble (3.2-6.4); and coarse gravel (0.8-1.6). River width and depth were measured in September; SE means standard error; ind. indicates individuals. Rivers are A, B, C, D, E and F.
Parameters A B C D E F
Altitude (m) 144 155 172 178 221 100
Catchment area (km2) 118.0 380.0 97.0 128.9 – 45.3
Direct tributary Meuse Meuse Hoegne Vesdre Wayai Meuse
River length (km) 25 56 15 34 8 12
Distance from the North Sea (km)
341 324 376 376 381 366
Distance from the River Meuse (km)
18 43 34 36 38 3
Distance from the River mouth (km)
18 43 0.35 11.5 0.09 3
Fish zone Brown trout Lower Grayling Lower Brown trout Upper Brown trout Brown trout Brown trout Density of glass eels at
restocking (mean ± SE, in ind. m−2)
1.19 ± 0.44 1.12 ± 0.15 0.98 ± 0.24 1.36 ± 0.30 0.50 ± 0.05 3.75
Width (mean ± SE, in m)
4.7 ± 1.4 7.5 ± 1.0 6.7 ± 1.2 7.4 ± 1.3 4.8 ± 1.0 4.8 ± 1.1
Depth (mean ± SE, in cm)
18.4 ± 10.0 36.6 ± 19.9 21.4 ± 11.6 22.2 ± 12.2 20.7 ± 12,9 16.8 ± 8.4
Glass eel release site (number) 11 10 10 6 5 1 Restocked site surveyed (number) 3 4 4 4 2 2 Vegetation cover (mean ± SE, in %) 56.3 ± 35.0 36.3 ± 25.8 59.8 ± 31.6 84.0 ± 19.8 64.7 ± 34.0 87.1 ± 16.3 Daily water temperature (mean ± SE, in °C) 11.3 ± 3.6 11.2 ± 3.5 11.0 ± 3.5 10.5 ± 3.9 10.3 ± 4.0 10.7 ± 3.4 pH (mean ± SE) 7.68 ± 0.12 7.76 ± 0.12 7.35 ± 0.23 6.64 ± 0.41 6.76 ± 0.04 7.72 ± 0.09 Phosphates (mean ± SE, in mg L−1) 0.35 ± 0.31 0.31 ± 0.27 0.04 ± 0.05 0.10 ± 0.05 0.02 ± 0.01 0.10 ± 0.11 Bottom substrates (in decreasing abundance order) Predominant substratum Large stone + Block
Large stone + Fine stone + Coarse gravel
Boulder + Large stone + Coarse gravel + Block
Block + Large stone + Boulder
Boulder + Coarse pebble
Large stone + Fine stone + Coarse pebble Abundance (%) 43.9 + 20.9 = 64.4 24.5 + 26.0 + 23.4 = 73.8 28.8 + 18.6 + 16.4 + 14.4 = 78.3 30.1 + 29.0 + 20.0 = 79.1 46.8 + 36.7 = 83.5 30.6 + 26.6 + 14.0 = 71.2 Flow features (in decreasing abundance order) Predominant flow features
Run, pool and Riffle
Run, Lentic Channel and Riffle
Run and Rapid Run and Rapid Run and pool Run, pool and Riffle Abundance (%) 48.5 + 32.0 +
17.0 = 97.5
38.6 + 27.9 + 13.2 = 79.7 58.8 + 28.6 = 87.4 58.7 + 32.5 = 91.2 72.0 + 16.4 = 88.4
64.0 + 16.9 + 12.5 = 93.4
using a multi-parametric probe (HACH HQ30D, Loveland, Colorado). The variables ammonium (NH4+), nitrite (NO2−), nitrate (NO3−),
phos-phate (PO4−3), pH, calcium carbonate (CaCO3), total hardness (Gh) and
carbonate hardness (Kh) were monthly analysed using a colorimetric kit (JBL ProAqua Test Lab, Germany). Water samples for these tests were collected on the same day at the study sites.
2.4. Statistical analyses
As assumptions of normality and homogeneity were not met, a non-parametric Kruskal-Wallis (KW) test and a post-hoc Dunn's test with Bonferroni correction for multiple pairwise comparisons of mean rank sums were run to compare the total lengths between the eight groups of tagged eels and untagged eels set up after restocking as well as the total lengths of the restocked eels and the annual growth rates of the tagged eels recaptured between the recipient rivers. These tests were also performed to test whether the density of eels and the condition fac-tors were independent of the six selected rivers. Eel density was calcu-lated according to the following equations: D = N × S−1, S = lr× w and
S = ls× w. In these equations: D is the density; N is the number of glass
eels released or eels captured; S is the area in m2; w is the width of the
river stretch site restocked in metres; and lrand lsare the site lengths,
being 250 m (125 m up and 125 m down from the glass eel release point) for glass eel density (Di) and 200 m (100 m up and 100 m down from the glass eel release point) for restocked eel density at sur-veys (Dr). The following formula was used to evaluate the condition fac-tor of eels: K = 100 × W × (TLb)−1. In this equation: K is the condition
factor; W is the body weight in grams; LT is the total length in centimetres; and b is the growth coefficient described below. A one-sided Wilcoxon signed-rank test for paired samples with normal conti-nuity correction was used to test for differences in annual growth rates between tagged and untagged eels. Annual growth rates were assessed using the following formula (Kumai et al., 2020): G = (L−L0) × T−1. In
this equation for the untagged eels: G is the annual growth rate; L is the total length of restocked eels at capture; L0is the total length of glass
eels at release; and T is eel age after restocking. For the tagged eels: L is the total length of restocked eels at recapture; L0is the total length
of restocked eels at tagging; and T is the number of years between tag-ging and recapture. The relationships between total length (TL) and weight (W) were calculated using the eq. W = a × TL b and
logarithmically transformed into a linear regression, defined as log10
(W) = b × log10(TL) + log10(a). In this equation: W and TL are body
weight in grams and total length in centimetres, respectively; a (inter-cept) is a coefficient referring to body shape; and b (slope) indicates the growth coefficient (b = 3, meaning the isometric growth; b < 3 the negative allometric growth; and b > 3 the positive allometric growth) (Froese, 2006). The relationship between the annual growth rate and the total length in the tagged eels recaptured was assessed using a generalised linear model (GLM, gamma distribution and log-link function), which included the total length as afixed effect and the growth rate as a random effect. Pearson's correlation coefficients were carried out to assess the relationships between species richness and time and between total length and time. This correlation test was also run to assess collinearity between variables; variables were considered for suppression at p > 0.7. The variables implied 11 physicochemical variables (T, O2, con, NH4+, NO2−, NO3−, PO4−3, pH, CaCO3, Gh, Kh) and
10 hydromorphological variables (block, large stone, coarse gravel, pool, run, riffle, lentic channel, depth, river width, cover), 2 biotic variables (spe, Dtrout) and 5 eel yield variables (Di, Dr., LT, G, K). To as-certain patterns between the selected explanatory variables (environ-mental and eel yield parameters) and response variables (rivers), principal component analysis (PCA) was performed. Pearson's chi-squared test was used to identify differences in species richness and brown trout density among rivers. Species richness referred to the total number offish species plus crayfish species identified during the electrofishing sessions. Individuals in species potentially predatory to restocked eels were also counted. All statistical analyses were carried out in the R statistical software version 3.3.2 packages Rcmdr 2.3.-2, dunn.test and FactoMineR (Lê et al., 2008;R Development Core Team, 2016;Dinno, 2017;Fox, 2017). The results were considered significant when p < 0.05.
3. Results
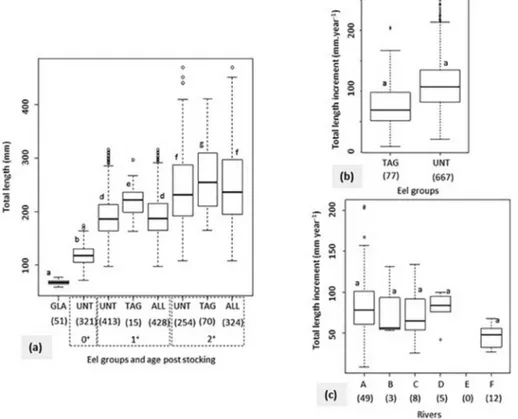
The restocked eels grew in a contrasting way in total length in all riv-ers, with or without RFID tagging (Fig. 3, Kruskal-Wallis-KW test: df = 7;χ2= 1024.90; p < 2.2 × 10⁻¹⁶). Their total lengths increased over
time in rivers (Fig. 4; Pearson correlations, range: r = 0.984–0.999), with significant correlations (p < 0.05) in rivers B, C and D. Neither eels 0+nor tagged eels were captured in E. From ages 1+to 2+, the
lengths of the recaptured tagged eels were significantly higher than those of the untagged eels (KW test: df = 7;χ2= 1024.90; p < 2.2 ×
10−16and Dunn's test: t = 7.217–9.823; p < 0.0001). Eel lengths dif-fered among rivers and were annually smaller in rivers F and E than in rivers A, B and C (KW test: df = 4–5; χ2
= 53.632–62.149; p = 2.5 × 10⁻¹⁰–8.6 × 10⁻¹² and Dunn's test: t = 3.472–4.767; p =
0.0351–0.0001). By contrast, the annual growth rates (in mm. year−1)
of the restocked eels did not differ significantly between the tagged eels recaptured (mean ± standard error values = 78 ± 43; 90% be-tween 21 and 159) and the untagged eels (111 ± 42; 51–192) (Wilcoxon test: df = 1; V = 1461; p = 0.4969). The annual growth rates of the tagged eels recaptured ranged in mean values from 46 (in river F) to 86 mm.year−1(in A), but without significant differences be-tween rivers (KW test: df = 4;χ2= 3.73; p = 0.4433). They also did not
correlate with their total lengths at tagging (GLM gamma: coefficient ± SE =−5.694 × 10⁻⁴–1.098 × 10⁻³; Z =−0.519; p = 0.606; n = 77).
In the rivers, the lengths of the restocked eels correlated positively to their weights and explained 85–98% (adjusted R2
, p < 0.0001) of the variance of the weights, but with the lowest variances of 34% (p = 0.009; age 0+) and 67% (p < 0.0001; 1+) recorded in river D
(Table 2). Positive allometric growth rates were observed in more than half of the six restocked rivers (allometry coefficient, b = 3.02–3.56) at each age of eels. Negative allometric growth rates were re-corded at ages 0+in D (b = 2.1), 1+in C and D (b = 2.8) and 2+in E (b = 2.8). The observed condition factor in restocked eels ranged from 0.020 (river D, age 2+) to 2.631 (D, age 0+), with mean ± standard
Fig. 2. Daily variations in water temperature in the six restocked rivers pooled, from 2017 to 2019. Data are daily mean values.
error values of 0.153 ± 0.177, 90% of eels between 0.048 and 0.320 and n = 1081 (Table 2). The highest mean condition factor in restocked eels was also observed in river D at age 0+(K = 1.23) (KW test:
df = 16; χ2 = 940.30; p < 2.2 × 10⁻¹⁶and Dunn's test: t =
−11.621 to 7.411; p < 0.0001). The density of eels at surveys was higher in A (mean ± SE, 0.08 ± 0.04 ind. m−2) and F (0.06 ± 0.03 ind. m−2) and lower in C (0.03 ± 0.01 ind. m−2), E (0.02 ± 0.02 ind. m−2), D (0.01 ± 0.02 ind. m−2) and B (0.01 ind. m−2) (KW test: df = 5;χ2= 18.57; p < 0.0023 and Dunn's test, p < 0.05).
The variables TL, G, T, O2, NO2−, NO3−, Di, cover, pool, depth and riffle
were excluded from the PCA analyses, as they were highly collinear with the remaining variables. The latter (n = 18) revealed a significant relationship with the variance explained by thefirst two axes, namely 28.1% and 17.9% (Fig. 5). In the ordination plots, conductivity and total hardness were important explanatory variables and were positively re-lated to rivers A, B and F as well as to eel density at the surveys (Pearson's correlation, r = 0.394, p = 0.038 and r = 0.498, p = 0.005, respectively). The density of eels at the surveys was also highly corre-lated with pool and large stones, which were most abundant in A, where calcium carbonate, phosphates and species richness were higher but the density of brown trout as a potential predatory species was lower. The density of eels at the surveys was not significantly correlated with the density of glass eels at release (r =−0.089; p > 0.05), but it was significantly correlated with river width with a weaker link (r = 0.37, p = 0.041). The eel condition factor was higher in C, D and E, where run-type habitats were abundant and the density of brown trout was high. The riverbed substrate of coarse gravel was higher in B, where a habitat of lentic channel type was abundant.
The species richness of the sympatric aquatic fauna to the restocked eels was high, with globally 17 differentfish species and 1 crustacean, 4 of which were potentially predatory to restocked young eels. Predatory species included brown trout, catfish Silurus glanis, resident European eel and crayfish Astacus pacifastacus (Fig. 6). However, the abundance
Fig. 3. Total lengths of restocked eels according to age (a), annual growth of tagged eels and untagged eels (b) and annual growth of tagged eels according to rivers (c). GLA: restocked glass eels; UNT: untagged eels; TAG: tagged eels recaptured; ALL: both tagged eels recaptured and untagged eels combined. Rivers are A, B, C, D, E and F. Numbers in brackets indicate sample size. Boxplots are presented with medians, hinges are versions of thefirst and third quartiles and circles indicate outliers. Eel groups and rivers with the same letter are not significantly different (KW and Dunn's tests: p < 0.05 for (a) and (c), and Wilcoxon test: p < 0.05 for (b)).
Fig. 4. Total lengths of restocked eels according to age and rivers. Rivers are A, B, C, D, E and F. Age of restocked eels: 0+
; 1+ ; and 2+
. Sample sizes (n) are: river A, n = 161, 181 and 135 for age 0+, 1+, and 2+, respectively; B, n = 39, 27 and 27; C, n = 74, 73 and 65; D, n = 19, 63 and 13; E, n = 0, 37 and 8; F, n = 27, 53 and 78. Boxplots are presented with medians, hinges are versions of thefirst and third quartiles and circles indicate outliers. For the same age of eels, rivers with the same letter are not significantly different (KW and Dunn's tests: p < 0.05).
of predatory species was low and limited to the presence of a few indi-viduals in the rivers, with the exception of brown trout, which was very abundant and therefore considered the most powerful predator of the restocked eels. River A exhibited the lowest brown trout density (Pearson's chi-squared test: df = 1;χ2= 6.27
–131.58; p = 0.012 to < 2.2 × 10⁻¹⁶). The resident eels occurred in 4 of the 6 restocked rivers with the highest eel densities in rivers A (up to 0.010 ind.m−1) and F (0.030 ind.m−1) during thefirst electrofishing surveys performed six months after restocking. These eels were larger (TL, mm: mean = 604; range = 396-780) and were identified at each electrofishing sur-vey as eels with TL outside the TL range of eels released in this study. The species richness of the rivers varied from 6 to 17 species, with sig-nificantly higher species diversity seen in river B than in rivers D, E and F (Pearson's chi-squared test: df = 1; χ2
= 4.92–10.52; p = 0.0265–0.0011). The species diversity was constant in river F and did not significantly change with time in other rivers (Pearson's correla-tions, range: r = 0.240–0.866; p > 0.05).
4. Discussion
Through the use of capture-mark and recapture experiments com-bined with habitat parameter analyses conducted in six typologically different upland rivers, this study has brought new insights into rela-tionships between environmental variables and eel response in terms offitness after restocking. We have shown the occurrence of restocked eels in a wide diversity of upland riverine ecosystems where they adapted to translocation from an estuary and grew satisfyingly after being restocked. Undoubtedly, our results demonstrate that with regard to the drastic decline in the process of the upstream natural colonisation of wild eels, glass eel restocking practice in upland rivers can be deemed an original solution as well as a source of hope for countries further from the sea to enhance their local stocks and probably over the long run to increase silver eel escapement rates through a greater contribution of upland freshwaters to the production of restocked-origin silver eels (Ovidio et al., 2015;Nzau Matondo et al., 2019, 2020;Félix et al., 2020a, 2020b). As the European eel consists of a single panmictic popu-lation that is generally unstructured in meta-popupopu-lation throughout its entire range, there is no genetic argument against translocation of eels
within its distribution area or between river basins for restocking purposes (van Ginneken and Maes, 2005;Palm et al., 2009;Nzau Matondo et al., 2020).
Our results demonstrate the capacity of glass eels to adapt to a wide range of inland water bodies with diverse hydromorphological and physicochemical characteristics and food webs as well asfish communi-ties. This is consistent with the plasticity in habitat use reported in this highly adaptivefish species (Vøllestad, 1992;Boulenger et al., 2014;
Larsen Bjørn et al., 2015;Drouineau et al., 2018). In this study, the restocked eels adapted to rivers with a wide diversity of habitat charac-teristics, ranging from small to large grain sizes of bottom substrates, ol-igotrophic to eutrophic status, lentic to loticflow facies and slightly acidic to alkaline waters. This is not surprising, as the species has some-times been found settled in extreme environmental conditions such as highly acidified rivers (pH 4–5) due to its effective mechanism for reg-ulating blood ion concentration so that it can tolerate low pH conditions (Reynolds, 2011;Larsen Bjørn et al., 2015). The level of eel presence re-ported in terms of density (mean value of 8 individuals per 100 m2and
maximum up to 13 individuals per 100 m2 in river A) has been
underestimated as the species displays cryptic behaviour. Indeed, the exact level of eel production in terms of density is probably higher; for instance,Nzau Matondo et al. (2020)reported only a 12.1% catchability rate using the same capture method. Even if glass eels were successful in adapting to all the rivers we tested, we observed different responses ac-cording to the characteristics of the release places. The low eel density in the deepest river B owed to the poor quality of shelters in thisflowing river. In rivers D and E, the low eel density can be linked to their slightly acidified waters, as also revealed by their low species richness. In E, no tagged eels were recaptured during the three-year study. The density of eels and species richness reported in this river could be explained by the influence of the confluence with the river C, which is less acidi-fied. Similarly, in an upstream section of E surveyed in the first year, no eels 0+were captured and only threefish species were present.
This upstream stretch was abandoned due to the poor quality of the bot-tom substrates, which do not provide good burial for eels and the longi-tudinal effect of the pH gradient.
We found no major differences in the annual growth rates of the restocked eels between the PIT-tagged eels (mean value, 78 mm.
Table 2
Relationships between the total length (TL) and the weight (W) in the restocked eels described as log W (g) = b × log LT (cm) + a, and condition factor (K) of restocked eels according to age and rivers. Glass eels at stocking and captured eels (tagged eels recaptured and untagged eels combined). GLM models: * p < 0.01; ** p < 0.001; and *** p < 0.0001. For the same age of eels, K values with the same letter are not significantly different (KW and Dunn's tests: p < 0.05). Rivers are A, B, C, D, E and F.
Year after stocking Age River n Relation between TL and W K, Mean ± SE 90% K
b a F-statistic Adjusted R2
P-value Level of significance
2017 0: Glass eels All 51 3.060 −3.185 117.9 0.710 1.2 × 10⁻¹⁴ *** 0.066 ± 0.008 0.054–0.078
2017 0+ A 161 3.329 −3.134 2007 0.926 <2.2 × 10⁻¹⁶ *** 0.074 ± 0.010ab 0.059–0.086 B 39 3.449 −3.292 968 0.962 <2.2 × 10⁻¹⁶ *** 0.051 ± 0.006a 0.045–0.065 C 74 3.265 −3.094 527 0.878 <2.2 × 10⁻¹⁶ *** 0.082 ± 0.014ab 0.061–0.101 D 19 2.095 −1.936 8.642 0.337 9.2 × 10−3 * 1.227 ± 0.433c 0.751–1.796 E – – – – – – – – F 27 3.203 −3.014 163 0.862 1.8 × 10⁻¹² *** 0.098 ± 0.018b 0.070–0.129 2018 1+ A 181 3.060 −2.864 5887 0.971 <2.2 × 10⁻¹⁶ *** 0.137 ± 0.016b 0.116–0.160 B 27 3.167 −3.000 168 0.865 1.4 × 10⁻¹² *** 0.103 ± 0.018a 0.085–0.115 C 73 2.802 −2.518 595 0.892 <2.2 × 10⁻¹⁶ *** 0.316 ± 0.152c 0.240–0.367 D 63 2.796 −2.535 128 0.672 <2.2 × 10⁻¹⁶ *** 0.298 ± 0.059c 0.247–0.350 E 37 3.019 −2.844 773 0.955 <2.2 × 10⁻¹⁶ *** 0.144 ± 0.011b 0.129–0.161 F 53 3.086 −2.872 2380 0.979 <2.2 × 10⁻¹⁶ *** 0.135 ± 0.018b 0.115–0.157 2019 2+ A 135 3.099 −2.909 4617 0.972 <2.2 × 10⁻¹⁶ *** 0.124 ± 0.017a 0.103–0.154 B 27 3.491 −3.476 1102 0.978 <2.2 × 10⁻¹⁶ *** 0.034 ± 0.004a 0.028–0.041 C 65 3.177 −3.011 3028 0.980 <2.2 × 10⁻¹⁶ *** 0.098 ± 0.012a 0.081–0.124 D 13 3.562 −3.558 258.3 0.955 5.5 × 10⁻⁹ *** 0.028 ± 0.004a 0.021–0.031 E 8 2.756 −2.488 42.3 0.855 6.3 × 10⁻⁴ *** 0.335 ± 0.100b 0.269–0.571 F 78 3.080 −2.890 1355 0.946 <2.2 × 10⁻¹⁶ *** 0.131 ± 0.029a 0.104–0.161
year−1) and the untagged eels (111 mm.year−1). The annual growth rates of the PIT-tagged eels recaptured also showed no significant differ-ences among the rivers, the mean values ranging from 46 to 86 mm. year−1. The lack of significant differences in growth rates between the tagged eels and the untagged eels in our study indicates that the PIT-tagging did not inhibit the growth of the eels. This made it difficult to compare the two groups because of dispersal of restocked eels occurred between neighbouring sectors within the same river as restocking was performed using several release sites in rivers that were open aquatic environments. Comparison between the two groups would require careful experiments under a controlled environment. The growth rates observed in our study are comparable to those ranging from 20 to 69 mm.year−1reported from eels restocked in European eutrophic aquatic environments (20–50 mm.year−1:Bisgaard and Pedersen, 1991; 36–51
mm.year−1: Pedersen, 2000; 22 mm.year−1: Mazel et al., 2013; 23–49 mm.year−1:Simon et al., 2013; 24–62 mm.year−1:Ovidio et al., 2015; 30–69 mm.year−1: Silm et al., 2017; 31 mm.year−1: Nzau Matondo et al., 2019). The variability in the growth rates of eels between these studies may be the result of differences in the age and the size of the individuals analysed and the growth assessment methods (otolith incre-ments or capture-mark and recapture experiincre-ments) used as well as in the habitats' characteristics and carrying capacity. According toSilm et al. (2017), the age of the eels sampled plays a crucial role in growth rate es-timates, as eel growth rates decrease with age. Moreover, Pedersen (2009) reported an absence or very little growth in restocked eels due to low water temperatures and poorly sheltered habitats.
With significant differences in eel response in terms of total length, condition factor and density in the surveys observed between recipient
Fig. 5. Results of the principal component analysis (PCA): (a) explanatory variables and (b) rivers. Length and direction of the vectors define the weights of the variables. Correlation of environmental and eel yield variables with thefirst two axes. Abbreviations: physicochemical parameters: pH, n = 70; NH4+
: ammonium (mg L−1, n = 107); CaCO3: calcium carbonate (mg L−1, n = 86); Gh: total hardness (°GH, n = 107); Kh: carbonate hardness (°KH, n = 107); Con: conductivity (μs cm−1, n = 102); NO
3
−: nitrate (mg L−1, n = 99); NO 2
−: nitrite (mg L−1, n = 106); PO4−3: phosphates (mg L−1, n = 105); eel yield parameters: Dr.: density of restocked eels at surveys (number m−2, n = 30); K: condition factor (n = 1079); hydromorphological parameters: Lst: large stone (%, n = 19); bloc (%, n = 19); Cgra: coarse gravel (%, n = 19); pool (%, n = 19); run (%, n = 19); clen: lentic channel (%, n = 19); river width (cm, n = 593); and biotic parameters: spe: species richness (number n = 19), Dtrout: density of brown trout (n = 18). Rivers are A, B, C, D, E and F.
rivers, our results support the hypothesis that the sampled rivers are sufficiently different typologically to observe a diversity of biological re-sponses (hypothesis 1). This suggests that eel rere-sponses from restocking can differ significantly depending on the environmental conditions of aquatic habitats. The absence of a significant effect of a river on annual growth rates may simply be the result of overly small sample sizes of in-dividuals tagged and recaptured. Through the best growth performance (strong link between eel length and weight, larger eels, positive allome-tric growth) and the best density (mean density, eight individuals per 100 m2) of the restocked eels observed in river A, there is no doubt
that the eel growth conditions were particularly suitable in this river, suggesting the presence of the most appropriate habitats to implement the most effective eel restocking operations. The density was also high
in river F, linked to the good quality of habitats providing effective pro-tection through excellent eel shelters in a site adjacent to the glass eel release site, which was surveyed during two consecutive years, but its oligotrophic alkaline waters could explain the lower length of eels each year compared to those of other rivers. The condition factor as a well-established parameter infishery management is greatly influenced by the individual's or the species' body shape (Froese, 2006;Treer et al., 2009). Within a species, K is lower in elongated individuals than in deep-bodied individuals and also reveals individual growth and feeding intensity. The observed condition factors of the restocked eels (mean K = 0.15) in the six rivers appeared to be consistent with the body shape of the species, meaning that the restocked eels were healthy. The eels examined were juveniles aged 0+to 2+. At 2+(3 years old), they
belonged to the stages I and II of resident eels, the growth phase of the species, according to eel staging protocol (Durif et al., 2005). The condition factor assessing an individual's overweight status in eels in-creases with age and developmental stage and is particularly high in older eels (K = 0.16–0.22) that have completed their growth phase (van Ginneken et al., 2007).Silm et al. (2017)reported in an Estonian lake a mean K of 0.19 in eels with a mean age of 8 years. By contrast, the highest condition factors of the eels observed in river D at age 0+
(K values, mean = 1.23; range = 0.42–2.63; n = 19) could be linked to the presence of prey in the eel stomach that have been recently ingested. This could again explain the weakest relationship between total length and weight as well as the lowest allometric coefficient in this group of eels. Indeed, during theirfirst two continental years, eels often show faster growth than in subsequent years (Simon, 2007) and more rapid growth requires an abundant food supply both day and night. In this study, the variables conductivity and total hardness had higher explanatory power and were strongly associated with an in-crease in eel density at survey and with the best river A, as is typical for these favourable conditions with an associatedfitness performance. In addition, increased eel density was highly correlated with increased pool and large stones, which were most abundant in A, where the den-sity of brown trout as a potential predator species of eels was lower. Thesefindings support the hypotheses that eel yields are positively af-fected by aquatic ecosystem conditions providing more favourable eel living environments, revealed through better growth, higher protection and good settlement (hypothesis 2), as well as that increased eel pro-duction is correlated with a decrease in density of predator species (hy-pothesis 3). Thus, the environmental factors described in the best river (A) should be regarded as the most favourable conditions for eel growth and settlement in inland freshwaters. This suggests that restocking op-erations should preferably be conducted in river A-type ecological models, even if the other rivers should not be considered bad, but merely less adequate. River A's abiotic characteristics like physicochem-ical (high conductivity and total hardness), hydromorphologphysicochem-ical (great roughness of riverbed substrate, abundant lentic habitat) and trophic (eutrophic environment) criteria as well as biotic (less predator spe-cies) characteristics as optimal conditions for the growth and settle-ment of eels should be carefully considered during the selection of upland recipient rivers for glass eel restocking practices. The observed link between river width and eel density, although weak, raises interest in experimenting on larger inland rivers, which may have important growing areas for eels, especially when the above-mentioned character-istics are fulfilled. Such characteristics provide optimal living conditions like greater protection against currents and predators through better eel burrowing and abundant food resources for this cryptic species, which exhibits a highly sedentary lifestyle (Cucherousset et al., 2010;Ovidio et al., 2015;Nzau Matondo et al., 2019;Félix et al., 2020a, 2020b). River A (Berwinne) is an eutrophic alkaline freshwater body with high riverbed roughness (large stones and blocks predominating) and a di-versified flow facies with dominant pools and riffles, which are factors favourable to greater eel density and species diversity of aquatic fauna due to higher primary production (Keithan and Lowe, 1985;Boulenger et al., 2014).
Fig. 6. Species richness according to rivers and age of restocked eels (a) and density of potential predators according to age of restocked eels (b). Sympatric species are: (1) Barbel Barbus barbus, (2) bullhead Cottus rhenanus, (3) chub Squalius cephalus, (4) stickleback Gasterosteus aculeatus, (5) Prussian carp Carassius gibelio, (6) gudgeon Gobio gobio, (7) lamprey Lampetra planeri, (8) loach Barbatula barbatula, (9) grayling Thymallus thymallus, (10) perch Percafluviatilis, (11) catfish Silurus glanis, (12) brown trout Salmo trutta, (13) minnow Phoxinus phoxinus, (14) roach Rutilus rutilus, (15) crayfish Astacus pacifastacus, (16) carp Cyprinus carpio, (17) eel Anguilla anguilla and (18) spined loach Cobitis taenia. Rivers are A, B, C, D, E and F. Age of restocked eels: 0+
; 1+; and 2+. n means total number of species. List of numbers in brackets represents the composition of species. n m−1indicates density expressed as number offish per metre.
Given the lack of decrease in species richness over a 3-year study in the six recipient rivers, we can therefore consider that translocated eels are capable of living with several species of aquatic fauna and even in sympatry with predators. This is consistent with a recent study based on restocking experiments in a Portuguese river, which found no signif-icant changes infish assemblages in restocked areas and no disruption to the local ecological status (Félix et al., 2020a). However, with the highest eel yield coinciding with the lowest brown trout density ob-served in river A as well as the smallest size of eels matching with the highest brown trout density, it is highly likely that interspecific compe-tition between restocked eels and brown trout can occur. The salmonid fish that co-occur with eels feed on the same types of prey and therefore can compete with eels for space (exclusion) and food (prey competi-tion) resources, with negative interactions (predacompeti-tion) in rivers with a higher abundance of brown trout (Bridcut and Giller, 1995;Vignes, 1995; Bardonnet and Baglinière, 2000; Heggenes and Wollebæk, 2013;Boulenger et al., 2014). Increased competition usually leads to both decreased growth and increased susceptibility to negative interac-tions and therefore to lower eel yields through higher mortality (Bevacqua et al., 2011;Drouineau et al., 2015). Resident eels have been observed in some rivers where they were easily identified with no doubts during thefirst electrofishing campaign by their size, but they were completely disappeared over time during the last electro fish-ing campaigns. There is also the possible presence of a few natural recruit individuals since a low arrival of large wild eels is yearly re-corded at the entrance of Belgium from the North Sea (Nzau Matondo and Ovidio, 2016, 2018;Belpaire et al., 2020;ICES, 2020). However, this potential bias was minimised by an earlier electrofishing campaign performed six months after restocking, in which restocked and resident individual eels were tagged and monitored by telemetry. The highest number of resident eels observed in rivers A and F can be related to the previous restocking carried out in 2013 for F and in 2014 for A where 1.5 kg (n = 6232) and 0.4 kg (n = 2185) of glass eels were re-leased respectively in F and A in locations far from the study sites (Belpaire et al., 2020).
5. Conclusion
The abiotic and biotic characteristics of recipient rivers can play a key role in the management of eel stocks through a well-implemented restocking programme. This should give priority to the selection of riv-ers with characteristics associated with those of the high-yielding eel river defined above. Due to the need for deep knowledge of eels' pferred habitats, habitat restoration actions are rarely implemented to re-store eel stocks (Feunteun, 2002;Laffaille et al., 2003;Nzau Matondo et al., 2019). Increasing the roughness of riverbeds by large balanced in-puts of large stones and blocks should increase the availability of suitable shelters and therefore increase eel yields. The Norwegian expe-rience of improving the water quality of acidified rivers by means of well-designed liming associated with the reduction of acidifying pollut-ant emissions may help us increase the abundance of restocked eels in slightly acidified rivers like rivers D and E due to the positive impacts of liming on food availability andfish biodiversity (Larsen Bjørn et al., 2015). These impacts might be very beneficial for this species, which ex-hibits ontogenetic trophic niche shifts, as young eels mainly feed on amphiphodes, insect larvae and snails while adult specimens are princi-pally piscivorous (Jellyman, 1989;Fjellheim and Raddum, 2001;Larsen Bjørn et al., 2015). Although scientific monitoring is hard to carry out in (very) large rivers, the positive relationship between river width and eel density identified in this study suggests that such water bodies can be important growing areas for this endangered species when riverbed substrates are very rough. Studies should be oriented towards the use of such (very) large aquatic environments where regular monitoring offish passes can be integrated as a tool to assess restocking success. The good eel growth performances observed in this study may also sug-gest that restocked eels in rivers are capable of attaining body lengths
similar to those of naturally recruited eels, of storing enough lipid re-sources, of successfully silvering and maturing and of completing their downstream migration to spawning grounds in the Sargasso Sea. However, considering the existence of several migration obstructions such as dams, weirs and hydropower stations in the Meuse River from Belgium to the North Sea, these results should be accompanied by the improvement/creation of safe migration routes for both the seaward migrant spawners and the future upward migrant offspring (Verbiest et al., 2012;Nzau Matondo et al., 2017;Nzau Matondo and Ovidio, 2016, 2018). Our results suggest the use of restocking practice as a man-agement tool to achieve eel conservation goals. Investigations are still ongoing to assess the quality of the restocked eels produced in terms of movement and migration, sex ratio and concentration of lipids and pollutants as well as parasite and virus loads, with thefirst results show-ing very encouragshow-ing signals (Nzau Matondo et al., 2019, 2020;Delrez et al., 2021).
Funding
This research was funded by the‘Definition of the scientific and tech-nical bases for an optimisation and evaluation of the efficiency of European glass eel (Anguilla anguilla) restocking practices’ project fi-nancially supported by the European Maritime Affairs and Fisheries Fund and the Wallonia Public Service, grant number FEAMP No. 44-1604-008.
CRediT authorship contribution statement
M.O., B.N.M. and X.R. designed research, analysed data's and wrote the paper. J.P.B. contributed to thefigure realization and D·C, L.B, V.R.M.R. participated to data encoding; all authors participated to data collection in thefield.
Declaration of competing interest
The authors declare no competingfinancial interest or personal rela-tionships that could influence the work reported in this paper. Acknowledgement
The authors sincerely thank the Editor in Chief, the Associate Editor Jan Vymazal and anonymous reviewers, whose valuable comments have helped to improve the quality of this manuscript. They also ac-knowledge support from the Contrat Rivière Meuse Aval, the Contrat Rivière Vesdre and the DGO3 (Public Service of Wallonia) during elec-trofishing sessions.
References
Acou, A., Rivot, E., Van Gils, J.A., Legault, A., Ysnel, F., Feunteun, E., 2011.Habitat carrying capacity is reached for the European eel in a small coastal catchment: evidence and implications for managing eel stocks. Freshw. Biol. 56, 952–968.
Almer, B., Dickson, W., Ekström, C., 1974.Effect of acidification on Swedish lakes. Ambio 3, 30–36.
Baras, E., Philippart, J.C., Salmon, B., 1996. Estimation of migrant yellow eels stock in large rivers through the survey offish passes: A preliminary in the River Meuse (Belgium), in: I.G. Cowx (Ed.), Stock Assessment in Inland Fisheries, Oxford Fishing News Books (Blackwell), London, UK, pp. 314–325.
Baras, E., Jeandrain, D., Serouge, B., Philippart, J.C., 1998. Seasonal variations in time and space utilization by radio-tagged yellow eels Anguilla anguilla (L.) in A Small Stream. Hydrobiologia 371/372,187–198.
Bardonnet, A., Baglinière, J.-L., 2000. Freshwater habitat of Atlantic salmon (Salmo salar). Can. J. Fish. Aquat. Sci. 57, 497–506.
Belpaire ,C., Breine, J., Van Wichelen, J., Pauwels, I., Baeyens, R., Coeck, J., Nzau Matondo, B., Ovidio, M., Verhelst, P., Adrianes, D., Teunen, L., Bervoerts, L., Sonny, D., Rollin, X., Dumonceau, F. 2020. Report on the Eel Stock, Fishery and Other Impacts in Belgium 2019–2020, 496p.
Belpaire, C.G.J., Goemans, G., Geeraerts, C., Quataert, P., Parmentier, K., Hagel, P., De Boer, J., 2009.Decreasing eel stocks: survival of the fattest? Ecol. Freshw. Fish 18, 197–214.
Bevacqua, D., Melià, P., de Leo, G.A., Gatto, M., 2011.Intra-specific scaling of natural mor-tality infish: the paradigmatic case of the European eel. Popul. Ecol. 165, 333–339.
Bisgaard, J., Pedersen, M.I., 1991.Mortality and growth of wild and introduced cultured eels Anguilla anguilla (L.) in a Danish stream, with special reference to a new tagging technique. Dana 9, 57–69.
Boulenger, C., Crivelli, A.J., Charrier, F., Roussel, J.M., Feunteun, E., Acou, A., 2014. Differ-ence in factors explaining growth rate variability in European eel subpopulations: the possible role of habitat carrying capacity. Ecol. Freshw. Fish 25 (2), 281–294.
https://doi.org/10.1111/eff.12209S.
Brämick, U., Fladung, E., Simon, J., 2016.Stocking is essential to meet the silver eel escape-ment target in a river system with currently low natural recruitescape-ment. ICES J. Mar. Sci. 73, 91–100.
Bridcut, E.E., Giller, P.S., 1995.Diet variability and foraging strategies in brown trout (Salmo trutta): an analysis from subpopulations to individuals. Can. J. Fish. Aquat. Sci. 52, 2543–2552.
Council of the European Communities, 2007.Council regulation (EC) no 1100/207 of 18 September 2007 establishing measures for the recovery of the stock of European eel. Off. J. Eur. Union L248, 17–23.
Cucherousset, J., Britton, J.R., Beaumont, W.R.C., Nyqvist, M., Sievers, K., Gozlan, R.E., 2010.
Determining the effects of species, environmental conditions and tracking method on the detection efficiency of portable PIT telemetry. J. Fish Biol. 7, 1039–1045.
Daverat, F., Limburg, K.E., Thibault, I., Shiao, J.C., Dodson, J.J., Caron, F., Tzeng, W.N., Iizuka, Y., Wickström, H., 2006.Phenotypic plasticity of habitat use by three temperate eel species, Anguilla anguilla, A. japonica and A. rostrata. Mar. Ecol. Prog. Ser. 308, 231–241.
Daverat, F., Beaulaton, L., Poole, R., Lambert, P., Wickström, H., Andersson, J., Aprahamian, M., Hizem, B., Elie, P., Yalҫin-Özdilek, S., Gumus, A., 2012.One century of eel growth: changes and implications. Ecol. Freshw. Fish 21, 325–336.
Dekker,W., 2019. The history of commercialfisheries for European commenced only a century ago. Fish. Manag. Ecol. 2019, 26, 6–19.
Delrez, N., Zhang, H., Lieffrig, F., Mélard, C., Farnir, F., Boutier, M., Donohoe, O., Vanderplasschen, A., 2021. European eel restocking programs based on wild-caught glass eels: feasibility of quarantine stage compatible with implementation of prophylactic measures prior to scheduled reintroduction to the wild. J. Nat. Conserv. 59 (2021) 125933.
Desprez, M., Crivelli, A.J., Lebel, I., Massez, G., Gimenez, O., 2013.Demographic assessment of a stocking experiment in European eels. Ecol. Freshw. Fish 22, 412–420.
Dinno, A., 2017. Dunn's Test of Multiple Comparisons Using Rank Sums. Available online:.
https://cran.r-project.org/web/packages/dunn.test/dunn.test.pdf. (Accessed 14 Janu-ary 2020).
Drouineau, H., Rigaud, C., Laharanne, A., Fabre, R., Alric, A., Baran, P., 2015.Assessing the efficiency of an elver ladder using a multi-state mark-recapture model. River Res. Appl. 31, 291–300.
Drouineau, H., Durif, C., Castonguay, M., Mateo, M., Rochard, E., Verreault, G., Yokouchi, K., Lambert, P., 2018. Freshwater eels: a symbol of the effects of global change. Fish Fish. 2018; 00:1–28.
Durif, C., Dufour, S., Elie, P., 2005.The silvering process of Anguilla anguilla: a new classi-fication from the yellow resident to the silver migrating stage. J. Fish Biol. 66, 1025–1043.
Elie, P., Lecomte-Finiger, R., Cantrelle, I., Charlon, N., 1982.Définition des limites des dif-férents stades pigmentaires durant la phase civelle d’Anguilla anguilla (L.). Vie Milieu 32 (3), 149–157.
Félix, P.M., Costa, J.L., Monteiro, R., Castro, N., Quintella, B.R., Almeida, P.R., Domingos, I., 2020a.Can a restocking event with European (glass) eels cause early changes in local biological communities and its ecological status? Glob. Ecol. Conserv. 21, e00884.
Félix, P.M., Costa, J.L., Quintella, B.R., Almeida, P.R., Monteiro, R., Santos, J., Portela, T., Domingos, I., 2020b. Early settlement and growth of stocked European glass eels in a fragmented watercourse. Fish. Manag. Ecol. 28 (1), 91–100.https://doi.org/ 10.1111/fme.12461.
Feunteun, E., 2002.Management and restoration of European eel population (Anguilla an-guilla): an impossible bargain. Ecol. Eng. 18, 575–591.
Fjellheim, A., Raddum, G.G., 2001.Acidification and liming of River Vikedal, western Norway. A 20 year study of responses in the benthic invertebrate fauna. Water Air Soil Pollut. 130, 1379–1384.
Fox, J., 2017. Using the R Commander: A Point-and-Click Interface for R. Chapman and CRC Press, Boca Raton, FL, USA Available online.http://socserv.mcmaster.ca/jfox/ Books/RCommander/. (Accessed 14 January 2020).
Friedland, K.D., Miller, M.J., Knights, B., 2007.Oceanic changes in the Sargasso Sea and de-clines in recruitment of the European eel. ICES J. Mar. Sci. 64, 519–530.
Froese, R., 2006.Cube law, condition factor and weight–length relationships: history, meta-analysis and recommendations. J. Appl. Ichthyol. 22, 241–253.
Gualtieri, M., Mecatti, M., Diodato, F., 2006.Growth of European catfish (Silurus glanis L.) in Florence province (Central Italy) and management proposals. Freshw. Biol. 34, 287–291.
Guillerault, N., Bouletreau, S., Iribar, A., Valentini, A., Santoul, F., 2017.Application of DNA metabarcoding on faeces to identify European catfish Silurus glanis diet. J. Fish Biol. 90, 2214–2219.
Heggenes, J., Wollebæk, J., 2013. Habitat Use and Selection by Brown Trout in Streams. In: Maddock, I., Harby, A., Kemp, P. & Wood, P.J., eds. Ecohydraulics, Chichester, UK: John Wiley & Sons, Ltd, pp. 157–176.
Huet, M., 1949.Aperçu de la relation entre la pente et les populations piscicoles des eaux courantes. Schweiz. Z. Hydrol. 11, 332–351.
ICES, 2019. Joint EIFAAC/ICES/GFCM Working Group on Eels (WGEEL); ICES Scientific Re-ports: Copenhagen, Denmark, 177p.
ICES, 2020. Joint EIFAAC/ICES/GFCM Working Group on Eels (WGEEL); ICES Scientific Re-ports: Copenhagen, Denmark, 223p.
Itakura, H., Miyake, Y., Kitagawa, T., Kimura, S., 2017.Sitefidelity, diel and seasonal activ-ities of yellow-phase Japanese eels (Anguilla japonica) in a freshwater habitat as in-ferred from acoustic telemetry. Ecol. Freshw. Fish 27, 737–751.
Jacoby, D., Gollock, M., 2014. Anguilla anguilla. The IUCNRed List of Threatened Species. Version 2014.2. 2014. Available online:www.iucnredlist.org(accessed May 28, 2013).
Jellyman, D.J.J., 1989.Diet of two species of freshwater eel (Anguilla spp.) in Lake Pounui, New Zealand. N. Z. J. Mar. Freshwater Res. 23, 1–10.
Keithan, E.D., Lowe, R.L., 1985.Primary productivity and spatial structure of phytolithic growth in streams in the Great Smoky Mountains National Park, Tennessee. Hydrobiologia 123, 59–67.
Kullmann, B., Thiel, R., 2018.Bigger is better in eel stocking measures? Comparison of growth performance, body condition, and benefit-cost ratio of simultaneously stocked glass and farmed eels in a brackish fjord. Fish. Res. 205, 132–140.
Kumai, Y., Tsukamoto, K., Kuroki, M., 2020.Growth and habitat use of two anguillid eels, Anguilla marmorata and A. japonica, on Yakushima Island, Japan. Ichthyol. Res. 67, 375–384.
Laffaille, P., Feunteun, E., Baisez, A., Robinet, T., Acou, A., Legault, A., Lek, S., 2003.Spatial organisation of European eel (Anguilla anguilla L.) in a small catchment. Eco. Freshw. Fish 12, 254–264.
Larsen Bjørn, M., Hesthagen, T., Thorstad, E.B., Diserud, O.H., 2015.Increased abundance of European eel (Anguilla anguilla) in acidified Norwegian rivers after liming. Ecol. Freshw. Fish 24, 575–583.
Lasne, E., Acou, A., Vila-Gispert, A., Laffaille, P., 2008.European eel distribution and body condition in a riverfloodplan: effect of longitudinal and lateral connectivity. Ecol. Freshw. Fish 17 (4), 567–576.
Lê, S., Josse, J., Husson, F., 2008.FactoMineR: an R package for multivariate analysis. J. Stat. Softw. 25 (i01).
Malavoi, J.R., 1989.Typologie des faciès d’écoulement ou unités morphodynamiques des cours d’eau à haute énergie. Bull. Fr. Pêche Piscic. 315, 189–210.
Malavoi, J.R., Souchon, Y., 2002. Description standardisée des principaux faciès d’écoulement observables en rivière : clé de détermination qualitative et mesures physiques. Bull. Fr. Pêche Piscic. 365–366, 357–372.
Mazel, V., Charrier, F., Legault, A., Laffaille, P., 2013.Long‐term effects of passive integrated transponder tagging (PIT tags) on the growth of the yellow eel (Anguilla anguilla (Lin-naeus, 1758)). J. Appl. Ichthyol. 29, 906–908.
Moriarty, C., Dekker, W., 1997. Management of the European Eel (Vol.15; C. Moriarty, & W. Dekker, Eds.). Retrieved fromhttp://oar.marine.ie/handle/10793/ 197. Morin, A., Lamoureux, W., Busnarda, J., 1999.Empirical models predicting primary
pro-ductivity from chlorophyll a and water temperature for stream periphyton and lake and ocean phytoplankton. J. N. Am. Benthol. Soc. 18, 299–307.
Nyman, L., 1972.Some effects of temperature on eel (Anguilla) behavior. Insit. Freshw. Res. 52, 90–102.
Nzau Matondo, B., Ovidio, M., 2016.Dynamics of upstream movements of the European eel Anguilla anguilla in an inland area of the river Meuse over the last 20 years. Envi-ron. Biol. Fish 99, 223–235.
Nzau Matondo, B., Ovidio, M., 2018. Decreased stock entering the Belgian Meuse is asso-ciated with the loss of colonisation behaviour in yellow-phase European eels. Aquat. Living Resour. 2018, 31, 7.
Nzau Matondo, B., Benitez, J.P., Dierckx, A., Philippart, J.C., Ovidio, M., 2017.Assessment of the entering stock, migration dynamics andfish pass fidelity of European eel in the Belgian Meuse River. River Res. Appl. 33, 292–301.
Nzau Matondo, B., Séleck, E., Dierckx, A., Benitez, J.-P., Rollin, X., Ovidio, M., 2019.What happens to glass eels after restocking in upland rivers? A long-term study on their dispersal and behavioural traits. Aquat. Conserv. Mar. Freshw. Ecosyst. 29, 374–388.
Nzau Matondo, B.N., Benitez, J.P., Dierckx, A., Rollin, X., Ovidio, M., 2020.An evaluation of restocking practice and demographic stock assessment methods for cryptic juvenile European eel in upland rivers. Sustainability (Switzerland) 12 (3), 1124.
Ovidio, M., Seredynski, A., Philippart, J.C., Nzau Matondo, B., 2013.A bit of quiet between the migrations: the resting life of the European eel during their freshwater growth phase in a small stream. Aquat. Ecol. 47, 291–301.
Ovidio, M., Tarrago-Bès, F., Nzau Matondo, B., 2015.Short-term responses of glass eels transported from UK to small Belgian streams. Ann. Limnol. Int. J. Limnol. 51, 219–226.
Palm, S., Dannewitz, J., Prestegaard, T., Wickstrom, H., 2009.Panmixia in European eel revisited: no genetic difference between maturing adults from southern and north-ern Europe. Heredity 103, 82–89.
Pedersen, M.I., 2000.Long-term survival and growth of stocked eel, Anguilla anguilla (L.), in a small eutrophic lake. Dana 12, 71–76.
Pedersen, M.I., Rasmussen, C.H., 2016.Yield per recruit from stocking two different sizes of eel (Anguilla anguilla) in the brackish Roskilde Fjord. ICES J. Mar. Sci. 73 (1), 158–164.
Philippart, J.C., 2006. L'érosion de la biodiversité: les poissons. Université de Liège, Bel-gique, 306 p.
Philippart, J.C., Ovidio, M., Rimbaud, G., Dierckx, A., Poncin, P., 2010. Bilan des observations sur les populations de l'anguille dans les sous-bassins hydrographiques Meuse aval, Ourthe, Amblève et Vesdre, Commission provinciale de Liège du Fonds piscicole du Service Public de Wallonie, Belgique, 161 p.
Prigge, E., Marohn, L., Hanel, R., 2013.Tracking the migratory success of stocked European eels Anguilla anguilla in the Baltic Sea. J. Fish Biol. 82, 686–699.
R Development Core Team, 2016.R: A Language and Environment for Statistical Comput-ing. R Foundation for Statistical Computing, Vienna, Austria.
Reynolds, C., 2011.The Effect of Acidification on the Survival of American Eel. M.Sc. Dalhousie University, Canada.
Rose, K.A., Cowan, J.H., Winemiller, K.O., Myers, R.A., Hilborn, R., 2001.Compensatory den-sity dependence infish populations: importance, controversy, understanding and prognosis. Fish Fish. 2, 293–327.
Sadler, K., 1979.Effects of temperature on the growth and survival of the European eel, Anguilla anguilla. L. J. Fish Biol. 15, 499–507.
Silm, M., Bernotas, P., Haldna, M., Järvalt, A., Nõges, T., 2017.Age and growth of European eel, Anguilla anguilla (Linnaeus, 1758), in Estonian lakes. J. Appl. Ichthyol. 33, 236–241.
Simon, J., 2007.Age, growth, and condition of European eel (Anguilla anguilla) from six lakes in the river Havel system (Germany). ICES J. Mar. Sci. 64, 1414–1422.
Simon, J., Dörner, H., Scott, R.D., Schreckenbach, K., Knösche, R., 2013.Comparison of growth and condition of European eels stocked as glass and farm sourced eels in lakes in thefirst four years after stocking. J. Appl. Ichthyol. 29, 323–330.
Sinclair, A.R.E., 1989.The regulation of animal populations. In: Cherrett, J.M. (Ed.), Ecolog-ical Concepts: The Contribution of Ecology to an Understanding of the Natural World. Blackwell Scientific Publications, Oxford, pp. 197–241.
Stacey, J.A., Pratt, T.C., Verreault, G., Fox, M.G., 2015.A caution for conservation stocking as an approach for recovering Atlantic eels. Aquat. Conserv. Mar. Freshw. Ecosyst. 25, 569–580.
Tesch, F.W., Thorpe, J.E., 2003. The Eel, 3rd ed.; Blackwell Science: Oxford, UK. Treer, T., Piria, M., Sprem, N., 2009.The relationship between condition and form factors
of freshwaterfishes of Croatia. J. Appl. Ichthyol. 25, 608–610.
van den Thillart, G., van Ginneken, V., Körner, F., Heijmans, R., van der Linden, R., Gluvers, A., 2004.Endurance swimming of European eel. J. Fish Biol. 65, 1–7.
van Ginneken, V.J.T., Maes, G.E., 2005.The European eel (Anguilla anguilla, Linnaeus), its lifecycle, evolution and reproduction: a literature review. Rev. Fish Biol. Fish. 15, 367–398.
van Ginneken, V., Durif, C., Balm, S.P., Boot, R., Verstegen, M.W.A., Antonissen, E., van den Thillart, G., 2007.Silvering of European eel (Anguilla anguilla L.): Seasonal changes of morphological and metabolic parameters. Anim. Biol. 57 (1), 63–77.
Verbiest, H., Breukelaar, A., Ovidio, M., Philippart, J.-C., Belpaire, C., 2012.Escapement suc-cess and patterns of downstream migration of female silver eel Anguilla anguilla in the River Meuse. Ecol. Freshw. Fish 21, 395–403.
Vignes, J.C., 1995.L’Alimentation des jeunes Saumons (“Salmo salar” L.) dans une rivière du Pays-Basque, la Nivelle. Munibe Ciencias Naturales. Natur. Zientziak. 47, 97–100.
Vøllestad, L.A., 1992.Geographic variation in age and length at metamorphosis of matur-ing European eel: environmental effects and phenotypic plasticity. Anim. Ecol. 61, 41–48.
Werner, E.E., Gilliam, J.F., 1984.The ontogenetic niche and species interactions in size-structured populations. Annu. Rev. Ecol. Evol. Syst. 15, 393–425.
Whitledge, G.W., Rabeni, C.F., 2000.Benthic community metabolism in three habitats in an Ozark stream. Hydrobiologia 437, 165–170.
Wootton, R.J., 1990.Ecology of Teleost Fishes. Chapman and Hall, London, New York, p. 386.
Wysujack, K., Mehner, T., 2005.Can feeding of European catfish prevent cyprinids from reaching a size refuge? Ecol. Freshw. Fish 14, 87–95.