VALIDATION AND DISCUSSION OF CALUX
ANALYSIS FOR MARINE SAMPLES.
I. Windal1, N. Van Wouwe1, S. Carbonnelle1, I. Van Overmeire1, G. Eppe2, C. Xhrouet2, V. Debacker2, E. De Pauw2, W. Baeyens3, C. Joiris4, L. Goeyens1,3
1
ScientificInstitute of Public Health, rue J. Wytsman, 14,B-1050 Brussels Belgium 2
CART, University of Liege, B6c Sart-Tilman, B-4000 Liege, Belgium 3
ANCH, FreeUniversity of Brussels (VUB), Pleinlaan, 2, B-1050 Brussels, Belgium 4
ETOX, Free University of Brussels (VUB), Pleinlaan, 2, B-1050 Brussels, Belgium
Introduction
The CALUX technique is often presented as a promising screening method for compulsory control of PCDD/F norms in food and feed1,2. CALUX analyses can also be used for the measurement of dioxin-like toxicity in environmental samples, which are not subjected to normative values. For that purpose, severe quality control must be applied to avoid measurement biases. Combination of different clean-up steps can give valuable information on compounds responsible of the dioxin-like toxicity. Moreover, comparison of the CALUX and GC-MS measurements will give additional information.
This paper discusses the validation of the CALUX technique for marine samples. Results obtained for mussels, starfishes and common porpoises are presented and compared with GC-HRMS results.
Materials and methods
A detailed description of the procedure applied for CALUX analysis is given elsewhere3. Briefly, CALUX analyses were performed using the mouse hepatoma H1L6.1 cell line developed by XDS. The fat, dissolved in hexane, was added to an acidic silica column, placed above an activated carbon (X-CARB) column. The sample was eluted with hexane through the 2 columns. The acidic silica column was then removed and the activated carbon column was differentially eluted to yield 2 fractions: one containing the PCB, and the other one containing the PCDD/F. Cells are exposed to the purified extracts for 20-24h before the measurements.
A detailed description of GC-HRMS analyses can be found in Focant et al. 4
Results and discussion
1. Quality control criteria: Three different quality criteria were fixed:
1) Quality control for the 96 wells plates: a solution of 2,3,7,8 TCDD is prepared independently from the calibration solutions and is analyzed in 6 wells. Its concentration is chosen to perform the measurement in the lower linear part of the calibration curve, where measurements of real samples are performed. To check the validity of the calibration curve, the mean of the measurements must be within the actual concentration ± 15%. To check the variability of the measurements, the RSD associated with the 6 measurements has to be lower than 15%.
2) Quality control of the procedural blank: some compounds can poison the cells, and
consequently, lower or suppress the CALUX response. In order to check this, the final extract of
Organohalogen Compounds, Volumes 60-65, Dioxin 2003 Boston, MA Organohalogen Compounds, Volume 60, Pages 215-218 (2003)
the procedural blank is spiked with the standard solution of 2,3,7,8 TCDD used for the quality control of the plates. The CALUX response to the latter mixture (standard solution + procedural blank) can not exceed the range mean ± SD calculated for the standard solution. Responses in excess indicate contamination of the procedural blank with Ah ligands, whereas lower responses indicate that some toxic compounds present in the procedural blank poison the cells. With the procedure here described both toxicity and contamination of the extracts can be detected. 3) Quality control of the measurement: samples are analyzed by series of 13, plus a procedural blank (analyzed as proposed in the former paragraph), a quality control sample (QC) and an additional sample designed for the determination of the percentage recovery. The percentage recovery is used to correct the results. Results of the quality control samples are plotted on a control chart, for which classical criteria are applied.
2. Validation
Quantification limits : the procedure applied here has been used with 0.5 or 1g of fat; the
procedure applied for 1g of fat can be used for amounts up to 1.5g fat. In this case (1.5 g fat), the quantification limit is 1.25 pg TEQ/g fat. If required, bigger acidic silica columns can be used to analyze higher amounts of fat and lower the detection limits.
Results of 6 analyses of cod liver oil performed on the same day and analyzed on the same plate were used for the evaluation of repeatability. Results of analyses performed on different days and analyzed on different plates were used for the evaluation of reproducibility (n=6 or 3 for 0,5 and 1 g fat respectively). All results are summarized in Table 1. Relative standard deviations (RSD) obtained for the dioxin fractions (all data) are far below the 30 % required for the validation of screening methods by the European Community guidelines and are quite close to the RSD of chemical measurements in fat (approximately 10%)5
. RSD values for the PCB fractions are higher, which is probably related to some losses by evaporation during the concentration procedure.
dioxin fraction PCB fraction dioxin + PCB
Mean (pgTEQ/g) RSD (%) Mean (pgTEQ/g) RSD (%) Mean (pgTEQ/g) RSD (%) Repeatability 0.5 g fat (n=6) 20.4 9 8.7 18 29.1 10 Repeatability 1 g fat (n=6) 17.1 14 7 19 24.0 12 Reproducibility 0.5 g fat (n=6) 19.6 10 6.4 15 26.1 6 Reproducibility 1 g fat (n=3) 19.1 9 6.8 4 25.9 6 All data (n=19) 19.1 13 7.3 21 26.4 12
Table 1: results of the validation of CALUX, using cod liver oil as quality control sample.
In our procedure, the amount of extract analyzed is chosen in such a way that the measurements are performed in the lower, linear part of the calibration curve. Thus, whatever the concentration of the samples may be, the measurement always ranges from 0.75 to 3 pg TEQ/well, and the associated RSD is always in the same range.
It’s difficult to evaluate the trueness of CALUX analysis. Chemical analyses of all dioxin-like compounds would be impossible, and TEF values are not available for every Ah ligands. Furthermore, non-additive interaction between compounds would not be taken into account.
Organohalogen Compounds, Volumes 60-65, Dioxin 2003 Boston, MA Organohalogen Compounds, Volume 60, Pages 215-218 (2003)
3. CALUX analyses of marine samples.
CALUX analysis of the dioxin fraction always gives a higher value than chemical analysis of
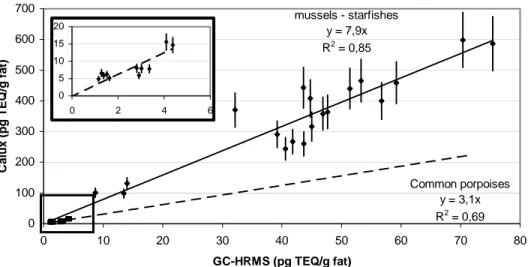
PCDD/F, as shown in Figure 1 for starfishes, mussels and common porpoises of the North Sea. This difference may be related to the observed differences between CALUX-REP and WHO-TEF (reference). However, when CALUX REP are used instead of WHO TEF in the calculation of the GC-HRMS values, the results are very similar. For example, for the cod liver oil used as QC the GC-HRMS values are 5.41 and 5.39 pg TEQ/g fat respectively. Consequently, the difference between CALUX and chemical analysis is probably related to the presence of other dioxin-like compounds6. The ratio between CALUX and GC-HRMS is around 8 for sea stars and mussels, and around 3 for common porpoises. PCDD/F are thus only partly responsible (13-33%) for the observed dioxin-like toxicity.
mussels - starfishes y = 7,9x R2 = 0,85 Common porpoises y = 3,1x R2 = 0,69 0 100 200 300 400 500 600 700 0 10 20 30 40 50 60 70 8 GC-HRMS (pg TEQ/g fat) C a lux ( pg TEQ /g f a t) 0 0 5 10 15 20 0 2 4 6
Figure 1: Comparison of CALUX analyses of the dioxin fraction and GC-HRMS analyses of PCDD/F for different marine matrices. RSD set at 15% for all samples.
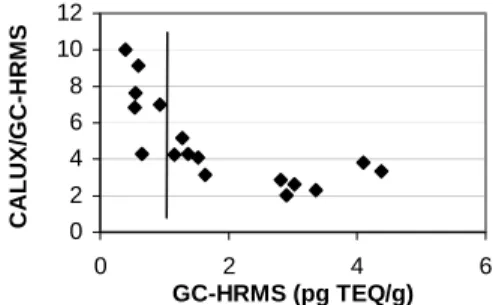
Besides this, special attention must be paid to very low level samples. In GC-HRMS analysis, the PCDD/F TEQ measured is the sum of the concentration, expressed in TEQ, of the different congeners. For low level samples, some, and sometimes most of the congeners are not quantified. If the concentrations of not quantified congeners are set to zero, the calculated “PCDD/F TEQ” is only a part of the “actual PCDD/F TEQ”. This bias of the measurement is not observed in CALUX since all congeners contribute to the response. Consequently, the CALUX to GC-HRMS ratios can dramatically increase as the concentrations decrease and approach the quantification limits of GC-HRMS, as illustrated in Figure 2. For this reason, results < 1 pg TEQ/g in GC-HRMS are not presented in Figure 1. Similar observations for human plasma are described by Van Wouwe et al (this symposium).
CALUX results of the PCB fraction, on the other hand, are lower than GC-HRMS results, by a
factor of 2 to 3 (2.5 for our QC sample). The difference is easily explained by the difference between CALUX-REP and WHO-TEF of PCB 126, respectively 0.03 and 0.1, since PCB 126 is usually responsible for most of the “PCB-TEQ” (78% for the QC sample). Note that the CALUX REP of the other non- and mono-orthos PCB are also much lower than the WHO-TEF.
Organohalogen Compounds, Volumes 60-65, Dioxin 2003 Boston, MA Organohalogen Compounds, Volume 60, Pages 215-218 (2003)
0 2 4 6 8 10 12 0 2 4 GC-HRMS (pg TEQ/g) CA L U X /GC -H R M S 6
Figure 2: CALUX (dioxin fraction) to GC-HRMS (PCDD/F) ratios versus GC-GC-HRMS
for blubber samples of common porpoises
Dioxin+PCB fraction: more information is available when PCB and dioxin are separated and
analyzed in different fractions by CALUX assays. For example, the total TEQ measured by CALUX and GC-HRMS for the QC sample are respectively 26.4 and 23.4 pg TEQ/g fat. These results are very similar, but when results of the dioxin and PCB fractions are considered separately, the conclusions change dramatically.
Conclusions
The RSD obtained with CALUX for repeatability and reproducibility are in the range of 13% for the dioxin fraction and 22% for the PCB fraction. Severe quality controls are applied to avoid bias of the measurement due to contamination, toxicity of the extract or change of the quality of the measurement by the cells. The closeness of results between CALUX and GC-HRMS will greatly depend of the ratio of the different dioxin-like compounds present in the sample, and of the type of sample analyzed. The separation between PCB and dioxins during the clean-up applied in CALUX provides more information on dioxin-like toxicity than the analysis of the total TEQ (PCB+ dioxins). For low level samples, the detection limits of GC-HRMS are also an important factor since undetected compounds do not contribute to the total TEQ calculation.
Significant differences between CALUX and GC-HRMS results for dioxin and PCB fractions highlight an urgent need for a better knowledge of the Ah receptor agonists. The more threatening contaminants might not be the 17 congeners of PCDD/F traditionally analyzed, but rather a cocktail of contaminants that is still insufficiently identified.
Acknowledgements
This research was supported by the « Services fédéraux des affaires scientifiques, techniques et culturelles (SSTC) » contract N° MN/12/95.
References
1. Bovee, T.F.H., Hoogenboom, L.A.P., Hamers, A.R.M., Traag, W.A., Zuidema, T., Aarts, J.M.M.J.G., Brouwer, A., and Kuipert, H.A. (1998) Food additives and contaminants 15, 863. 2. Van Overmeire, I., Carbonnelle, S., Van Loco, J., Roos, P., Brown, D.J., Chu, M., Clark, G.C.,
and Goeyens, L. (2002) Organohalogen compounds 58, 353.
3. Brown, D.J., Van Overmeire, I., Goeyens, L., Chu, M.D., Denison, M.S., and Clark, G.C. (2002) Organohalogen compounds 58, 401.
4. Focant, J.-F., Eppe, G., Pirard, C., De Pauw, E., (2001) J. Chrom A, 925, 207 5. Eppe, G. and De Pauw, E. (2002) Organohalogen compounds 59, 404.
6. Behnisch, P.A., Hosoe, K., and Sakai, S. (2001) Environment International, 27, 495
Organohalogen Compounds, Volumes 60-65, Dioxin 2003 Boston, MA Organohalogen Compounds, Volume 60, Pages 215-218 (2003)