Dependence of phase morphology and mechanical properties of PS/SBR/PE
ternary blends on composition: transition from core–shell to triple-phase
continuity structures
I. Luzinov, C. Pagnoulle and R. Jérôme
Center for Education and Research on Macromolecules (CERM), University of Liège, Institute of Chemistry, B6, Sart-Tilman, 4000 Liège, Belgium
Abstract
The weight ratio of PE and PS in ternary PS/SBR/PE blends has been changed at constant SBR content (25 wt%). When the matrix is either PE or PS, the dispersed phase has a core–shell structure with SBR forming the shell. The size of the core expectedly increases with the content of the core-forming polymer. In some composition range, the three phases are simultaneously continuous, SBR being localized in between the co-continuous PE and PS phases. The ultimate mechanical properties of the ternary blends containing SBR/PE and SBR/PS core–shell dispersed phases are close to the properties of the PS/SBR and PE/SBR binary blends, respectively. Some synergism in the elongation at break of the ternary blends is observed when core–shell SBR/PS phases are dispersed in PE matrix.
Keywords: Ternary polymer blends; Core–shell morphology
1. Introduction
Although polymer blends have been studied very extensively in the recent past [1-2], most attention has been paid to binary blends uncompatibilized and compatibilized by suitable interfacial agents. Recently, three-phase ternary blends have received some attention [3-8], the purpose being to launch new materials on the market place and to evaluate whether multicomponent plastic wastes are worth being recycled.
Needless to say that phase morphology of immiscible ternary blends is basically controlled by thermodynamics [3,6-8]. One possible three-phase morphology consists of dispersion of core–shell binary phases in the matrix formed by the third component. The opportunity for one phase to separate the two other ones can be estimated from Eq. (1), which is an alternative form of the Harkin's equation [3]:
λCA=γAB−γBC−γAC
C
where γAB, γBC and γAC are the interfacial tensions for each component pair. When the λCA spreading coefficient is
positive, phases A and B are separated by the phase C. If this condition is fulfilled, and A and C or B and C are minor phases, then the dispersed phase has a core–shell morphology, with component C forming an
encapsulating shell around small domains of component A or B [3-6]. This type of phase morphology has a direct influence on the mechanical properties of the ternary blend, such as impact and ultimate tensile strength, modulus and elongation at break [9-11].
A previous paper from this laboratory has focused on the morphology and mechanical properties of ternary polystyrene/styrene–butadiene rubber/polyethylene (PS/SBR/PE) blends [12]. The range of compositions investigated was such that the content of the major phase (PS) was kept constant, in contrast to the ratio of the two minor (PE and SBR) components that was changed. The interfacial tensions and spreading coefficients calculated by Eq. (1) for this type of ternary blend are listed in Table 1. In agreement with positive λSBR/PE (Table
1), dispersed phases consisting of PE particles encapsulated by SBR were observed. The size and intimate structure of the dispersed phases were controlled by the weight ratio of the two components SBR and PE. Expectedly, the ultimate mechanical properties of these ternary blends also depended on this composition. This paper aims at extending this preliminary study to PS/SBR/PE blends in which the content of SBR, which is systematically localized in between PS and PE phases, is kept constant (25 wt%) and the PE/PS ratio is changed. Attention will be paid to the phase morphology and its effect on the mechanical properties.
Table 1. Interfacial tensions and spreading coefficients at 200°C
2. Experimental 2.1. Materials
All the blends in this study contained 25 wt% SBR, (Cariflex, S1013 from Shell; 42.7 wt% bound styrene). The other two components were PS (Polystyrol 158K from BASF) and high density polyethylene (Eltex K44-20 from Solvay). Representative properties of these constitutive polymers are listed in Table 2.
Table 2. Main characteristics of the polymers used in this study
Blends were prepared within a Brabender internal mixer under dry nitrogen at 200°C. The constitutive polymers were firstly dry-blended and then melted at 200°C for 2 min in the Brabender chamber at 20 rpm and finally mixed for 10 min at 55 rpm (one-step mixing). In order to avoid the oxidation of the components, 0.4 wt% antioxidant (Irganox 1010 Ciba Geigy) was used. The volume of the mixing chamber was 50 ml.
2.3. Rheological analysis
Dynamic mechanical properties were measured at 200°C with an ARES mechanical spectrometer from Rheometrics. The experiments were carried out in the dynamic mode with the parallel plate geometry (gap of 1 mm and strain of 1%).
2.4. TEM and image analysis
Phase morphology was observed with a Philips CM 100 transmission electron microscope. A Reichert Jung Ultracut FC 4 ultramicrotome cooled at −100°C and equipped with a diamond knife was used to prepare the ultrathin sections (70–90 nm thick) from plates molded for mechanical testing. These sections were stained by vapors of osmium tetroxide (30 min) and ruthenium tetroxide (2 h), respectively. From the analysis of binary PS/PE and PS/SBR blends stained by this technique, PS was observed as a dark gray phase, SBR as a black phase, and PE as a light gray phase. In some cases, only the SBR phase was stained by osmium tetroxide. Size of PE and PS cores was analyzed by using the KS-100 (Kontron Imaging System) software. The apparent number (dn) and volume (dv) average diameters of these dispersed phases were calculated from the analysis of
several areas of the same sample and more than 150 phases particles per scanned area. Because of the non-spherical shape of the dispersed phases, the apparent diameters were not converted into absolute values [13]. 2.5. Mechanical properties
Tensile and impact test specimens were machined from molded sheets, previously compression molded at 200°C under 20 MPa for 5 min and then quenched under low pressure.
Stress–strain curves were recorded at room temperature with an Instron tester (model DY24; 20 mm min−1 tensile speed). The specimens were prepared according to the DIN 53488 standard. The Charpy impact strength was measured at room temperature with a CEAST Fractoscope using notched specimens DIN 53453 (0.3 mm notch). Each tensile or impact value was the average of four to eight independent measurements.
3. Results and discussion 3.1. Morphology
Fig. 1a shows how the dynamic viscosity of the polymers used in this study depends on the frequency. PE has the highest viscosity in the whole range of shear rates, the viscosity of PS being in between the viscosity of the other two components. It is worth noting that at 100 rad s−1, i.e. at shear rate close to that one calculated for the Brabender mixing chamber (185 s−1) [14], PS and SBR have quite a comparable viscosity (4.4×10² Pa s for PS and 3.2×10² Pa s for SBR), which is smaller than the viscosity of PE (9.6×10² Pa s).
Fig. 1. Dynamic viscosity (a) and storage modulus (b) versus shear rate for PE (•), PS ( ) and SBR (▪). Fig. 1b shows the shear rate dependence of the storage modulus (G′) for the three polymers. In the range 6– 1 rad s−1, the moduli crossover, and G′ of SBR which was the highest becomes the smallest. At 100 rad s−1, PS and SBR have again a comparable elasticity (7.7×10⁵ Pa and 6.5×10⁵ Pa, respectively) smaller than PE (12.2×10⁵ Pa).
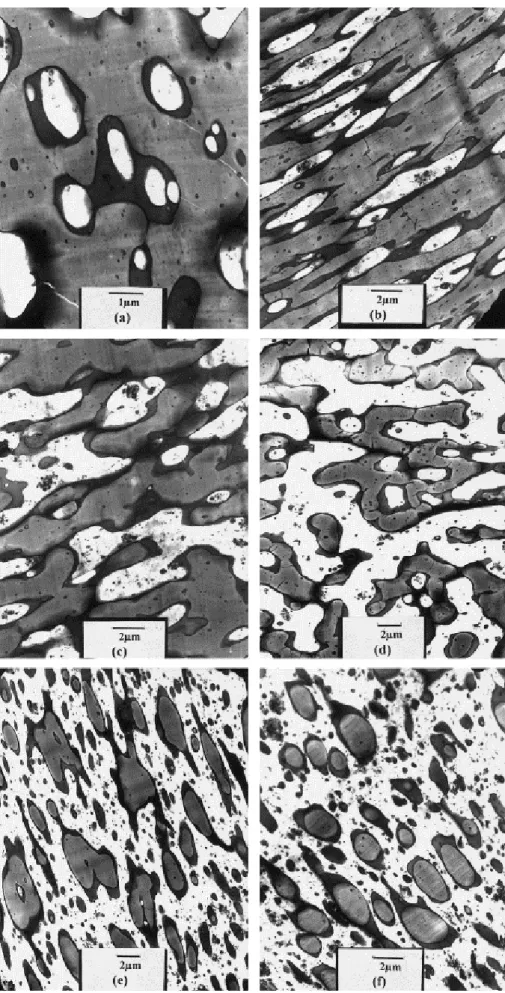
Fig. 2 illustrates how the phase morphology of the PS/SBR/PE ternary blends depends on the PE/PS wt% ratio at constant SBR content. Different three-phase morphologies are observed depending on this ratio. At low PE (or PS) content (Fig. 2a and f), PE (or PS) is encapsulated by an SBR shell and dispersed in the PS (or PE) matrix. When the PE (or PS) content is increased ( Fig. 2b and e), the particles formed by this component are much larger and much irregularly shaped but still coated by an SBR layer. At PE/PS weight ratios of 40/60 ( Fig. 2c), (50/50) ( Fig. 2d) and 60/40 (not shown here), three co-continuous phases are formed, SBR tending to localize itself at the boundary between the PE and PS phases. In addition to co-continuous phases, PE and PS particles enveloped by SBR also coexist. Thus, the core–shell morphology for the minor phase is observed at quite different PE/PS weight ratios, i.e. independent of the thermoplastic that forms the matrix, either the more viscous and elastic PE or the less viscous and elastic PS. The observation of a co-continuity region (triple-phase
Fig. 2. TEM micrographs for PS/SBR/PE blends of different PE/PS composition (wt%): (a) 20/80; (b) 30/70; (c) 40/60; (d) 50/50; (e) 70/30; and (f) 80/20.
It must be noted, that at low PE content, more than one PE particle is usually observed in the SBR domains (Fig. 2a), which is not a dominant observation, when PE is the matrix and PS the minor phase ( Fig. 2f). The reason for this difference could be found in the coalescence of the dispersed phase during the compression molding step. Indeed, it was recently shown [6] that the first step of the coalescence of the core–shell domains would be the approach and overlap of the encapsulating layer, thus leading to a "multicore" structure. The rate of coalescence is expected to increase in the case of a less viscous matrix [15]. Therefore, multicore dispersed phases should be formed more rapidly when PS of lower viscosity is the matrix, as it is actually observed. Fig. 3 shows how the average size of the PE (or PS) core depends on the PE/PS weight ratio in the core–shell regime. This size increases with the content of the core-forming polymer (PS or PE) as it would be expected. Actually dn increases from 0.65 to 1.74 µm, and from 0.8 to 1.9 µm for PE and PS particles, respectively. In
parallel, dv goes up from 1.4 to 3.3 µm for the PE domains and from 1.5 to 3.9 for the PS ones. Although the size
of the PS cores is systematically higher compared to the PE domains, the difference is however small. As a rule, the average size of the minor phase in polyblends is controlled by several parameters, including: interfacial tension, torque or viscosity ratio (of the dispersed phase with respect to the matrix) and elasticity ratio. It is generally accepted that the size of the minor phase in binary blends decreases with decreasing interfacial tension, torque ratio (down to ca. 0.25) and elasticity of the dispersed phase [14,16-18]. In the particular case of ternary blends with core–shell dispersed phases, the core-size might be assumed to be affected by the torque ratio of the core-forming polymer with respect to the shell precursor. The torque ratio between the matrix and the shell would then act on the average size of the dispersed phase as a whole. The matrix/shell and the shell/core interfacial tensions are also expected to affect the final phase morphology. For the system investigated in this study, the torque ratios ( Table 3) allow to predict smaller PS cores as well as SBR domains including these particles. On the basis of the interfacial tensions, the SBR domains should be larger when PE is the matrix, whereas the reverse conclusion should be drawn for the PE cores (Table 1). Actually the final morphology results from the more or less complex interplay of these physical properties for the shell/matrix, the core/shell and, possibly, the core/matrix pairs.
Fig. 3. Effect of the PE/PS weight ratio on the number (▪) and volume ( ) average diameter of the cores in PS/SBR/PE ternary blends.
The core-size distribution is shown in Fig. 4 for different PE/PS weight ratios. The size distribution (dv/dn) does
not significantly change with the blend composition, the log normal distribution being respected in all the cases (Fig. 5).
Fig. 4. PE (a) and PS (b) core-size distribution for the PS/SBR/PE ternary blends of different PE/PS weight ratio: (1) 10/90; (2) 20/80; (3) 30/70; (4) 90/10; (5) 80/20; and (6) 70/30.
Fig. 5. Log normal distribution of PE (a) and PS (b) core for the PS/SBR/PE ternary blends of different PE/PS weight ratios: (1) 10/90; (2) 20/80; (3) 30/70; (4) 90/10; (5) 80/20; and (6) 70/30.
The domain of triple-phase continuity spans from 40/60 to 60/40 PE/PS wt% ratios. Although phase inversion is observed in binary PS/SBR and PE/SBR blends when the content of the (minor) SBR phase is ca. 47.5 wt% (Fig. 6), the PS/SBR/PE ternary blends still exhibit dispersed phase morphology at this SBR/PE or SBR/PS
Fig. 6. TEM micrographs of (a) PS/SBR (52.5/47.5 wt%) and (b) PE/SBR (52.5/47.5 wt%) binary blends. Table 4. Minor phase content and morphology observed
Fig. 7 shows that the torque measured in the mixing chamber at 200°C does not depend on the PE/PS ratio as long as the less viscous PS (Table 2) forms the matrix, i.e. up to ca. 40 wt%. It can be seen, however, that a small amount of PS added to PE/SBR blend considerably decreases the torque. Beyond that composition, the three phases start to be co-continuous and the torque then increases. This evolution is maintained when the more viscous PE forms the matrix and contains decreasing amount of less viscous dispersed phases. The torques of the ternary blends show a negative deviation with respect to the additivity rule, which is typical for binary
immiscible blends [14].
Fig. 7. Dependence of the torque measured in the Brabender chamber at 200° for 8 min of mixing on the PE/PS weight ratio for the PS/SBR/PE ternary blends. Dotted lines are predictions by the additivity rule.
3.2. Mechanical properties
The dependence of the yield strength (which is the ultimate strength for the brittle blends) on the PE/PS ratio for the PS/SBR/PE ternary and the PS/PE binary blends is shown in Fig. 8. The curve characteristic of the ternary blends is shifted downwards compared to the binary blends as result of the addition of the rubbery component (SBR). For the two series of blends, the yield strength shows a negative deviation with respect to the predictions based on the additivity law. Although the PS/PE blends containing up to ca. 60 wt% PE are brittle (no yielding), it is no longer the case when SBR is added. At PE/PS weight ratios of 80% and higher, an extensive plastic deformation followed by strain hardening is observed beyond the yielding point for the two series of blends.
Fig. 8. Dependence of the yield strength on the PE/PS weight ratio for the PS/SBR/PE ( ) and PS/PE (○) blends. Dotted lines are predictions by the additivity rule. Filled symbols refer to brittle failure.
Fig. 9 shows that the elongation at break for the ternary blends is systematically higher than that for the PE/PS binary blends in the whole composition range. Up to ca. 80 wt% PE, all the blends exhibit a negative deviation from the ideal additive behavior, the deviation being however more pronounced for the PS/PE binary blends. At high PE content (>80 wt%), positive deviation is observed for the ternary blends, whereas the elongation at break for the binary blends agree with the mixing rule in this composition range.
Fig. 9. Dependence of the elongation at break on the PE/PS weight ratio for the PS/SBR/PE ( ) and PS /PE (○) blends. Dotted lines are predictions by the additivity rule.
Dependence of the impact strength on the PE/PS ratio has also been investigated (Fig. 10). For the PS/SBR/PE ternary blends, the impact strength increases regularly with the PE content and more rapidly when the phase inversion has occurred. At high PE content, the impact strength becomes so high that it cannot be measured anymore according to the Charpy Impact Testing. For the parent binary blends, the impact strength does not increase significantly up to ca. 80 wt% PE. It is clear that the addition of PE contributes to increase the volume fraction of the dispersed rubbery phase and accordingly to improve the impact properties although the SBR content is maintained unchanged.
In order to emphasize the specific effect of the core–shell morphology of the dispersed phase of the ternary blends, the mechanical properties have been plotted against the content of the minor phase (SBR/PE and SBR/PS) in the cases where PS (Fig. 11 and Fig. 12) and PE (Fig. 13 and Fig. 14) form the matrix, respectively. For the sake of comparison, the properties of the parent binary blends (PS/SBR and PS/PE) have also been included.
Fig. 11. Plots of tensile strength at yield (a) and break (b) versus the minor phase content for the PS-rich PS/SBR/PE ( ), PS/SBR ( ) and PS/PE (●) blends.
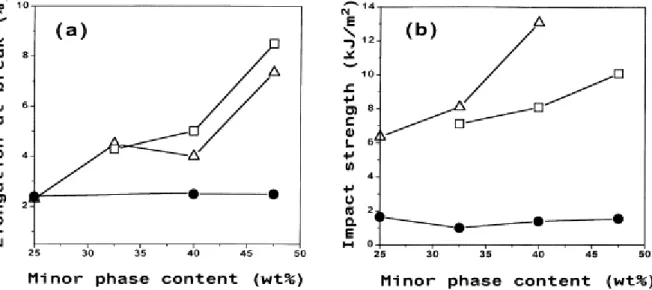
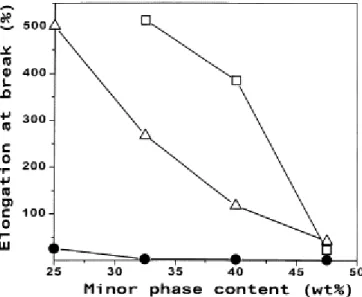
Fig. 12. Plots of the elongation at break (a) and impact strength (b) versus the minor phase content for the PS-rich PS/SBR/PE ( ), PS/SBR ( ) and PS/PE (●) blends.
Fig. 13. Plots of the tensile strength at yield (a) and break (b) versus the minor phase content for the PE-rich PS/SBR/PE ( ), PE/SBR ( ) and PS/PE (●) blends. Filled symbols refer to brittle failure.
Fig. 14. Plot of the elongation at break versus the minor phase content for the PE-rich PS/SBR/PE ( ), PE/SBR ( ) and PS/PE (●) blends.
According to Fig. 11, when PS is the matrix of the ternary blends, the dispersed SBR/PE core–shell domains behave actually as "pure" SBR phase up to ca. 40 wt% of the minor phase. Indeed, the yield strength and ultimate tensile strength are essentially the same for the two series of PS/SBR/PE and PS/SBR blends. The same conclusion basically holds for the elongation at break (Fig. 12a). The impact strength is in contrast
systematically higher for the PS/SBR binary blends ( Fig. 12 b). At minor phase content higher than 40 wt%, the phase inversion occurs in the PS/SBR blends (Fig. 6a and Table 4). Beyond that composition, the yield strength and the ultimate tensile strength of the binary blends are lower compared to the parent ternary blends, in contrast to the elongation at break, which remains comparable in the two series. The most important difference has to be found in the impact strength, which is now much higher for the PS/SBR blends to the point where it cannot be measured anymore. PS/PE binary blends, consisting of PS matrix and PE dispersed phases show mechanical properties completely different from the PS/SBR/PE and PS/SBR blends. From Fig. 11 and Fig. 12, it appears that the substitution of SBR/PE core–shell domains for neat PE dispersed phases results in decreased ultimate tensile strength and increased elongation at break and impact strength.
When PE is the matrix (Fig. 13 and Fig. 14), the superiority of the PS/SBR/PE ternary blends over the binary PE/SBR counterpart, is obvious at least up to ca. 45 wt% of the minor phase. Indeed, when the dispersed phases have a core–shell structure rather than being SBR, the elongation at break dramatically increases (Fig. 14), whereas the yield strength and the ultimate tensile strength remain essentially unchanged (Fig. 13). Once again,
the PS/PE binary blends have a much smaller elongation at break and much higher tensile strengths compared to the ternary blends.
4. Conclusions
This study has shown that maintaining the SBR content of the PE/SBR/PS ternary blends constant at 25 wt% resulted in two main types of phase morphology, i.e. three co-continuous phases when the PE/PS weight ratio is in the 40/60 to 60/40 range, and dispersed phases with a core–shell structure (SBR being systematically the shell) in the matrix formed by the major PE or PS thermoplastic. In the case of the dispersed phase morphology, the hard core in the core–shell phases has no major effect on the mechanical properties whatever the matrix (PE or PS). Actually, these properties for the PS/SBR/PE ternary blends are not basically different from those ones for either the PS/SBR or PE/SBR binary blends of the same content of dispersed (SBR) phase. It must be noted that a previous communication [12] showed that at constant content of the matrix (PS; 75 wt%) the SBR/PE composition of the core–shell dispersed phase had strong influence on the mechanical properties. In that case, the effect of the core on the stress–strain measurement was not masked by the SBR shell. The main difference between the present study and the previous one is that in this study the change in the matrix/core-forming polymer ratio results in decreasing matrix/shell weight ratio from the maximum 75/25 value. In the previous investigation, this 75/25 matrix/shell weight ratio was the lower limit value investigated. Therefore, the
matrix/shell forming polymer ratio appears to have a pronounced influence on the final mechanical performances of the ternary blends in a way that must be investigated further.
Acknowledgements
The authors are grateful to the "Services Fédéraux des Affaires Scientifiques, Techniques et Culturelles" (SSTC) for general support in the frame of the "PAI-4/11: Supramolecular Chemistry and Catalysis". They also thank Mrs Martine Dejeneffe for TEM observations. I.L. is indebted to the SSTC for a fellowship.
References
1. D.R. Paul. In: D.R. Paul and S. Newman Editors, Polymer blends Academic Press, New York (1978), p. 42 chap. 12. 2. L.A. Utracki. Polymer alloys and blends Hanser, Munich, Vienna, New York (1989).
3. S.Y. Hobbs, M.E.J. Dekkers and V.H. Watkins. Polymer 29 (1988), p. 1598.
4. N. Nemirovski, A. Siegmann and N. Narkis. J Macromol Sci, Phys B 34 (1995), p. 459.
5. D. Winerich, N. Nemirovski, A. Siegmann and N. Narkis. J Macromol Sci, Phys B 36 (1997), p. 247. 6. M.S. Lee, T.P. Lodge and C.W. Macosko. J Polym Sci, Polym Phys Ed 35 (1997), p. 2837. 7.H.F. Guo, S. Packirisamy, N.V. Gvozdic and O.J. Meier. Polymer 38 (1997), p. 785. 8. H.F. Guo, N.V. Gvozdic and O.J. Meier. Polymer 38 (1997), p. 4915.
9. S. Horiuchi, N. Matchariyakul, K. Yase, T. Kitano, H.K. Choi and Y.M. Lee. Polymer 38 (1997), p. 59. 10. S. Horiuchi, N. Matchariyakul, K. Yase, T. Kitano, H.K. Choi and Y.M. Lee. Polymer 38 (1997), p. 6317. 11. J. Rösch. Polym Engng Sci 35 (1995), p. 1917.
12. I. Luzinov, K. Xi, C. Pagnoulle, G. Huynh-Ba and R. Jérôme. Polymer 40 (1999), p. 2511. 13.A.J. Oshinski, H. Keskkula and D.R. Paul. Polymer 37 (1996), p. 4891.
14. B.D. Favis and J.P. Chalifoux. Polymer 29 (1988), p. 1761. 15. I. Fortelny and A. Zivny. Polymer 39 (1998), p. 2669.
16. B.D. Favis and J.P. Chalifoux. Polym Eng Sci 27 (1987), p. 1591. 17. B.D. Favis. Macromol Chem, Macromol Symp 56 (1992), p. 143. 18. S. Wu. Polym Eng Sci 27 (1987), p. 335.