and Public Health
Article
Risk Assessment of Florists Exposed to Pesticide
Residues through Handling of Flowers and
Preparing Bouquets
Khaoula Toumi1,*, Laure Joly2, Christiane Vleminckx2and Bruno Schiffers1
1 Gembloux Agro-Bio Tech/ULg—Pesticide Science Laboratory, Passage des Déportés 2, 5030 Gembloux,
Belgium; bruno.schiffers@ulg.ac.be
2 Operational Direction Food, Medecines and Consumer Safety, Institut Scientifique de Santé Publique,
Rue Juliette Wytsman 14, 1050 Brussels, Belgium; Laure.Joly@wiv-isp.be (L.J.); Christiane.Vleminckx@wiv-isp.be (C.V.)
* Correspondence: khaoula.toumi@doct.ulg.ac.be; Tel.: +32-081-622-215 Academic Editor: Ricardo Bello-Mendoza
Received: 3 March 2017; Accepted: 10 May 2017; Published: 13 May 2017
Abstract:Flowers are frequently treated with pesticides and, as a result, florists handling daily a large number of flowers can be exposed to pesticide residues. A study was conducted among twenty volunteer florists located in Namur Province and in the Brussels Capital Region of Belgium in order to assess their potential dermal exposure to dislodgeable pesticide residues transferred from flowers to hands. Two pairs of cotton gloves were worn during two consecutive half days while handling flowers and preparing bouquets (from min 2 h to max 3 h/day). The residual pesticide deposits on the glove samples were extracted with a multi-residue Quick Easy Cheap Effective Rugged Safe (QuEChERS) method and analyzed by a combination of gas and liquid chromatography tandem mass spectrometry (GC-MS/MS and LC-MS/MS) by an accredited laboratory. A total of 111 active substances (mainly insecticides and fungicides) were detected, with an average of 37 active substances per sample and a total concentration per glove sample of 22.22 mg/kg. Several predictive levels of contamination were considered to assess the risk. The potential dermal exposures (PDE) of florists were estimated at the average, for different percentiles, and at the maximum concentration of residues in samples. At the PDE P90 and at the PDEMAX(or worst case) values, three and five active substances respectively exceed the Acceptable Operator Exposure Level (AOEL), indicating risk situations. For the systemic exposure (SE), one active substance (clofentezine) exceeds the AOEL at the P90 predictive level. In the worst case, SEMAX(at the maximum concentrations), four active substances (clofentezine, famoxadone, methiocarb, and pyridaben) exceed their respective AOEL values. Among the 14 most frequently detected active substances, two have SEMAXvalues exceeding the AOEL. Exposure could be particularly critical for clofentezine with an SEMAXvalue four times higher than the AOEL (393%). The exposure of florists appeared to be an example of a unique professional situation in which workers are exposed regularly to both a very high number of toxic chemicals and rather high concentration levels. Therefore the priority should be to raise the level of awareness among the florists who must change their habits and practices if they want to minimize their exposure.
Keywords:pesticide residues; dermal exposure; risk assessment; cut flowers; florists
1. Introduction
Flower production generally involves frequent use of a wide range of pesticides to control diseases and pests in an effort to reduce or eliminate yield losses and maintain high product quality [1,2]. A great majority of producers consider the use of pesticides as necessary to achieve their production targets
Int. J. Environ. Res. Public Health 2017, 14, 526 2 of 19
and the only way to be able to market large quantities of floral products with an acceptable quality and relatively modest price. Research published in 1979 showed that 18 of 105 lots (17.7%) of all flowers imported into Miami contained pesticide residue levels greater than 5 ppm and that three lots had levels greater than 400 ppm [3]. Thirty-seven years later, recent studies on cut flowers (roses, gerberas, and chrysanthemums) sold in Belgium showed that flowers are heavily contaminated. One hundred and seven active substances (a.s.) were detected, i.e., an average of almost 10 active substances per sample and a total average pesticide load of 15.72 mg/kg of flowers [4]. In another study, a total of 97 actives substances were detected on 50 bouquets of roses [5].
On one hand, weakness of local regulations and the lack of maximum residue limits (MRL) for flowers explains that, unlike other crops which are harvested for consumption, there is less restriction on the use of pesticides on flowers. Cut flowers tend to be sprayed at the maximum allowed dosage up to the time of harvest, often with rather toxic chemicals, and then shipped directly to the markets with no interval between treatment and harvest. According to Rikken [6], a vast majority of the producers and European florists are not actively engaged in social and environmental standards, either when they purchase flowers or in communication with their clients. When selling products via the auction system, there are no mandatory requirements with respect to certifications such as the MPS-ABC (Milieu Project Sierteelt A, B and C) Standard, FFP (Fair Flowers-Fair Plants), or Florimark TraceCert [6].
Despite their popularity and extensive use, pesticides may present serious health concerns for exposed operators and workers. Many research studies have demonstrated both acute and chronic toxic effects after exposure during spraying or in post-harvest operations. Moreover, a recent study has shown that pesticides may also have negative impacts on the public health in general [7]. The United Nations Environment Program (UNEP) estimates that, in the whole world, approximately 20,000 workers die every year from pesticide poisoning after direct or indirect exposure [8,9]. No one can deny today that pesticides can be an important source of injury and illness among workers and other professionals who are not informed about the toxicity of the plant protection products, not properly protected, and exposed regularly to pesticides during their usual activities.
Over the past decade, several studies have pointed to exposure to pesticides as a potential cause of prostate and testicular cancers among male floriculturist pesticide applicators and of cervical cancer among females in Florida [10]. In Italy, early-stage cancers have been observed in 60 percent of long-term workers in the floriculture industry [11]. Around the world, genetic damage has been reported in more than 71 percent of cut flower growers [12]. The prevalence of reproductive problems (abortion, prematurity, and congenital malformations) has been reported in Colombian workers who had been working in the floriculture industry for at least six months [13]. In the Philippines, a study assessed the risk factors to pesticide exposure and reported that the most commonly associated health symptoms among cut-flower farmers are weakness and fatigue, muscle pain, chills and fever, blurred vision, dizziness, and headache [14].
The exposure of workers must be estimated for activities that involve contact with treated crops or products (e.g., picking, harvesting, cutting, maintenance, inspection, irrigation). Worker exposure can arise from other activities such as packaging, sorting, and bundling [15]. Considering the numerous and high levels of pesticide residues found on cut flowers in our previous study [4], the florists could be a group more severely exposed to serious hazards than other workers. This is a unique risk situation where workers could be exposed almost every day to many different pesticide residues during their professional activities. This is the reason why a risk assessment was deemed necessary to evaluate the health risks of people who manipulate contaminated flowers. Based on the results, it will be considered if recommendations to reduce the exposure by appropriate prevention and protection measures need to be established.
The amount of pesticide residues on the hands of workers represents the main measure of dermal exposure [16]. As skin is generally recognized as the primary route of exposure to pesticides [17–22], the transfer of pesticide residues to the hands could contribute significantly to the total exposure. According to their physical and chemical properties (physical state, vapor pressure, Henry constant,
solubility, hydrolysis rate), many pesticides sprayed on cut flowers are in the form of persistent, fat-soluble pesticide residue, which can be dislodged from the two-sided foliar surface of a plant or after spraying. The active substances are adsorbed and fixed on the surface of the plant and therefore could be dislodged by contact with hands. The actual dermal exposure has been defined previously as the amount of pesticide coming into contact with the skin of workers that becomes available for absorption through the skin [23–25]. Recently, the EFSA (European Food Safety Authority) [15] has harmonised the approach of pesticide exposure assessment for workers. The EFSA has proposed various transfer coefficients [26,27] to be applied for different scenarios (nature and duration of the activity during re-entry), including activities in ornamentals [15]. In this paper, we have attempted to measure the transfer of pesticide residues from flowers to hands and to assess the potential dermal exposure of florists. Finally, the risk level for each active substance was established by comparison to the Acceptable Operator Exposure Level (AOEL) [28].
2. Materials and Methods
2.1. Assessment of Florist Hands Exposure Using Cotton Gloves
Cotton gloves can be used to assess the potential dermal exposure of workers through hands. Gloves worn during normal professional tasks act as a reservoir for active substances that come into contact with the skin [18,29,30]. A study was conducted among twenty volunteer florists located in Namur Province and in the Brussels Capital Region of Belgium to evaluate their potential dermal exposure, measuring the potential transfer of pesticides from treated flowers to hands. Two pairs of 100% cotton gloves were distributed to each florist and worn during two consecutive half days when handling flowers and preparing bouquets (from min 2 h to max 3 h/day). The two pairs were collected as a single sample (four gloves/sample), weighed, cut in small pieces with scissors, and stored in freezing bags at−18◦C until transport (by road, from Gembloux to Ghent) and analysis.
2.2. Extraction and Analysis of Pesticide Residues
The residual pesticide deposits on the gloves were analysed by PRIMORIS (formerly FYTOLAB, Technologiepark 2/3, 9052 Zwijnaarde, Belgium) laboratory holding a BELAC (Belgian Accreditation Council) accreditation to ISO/CEI 17025 for pesticide residues. PRIMORIS is an independent, accredited, and officially recognized service laboratory (accreditation number 057-TEST). Samples were analyzed using a multi-residue Quick Easy Cheap Effective Rugged Safe (QuEChERS) method validated by the laboratory for the analysis of residues in foodstuffs. It detects approximately 500 different active substances (a.s.) in a single analysis thanks to a combination of gas and liquid chromatography. The extraction procedure is based on the AOAC (Association of Official Analytical Chemists) Official Method 2007.01. [31]. Briefly, a homogenous 10.0 g sub-sample (small pieces of gloves) is weighted into a 50 mL polypropylene tube. Then, 10 mL of acidified acetonitrile (1% acetic acid), 4 g of anhydrous magnesium sulfate (MgSO4), and 1 g of sodium acetate (NaOAc) are added. After shaking and sonication in a ultrasonic bath, the polypropylene tube is centrifuged. A portion of the acetonitrile phase (upper layer) is transferred to vials and further analyzed by gas or liquid chromatography tandem mass spectrometry (GC-MS/MS (Thermo Fischer Scientific, Interscience Belgium, Louvain-la-Neuve, Belgium) or LC-MS/MS (Waters Corporation, Zellik, Belgium)), according to the active substances to be determined (GC-MS/MS for small, thermally stable, volatile, non-polar molecules, or LC-MS/MS for larger, thermolabile, non-volatile, or polar molecules). For almost all active substances, the limit of quantification (LOQ) was≤0.01 mg/kg. A similar method has been previously used to measure the pesticide deposits on flowers [4]. Considering that extraction from flowers could differ from the one from cotton gloves, a preliminary multi-residue recovery study has been carried out. Therefore the analytical results were corrected accordingly for all active substances with a recovery ratio between 50–130% (only few substances had a percentage of recovery below or above these values; in this case, the results remain uncorrected in the tables).
Int. J. Environ. Res. Public Health 2017, 14, 526 4 of 19
2.3. Multi-Residue Recovery Preliminary Study
To assess the recovery percentages of pesticide residues, two multi-pesticide solutions were spiked on cotton gloves, which were allowed to dry for 24 h, cut in small pieces, stored, and analyzed with a similar multi-residue method. The recovery is obtained as a ratio between the amount of residue measured in the extract after analysis and the amount spiked on gloves (% Recovery = (amount of extracted residues (mg)/amount of active substance placed on the gloves (mg))×100). Three replicates of the recovery trial were conducted on three different days. For each trial, four samples were prepared (5 g of gloves/sample); one sample with pieces of untreated gloves (blank sample) and three samples used to estimate recoveries. These ones were spiked with two multi-residue solutions containing 240 active substances in methanol and 155 active substances in acetone. Solutions were prepared in an accredited ISO17025 laboratory (ISP chemical residues and contaminants) according to an accredited internal procedure. Stability and variability tests were passed according to the quality criteria of the SANTE/11945/2015 document [32]. All the solutions (individual, intermediate mix, and spiking) were stocked and aliquoted at−20◦C. The spiking was done by spraying small droplets of 250 µL and 100 µL of the two solutions (concentration 2 µg/mL and 5 µg/mL respectively) using a 250 µL and 100 µL calibrated syringes, respectively. No pesticides were detected in the three blanco samples, proving an absence of pesticides in the gloves themselves. The spiking was calculated to reach an average concentration of about 0.1 mg/kg gloves for each active substance. Twenty-four hours after deposit, the samples were cut into small pieces and stored in freezing bags at−18◦C until analysis. The recoveries were calculated using statistical analysis software developed by Verplaetse in 1998, modified by Van Loco in 2003 [33]. The preliminary study allowed a percentage of recovery for 395 substances to be determined, but the recoveries of nine active substances (azadirachtin, captan, cyflumetofen, etoxazole, fluoxastrobin, pymetrozine, spinetoram, tetrahydrophtalimide, and thiophanate methyl) that were not available in the spiking solutions could not been determined.
2.4. Florists Exposure Assessment Calculation
Classically, exposure is described as the amount of an agent that contacts the outer boundary of the body. However, this definition of exposure is limited because the real interest in risk assessment is the amount of an agent that breeches the outer boundary of the body (dose) and is capable of being distributed to one or more organs to exert a toxic effect (target dose) [34]. For dermal exposure to occur, an individual must have contact with the chemical in a given medium. The amount of exposure will depend on the concentration of the chemical contacting a given area of skin—the dermal loading or skin adherence, the ability of the chemical to penetrate and pass through intact skin—the dermal dose, and the duration and frequency of contact in terms of the intervals of contact and the number of intervals per day, weeks, months, or even a lifetime [34].
The exposure of workers can be estimated for activities that involve contact with treated crops or products. The main route of exposure for florists who handle daily cut flowers and ornamentals is skin contact and subsequent dermal absorption.
The potential dermal exposure (PDE) values were estimated as the amount of pesticide residues with low adhesion that were transferred from flowers to gloves. For each active substance, PDE was calculated as follows:
PDE (in mg a.s./kg bw per day) = ((C (mg/kg)×GW (kg))×T (h))×3)/bw (kg)
where C is the concentration of active substance in the sub-sample (5 g), GW is the average weight of the cotton gloves samples (57 g + 0.17 g), T is the task duration during the trial (2 h), and bw is the body weight (60 kg).
A total task duration value of 6 h/day was used to assess the dermal exposure of florists. A recent survey in Belgium [4] showed that 60% of the florists worked between 6 and 7 h/day. The time spent preparing bouquets and handling flowers vary greatly over the year, but is always quite high, varying
on average from 2 to 6 h/day for 80% of the florists in the low season and for 40% of the florists in the high season. This handling time could be in excess of 6 h for 8% of the florists in the low season, but during the high season or special occasions, an intense working period, 60% spent more than 6 h/day on this work. Only 12% of the florists worked less than 2 h/day in the low season. A default body weight (bw) value of 60 kg is used in line with the recent EFSA Guidance Document to cover a range of professionally exposed adults [15].
The PDE values were then converted into systemic doses using an appropriate dermal absorption percentage of 75% (default value) [35]. To obtain the actual dermal exposure (ADE), the potential dermal exposure (PDE) values in absence of protection can be reduced by 90%, the penetration factor being equal to 10% when workwear and gloves are worn [15].
The risk characterisation is obtained as the ratio of the exposure level to the reference value of each active substance, the AOEL (Acceptable Operator Exposure Level; in mg a.s./kg·bw per day), which should not be exceeded to avoid any detrimental effect on florists’ health. Several prediction levels of the PDE were considered, including the mean, 75th percentile, 90th percentile, and the maximum (in mg/kg bw per day) to assess the risk for florists. Therefore, the systemic exposure (SE) values (mean, 75th percentile, 90th percentile, and maximum) were expressed as percentage of the AOEL. It has been assumed that the most appropriate level to cover and assess the risk is the maximum value of the SE (SEmax or worst case).
3. Results
3.1. Pesticide Residues Identified on Glove Samples
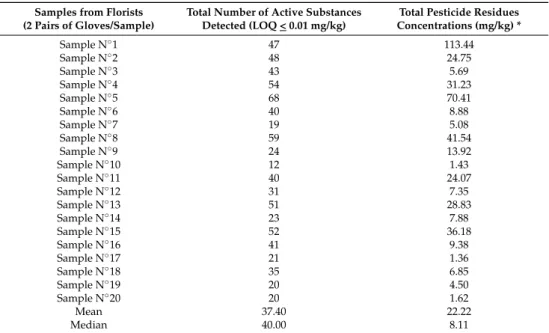
All glove samples appeared to be contaminated by high levels of pesticide residues for most active substances. A total of 111 a.s. were identified, with an average of about 37 a.s./sample and an average total pesticide residue concentrations per glove sample of 22.22 mg/kg (Table1). Fourteen active substances (azoxystrobine (80%), benomyl (95%), boscalid (90%), clofentezine (90%), fenhexamid (85%), flonicamid (90%), fludioxonil (85%), fluopyram (80%), imidacloprid (75%), iprodione (95%), lufenuron (90%), methiocarb (75%), procymidone (85%), and spiroxamine (80%)) are the most frequently detected. They are present on more than 15 of the 20 samples (75%).
Table 1.Total number of active substances (a.s.) detected and total pesticide residue concentrations (mg/kg) in 20 samples of gloves.
Samples from Florists (2 Pairs of Gloves/Sample)
Total Number of Active Substances Detected (LOQ < 0.01 mg/kg)
Total Pesticide Residues Concentrations (mg/kg) * Sample N◦1 47 113.44 Sample N◦2 48 24.75 Sample N◦3 43 5.69 Sample N◦4 54 31.23 Sample N◦5 68 70.41 Sample N◦6 40 8.88 Sample N◦7 19 5.08 Sample N◦8 59 41.54 Sample N◦9 24 13.92 Sample N◦10 12 1.43 Sample N◦11 40 24.07 Sample N◦12 31 7.35 Sample N◦13 51 28.83 Sample N◦14 23 7.88 Sample N◦15 52 36.18 Sample N◦16 41 9.38 Sample N◦17 21 1.36 Sample N◦18 35 6.85 Sample N◦19 20 4.50 Sample N◦20 20 1.62 Mean 37.40 22.22 Median 40.00 8.11
Int. J. Environ. Res. Public Health 2017, 14, 526 6 of 19
3.2. Pesticide Residues Hazard Characterisation
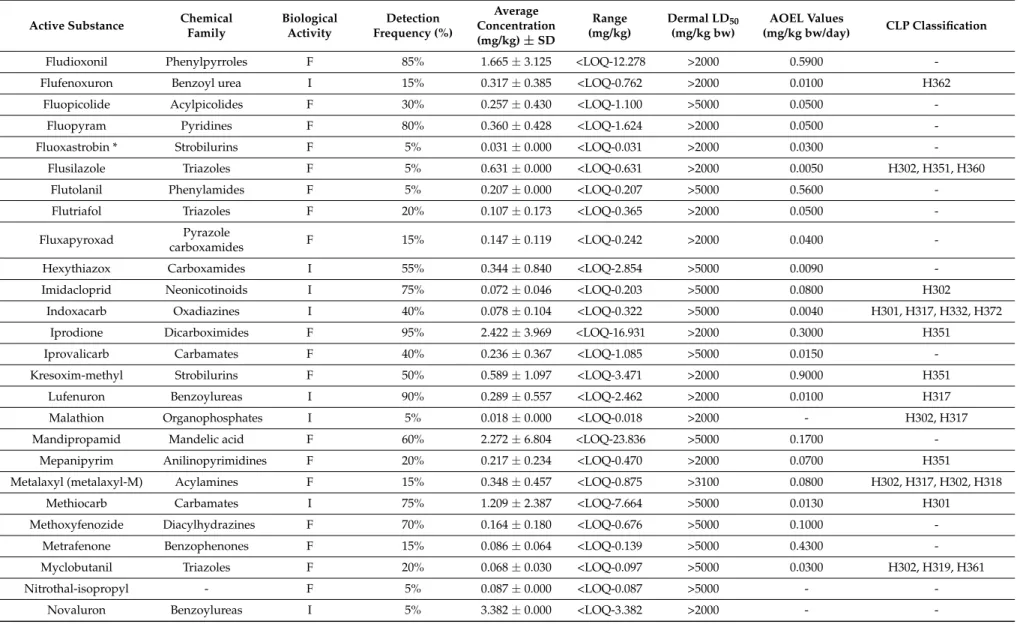
The intrinsic toxicological properties (acute and chronic toxicity including mutagenic, carcinogenic and reproductive hazards) of each substance identified on the gloves were collected in pesticide databases (European Union Pesticides Database, Directorate-General for Health and Food Safety) and JMPR (Joint Meeting on Pesticide Residues)reports (FAO (Food and Agriculture Organization) Joint Meeting on Pesticide Residues) (Table2) [28,36–39].
3.3. Florists Exposure Assessment
Table3presents the number of detection (N), the Potential Dermal Exposure (mean, 75th percentile, 90th percentile, and maximum values) in mg/kg bw per day, and the systemic exposure as a percentage of the AOEL calculated for SE (mean, 75th percentile, 90th percentile, and maximum values), for all active substances detected on the gloves of florists. All values exceeding 100% of the AOEL indicate a potential risk situation.
The actual dermal exposure (ADE) values have been calculated for the same prediction levels of risk. None of these values exceed the AOEL. Therefore the detailed results were not reported here. 3.4. Most Frequently Detected Active Substances and AOEL Exceedance
Fourteen active substances were the most frequently detected in the glove samples (frequency > 75%). Therefore, it was considered that a great part of the risk could be related to the repeated exposure of the florists to these specific 14 substances. Figure1presents the percentage of their respective AOEL (from 0 to more than 100% AOEL) for their SEMAXvalues.
Int. J. Environ. Res. Public Health 2017, 14, 526 6 of 19
3.2. Pesticide Residues Hazard Characterisation
The intrinsic toxicological properties (acute and chronic toxicity including mutagenic, carcinogenic and reproductive hazards) of each substance identified on the gloves were collected in pesticide databases (European Union Pesticides Database, Directorate-General for Health and Food Safety) and JMPR (Joint Meeting on Pesticide Residues)reports (FAO (Food and Agriculture Organization) Joint Meeting on Pesticide Residues) (Table 2) [28,36–39].
3.3. Florists Exposure Assessment
Table 3 presents the number of detection (N), the Potential Dermal Exposure (mean, 75th percentile, 90th percentile, and maximum values) in mg/kg bw per day, and the systemic exposure as a percentage of the AOEL calculated for SE (mean, 75th percentile, 90th percentile, and maximum values), for all active substances detected on the gloves of florists. All values exceeding 100% of the AOEL indicate a potential risk situation.
The actual dermal exposure (ADE) values have been calculated for the same prediction levels of risk. None of these values exceed the AOEL. Therefore the detailed results were not reported here. 3.4. Most Frequently Detected Active Substances and AOEL Exceedance
Fourteen active substances were the most frequently detected in the glove samples (frequency > 75%). Therefore, it was considered that a great part of the risk could be related to the repeated exposure of the florists to these specific 14 substances. Figure 1 presents the percentage of their respective AOEL (from 0 to more than 100% AOEL) for their SEMAX values.
Figure 1. The maximum systemic exposure (SEMAX) of the fourteen most frequently detected active
substances on gloves worn by florists as a percentage of the Acceptable Operator Exposure Level (AOEL), Green Symbol: SEMAX as a percentage of the AOEL.
Figure 1.The maximum systemic exposure (SEMAX) of the fourteen most frequently detected active
substances on gloves worn by florists as a percentage of the Acceptable Operator Exposure Level (AOEL), Green Symbol: SEMAXas a percentage of the AOEL.
Table 2.Alphabetic classification of all a.s. detected in the 20 samples of gloves with their chemical family, biological activity, detection frequency (% samples where the a.s. is detected), average (±SD), and range of concentrations (mg/kg gloves, LOQ < 0.01 mg/kg) in the samples and their toxicological properties (Dermal LD50, AOEL values, and CLP (Classification, Labelling and Packaging) Classification according the EU Pesticides database).
Active Substance Chemical Family Biological Activity Detection Frequency (%) Average Concentration (mg/kg) ± SD Range (mg/kg) Dermal LD50 (mg/kg bw) AOEL Values (mg/kg bw/day) CLP Classification
Acephate * Organophosphates I 10% 0.055 ± 0.055 <LOQ-0.094 >10,000 0.0300 H302
Acetamiprid Neonicotinoids I 30% 0.219 ± 0.263 <LOQ-0.602 >2000 0.0700 H302
Acrinathrin Pyrethroids I 10% 0.285 ± 0.372 <LOQ-0.547 >2000 0.0070
-Ametoctradin Triazolopyrimidine F 55% 0.859 ± 1.921 <LOQ-6.477 >2000 2.0000
-Azadirachtin * limonoid I 20% 0.169 ± 0.137 <LOQ-0.350 >2000 0.1000
-Azoxystrobine Strobilurins F 80% 0.617 ± 0.917 <LOQ-3.287 >2000 0.2000 H331
Benomyl (carbendazim) * Benzimidazole F 95% 0.739 ± 2.040 <LOQ-9.000 >10,000 0.0200 H315, H317, H335,
H340, H360
Bifenazate * Carbazates I 15% 0.132 ± 0.164 <LOQ-0.320 >5000 0.0028 H317, H373
Bifenthrin Pyrethroids I 15% 0.059 ± 0.048 <LOQ-0.108 >2000 0.0075 H300, H317, H331
H351, H372
Bitertanol Triazoles F 20% 0.043 ± 0.038 <LOQ-0.097 >5000 0.0100
-Boscalid Carboxamides F 90% 3.471 ± 6.810 <LOQ-26.213 >2000 0.1000
-Bupirimate Pyrimidine F 35% 0.170 ± 0.184 <LOQ-0.565 >2000 0.0500
-Buprofezin Thiadiazine I 35% 0.488 ± 1.093 <LOQ-2.963 1635–3847 0.0400
-Captan * Phthalimides F 5% 0.510 ± 0.240 <LOQ-0.680 >2000 0.1000 H317, H318, H331 H351
Carbofuran Carbamates I 5% 0.012 ± 0.000 <LOQ-0.012 >500 0.0003 H300, H330
Chlorantraniliprole Diamides I 15% 0.215 ± 0.878 <LOQ-0.373 >5000 0.3600 H301
Chlorothalonil * Organochlorine F 25% 0.197 ± 0.190 <LOQ-0.420 >5000 0.3600 H317, H318, H330 H335,
H351
Chlorpyrifos (-ethyl) Organophosphates I 10% 0.041 ± 0.012 <LOQ-0.049 >2000 0.0010 H301
Clofentezine Quinoxalines I 90% 2.881 ± 5.604 <LOQ-18.373 >2100 0.0100
-Cyflumetofen * Benzoylacetonitriles I 60% 0.116 ± 0.204 <LOQ-0.750 >5000 0.1100
-Cyhalothrin Pyrethroids I 35% 0.107 ± 0.158 <LOQ-0.452 632 0.0025
Int. J. Environ. Res. Public Health 2017, 14, 526 8 of 19
Table 2. Cont.
Active Substance Chemical Family Biological Activity Detection Frequency (%) Average Concentration (mg/kg) ± SD Range (mg/kg) Dermal LD50 (mg/kg bw) AOEL Values (mg/kg bw/day) CLP Classification
Cyproconazole Triazoles F 5% 0.043 ± 0.000 <LOQ-0.043 >2000 0.0200 H302, H361
Cyprodinil Anilinopyrimidines F 70% 0.132 ± 0.219 <LOQ-0.745 >2000 0.0300 H317
Deet I 85% 0.146 ± 0.078 <LOQ-0.299 - -
-Deltamethrin Pyrethroids I 40% 0.074 ± 0.066 <LOQ-0.221 >2000 0.0075 H301, H331
Dicofol Organochlorine I 5% 0.035 ± 0.000 <LOQ-0.035 >5000 - H302, H312, H315, H317
Difenoconazole Triazoles F 50% 0.120 ± 0.175 <LOQ-0.552 2010 0.1600
-Diflubenzuron Benzoylureas I 10% 0.036 ± 0.021 <LOQ-0.051 >10,000 0.0330
-Dimethoate Organophosphates I 5% 0.016 ± 0.000 <LOQ-0.016 >7000 0.0010 H302, H312
Dimethomorph Cinnamic acid F 70% 0.476 ± 0.878 <LOQ-3.485 >2000 0.1500
-Diphenylamine Amides F 25% 0.144 ± 0.139 <LOQ-0.392 1700 0.1000 H315, H317
Dodemorph * Morpholine F 65% 0.503 ± 1.017 <LOQ-3.700 >2000 0.0330 H314, H317, H361, H373
Endosulfan Organochlorine I 25% 0.092 ± 0.071 <LOQ-0.183 500 - H300, H312, H330
Etoxazole * Oxazolines I 45% 0.301 ± 0.552 <LOQ-1.700 >2000 0.0300
-Famoxadone Oxazolidinediones F 60% 0.563 ± 0.779 <LOQ-2.627 >2000 0.0048 H373
Fenamidone Imidazolinones F 40% 0.215 ± 0.366 <LOQ-1.056 >2000 0.3000
-Fenazaquin Quinazolines I 10% 0.689 ± 1.039 <LOQ-1.364 >2000 0.0100 H301, H332
Fenhexamid Phenylpyrroles F 85% 1.052 ± 1.713 <LOQ-5.195 >5000 0.3000
-Fenoxycarb Carbamates I 5% 0.047 ± 0.000 <LOQ-0.047 >2000 0.1000 H351
Fenpyroximate Pyridazinones I 5% 1.268 ± 0.000 <LOQ-1.268 >2000 0.0050 H301, H317, H330
Fenvalerate Pyrethroids I 10% 0.198 ± 0.201 <LOQ-0.339 5000 -
-Fipronil Phenylpyrazoles I 40% 0.281 ± 0.407 <LOQ-1.199 >2000 0.0035 H301, H311, H331, H372
Flonicamid Pyridinecarboxamides I 90% 0.379 ± 0.563 <LOQ-1.964 >5000 0.0250 H302
Fluazinam Phenylpyridylamines F 20% 0.098 ± 0.069 <LOQ-0.197 5500 0.0040 H317, H318, H332, H361
-Table 2. Cont.
Active Substance Chemical Family Biological Activity Detection Frequency (%) Average Concentration (mg/kg) ± SD Range (mg/kg) Dermal LD50 (mg/kg bw) AOEL Values (mg/kg bw/day) CLP Classification
Fludioxonil Phenylpyrroles F 85% 1.665 ± 3.125 <LOQ-12.278 >2000 0.5900
-Flufenoxuron Benzoyl urea I 15% 0.317 ± 0.385 <LOQ-0.762 >2000 0.0100 H362
Fluopicolide Acylpicolides F 30% 0.257 ± 0.430 <LOQ-1.100 >5000 0.0500
-Fluopyram Pyridines F 80% 0.360 ± 0.428 <LOQ-1.624 >2000 0.0500
-Fluoxastrobin * Strobilurins F 5% 0.031 ± 0.000 <LOQ-0.031 >2000 0.0300
-Flusilazole Triazoles F 5% 0.631 ± 0.000 <LOQ-0.631 >2000 0.0050 H302, H351, H360
Flutolanil Phenylamides F 5% 0.207 ± 0.000 <LOQ-0.207 >5000 0.5600
-Flutriafol Triazoles F 20% 0.107 ± 0.173 <LOQ-0.365 >2000 0.0500
-Fluxapyroxad Pyrazole
carboxamides F 15% 0.147 ± 0.119 <LOQ-0.242 >2000 0.0400
-Hexythiazox Carboxamides I 55% 0.344 ± 0.840 <LOQ-2.854 >5000 0.0090
-Imidacloprid Neonicotinoids I 75% 0.072 ± 0.046 <LOQ-0.203 >5000 0.0800 H302
Indoxacarb Oxadiazines I 40% 0.078 ± 0.104 <LOQ-0.322 >5000 0.0040 H301, H317, H332, H372
Iprodione Dicarboximides F 95% 2.422 ± 3.969 <LOQ-16.931 >2000 0.3000 H351
Iprovalicarb Carbamates F 40% 0.236 ± 0.367 <LOQ-1.085 >5000 0.0150
-Kresoxim-methyl Strobilurins F 50% 0.589 ± 1.097 <LOQ-3.471 >2000 0.9000 H351
Lufenuron Benzoylureas I 90% 0.289 ± 0.557 <LOQ-2.462 >2000 0.0100 H317
Malathion Organophosphates I 5% 0.018 ± 0.000 <LOQ-0.018 >2000 - H302, H317
Mandipropamid Mandelic acid F 60% 2.272 ± 6.804 <LOQ-23.836 >5000 0.1700
-Mepanipyrim Anilinopyrimidines F 20% 0.217 ± 0.234 <LOQ-0.470 >2000 0.0700 H351
Metalaxyl (metalaxyl-M) Acylamines F 15% 0.348 ± 0.457 <LOQ-0.875 >3100 0.0800 H302, H317, H302, H318
Methiocarb Carbamates I 75% 1.209 ± 2.387 <LOQ-7.664 >5000 0.0130 H301
Methoxyfenozide Diacylhydrazines F 70% 0.164 ± 0.180 <LOQ-0.676 >5000 0.1000
-Metrafenone Benzophenones F 15% 0.086 ± 0.064 <LOQ-0.139 >5000 0.4300
-Myclobutanil Triazoles F 20% 0.068 ± 0.030 <LOQ-0.097 >5000 0.0300 H302, H319, H361
Nitrothal-isopropyl - F 5% 0.087 ± 0.000 <LOQ-0.087 >5000 -
-Int. J. Environ. Res. Public Health 2017, 14, 526 10 of 19
Table 2. Cont.
Active Substance Chemical Family Biological Activity Detection Frequency (%) Average Concentration (mg/kg) ± SD Range (mg/kg) Dermal LD50 (mg/kg bw) AOEL Values (mg/kg bw/day) CLP Classification
Oxycarboxin Anilides F 5% 0.017 ± 0.000 <LOQ-0.017 16,000 - H302
Paclobutrazol Triazoles R 15% 0.291 ± 0.451 <LOQ-0.811 >1000 0.1000
-Penconazole Triazoles F 5% 0.131 ± 0.000 <LOQ-0.131 >3000 0.0300 H302, H361
Permethrin Pyrethroids I 5% 0.037 ± 0.000 <LOQ-0.037 >2000 - H302, H332, H335
Picoxystrobin Strobilurins F 25% 0.223 ± 0.451 <LOQ-1.030 >2000 0.0430
-Piperonyl-butoxyde - I 45% 0.065 ± 0.111 <LOQ-0.351 >2000 -
-Pirimicarb Carbamates I 15% 0.023 ± 0.012 <LOQ-0.039 >2000 0.0350 H301
Pirimiphos-methyl Organophosphates I 5% 0.024 ± 0.000 <LOQ-0.024 >2000 0.0200 H302
Prochloraz Imidazoles F 65% 0.476 ± 0.837 <LOQ-3.049 >2000 0.0200 H302
Procymidone Dicarboximides F 85% 0.729 ± 1.352 <LOQ-4.207 >2500 0.0120
-Profenofos Organophosphates I 5% 0.013 ± 0.000 <LOQ-0.013 >2000 - H302, H312, H332
Propamocarb * Carbamates F 65% 0.770 ± 1.462 <LOQ-5.100 >2000 0.2900
-Propiconazole Triazoles F 20% 0.032 ± 0.022 <LOQ-0.064 >4000 0.1000 H302, H317
Pymetrozine * Pyridine-azométhrine I 45% 0.072 ± 0.084 <LOQ-0.280 >2000 0.0300 H351
Pyraclostrobin Strobilurins F 50% 0.589 ± 0.845 <LOQ-2.222 >2000 0.0150 H315, H331
Pyridaben Pyridazinones I 30% 0.654 ± 1.103 <LOQ-2.804 >2000 0.0050 H301, H331
Pyridalyl Dihalopropenes I 65% 0.175 ± 0.177 <LOQ-0.625 >5000 0.0200
-Pyrimethanil Anilinopyrimidines F 25% 0.094 ± 0.111 <LOQ-0.283 >5000 0.1200
-Pyriproxyfen Pyridines I 5% 0.015 ± 0.000 <LOQ-0.015 >2000 0.0400
-Simazine Triazines H 5% 0.021 ± 0.000 <LOQ-0.021 - - H351
Spinetoram * Spinosyns I 25% 0.018 ± 0.005 <LOQ-0.024 >5000 0.0065
-Spinosad * Spinosyns I 35% 0.149 ± 0.306 <LOQ-0.840 >5000 0.0120
-Spirodiclofen * Keto-Enol I 5% 2.000 ± 0.000 <LOQ-2.000 >2000 0.0090
-Spiromesifen Keto-Enol I 5% 0.025 ± 0.000 <LOQ-0.025 >2000 0.0150
Table 2. Cont.
Active Substance Chemical Family Biological Activity Detection Frequency (%) Average Concentration (mg/kg) ± SD Range (mg/kg) Dermal LD50 (mg/kg bw) AOEL Values (mg/kg bw/day) CLP Classification
Spiroxamine Spirocétalamines F 80% 0.363 ± 0.323 <LOQ-1.031 1068 0.0150 H302, H312, H315,
H317, H332
Tebuconazole Triazoles F 40% 0.323 ± 0.511 <LOQ-1.494 >2000 0.0300 H302, H361
Tebufenozide Diacylhydrazines I 5% 0.155 ± 0.000 <LOQ-0.155 >5000 0.0080
-Tebufenpyrad Pyrazoles I 10% 0.161 ± 0.197 <LOQ-0.300 >2000 0.0100 H301, H317, H332, H373
Tetraconazole Triazoles F 5% 0.037 ± 0.000 <LOQ-0.037 - 0.0300 H302, H332
Tetramethrine * Pyrethroids I 5% 0.020 ± 0.000 <LOQ-0.020 - -
-Thiabendazole * Benzimidazoles F 10% 0.042 ± 0.020 <LOQ-0.056 >5000 0.1000
-Thiacloprid Neonicotinoids I 45% 0.347 ± 0.596 <LOQ-1.777 >2000 0.0200
-Thiametoxam Neonicotinoids I 55% 0.294 ± 0.360 <LOQ-1.031 >2000 0.0800 H302
Thiophanate methyl * Benzimidazoles F 35% 0.087 ± 0.083 <LOQ-0.230 >10,000 0.0800 H317, H332, H341
Tolclofos-methyl Organophosphates F 20% 0.035 ± 0.017 <LOQ-0.057 >5000 0.2000 H317
Triadimefon (triadimenol) Triazoles F 5% 0.053 ± 0.000 <LOQ-0.053 >5000 0.0500 H302, H317
Trifloxystrobin Strobilurins F 50% 0.161 ± 0.169 <LOQ-0.529 >2000 0.0600 H317
Triflumizole Triazoles F 5% 0.027 ± 0.000 <LOQ-0.027 >5000 0.0500
-H300: Fatal if swallowed; H301: Toxic if swallowed; H302: Harmful if swallowed;H311: Toxic in contact with skin; H312: Harmful in contact with skin; H314: Causes severe skin burns and eye damage; H315: Causes skin irritation; H317: May cause an allergic skin reaction; H318: Causes serious eye damage; H319: Causes serious eye irritation; H330: Fatal if inhaled; H331: Toxic if inhaled; H332: Harmful if inhaled; H335: May cause respiratory irritation; H340: May cause genetic defects; H341: Suspected of causing genetic defects; H351: Suspected of causing cancer; H360: May damage fertility or the unborn child; H361: Suspected of damaging fertility or the unborn child; H362: May cause harm to breast-fed children; H372: Causes damage to organs through prolonged or repeated exposure; H373: May cause damage to organs through prolonged or repeated exposure; F: Fungicide; H: Herbicide; I: Insecticide; R: Growth regulator; *: active substances with non-corrected recovery due to recovery below or above 50–130%.
Int. J. Environ. Res. Public Health 2017, 14, 526 12 of 19
Table 3.All a.s. present in the 20 samples of gloves and the corresponding calculation: number of detection (N), potential dermal exposure (mean, 75th percentile, 90th percentile, and maximum values) in mg/kg bw per day and the systemic exposure as a percentage of the AOEL calculated for SE (mean, 75th percentile, 90th percentile, and maximum values) for all active substances detected on the gloves of florists (*: Value exceeds the AOEL).
Active Substance N PDE (Mean) (mg/kg bw per day) SE (Mean) in % of AOEL PDE (75th P) (mg/kg bw per day) SE (75th P) in % of AOEL PDE (90th P) (mg/kg bw per day) SE (90th P) in % of AOEL PDE (Maximum) (mg/kg bw per day) SE (Maximum) in % of AOEL Acephate 2 0.00016 0% 0.00021 1% 0.00025 1% 0.00027 1% Acetamiprid 6 0.00062 1% 0.00115 1% 0.00158 2% 0.00172 2% Acrinathrin 2 0.00081 9% 0.00118 13% 0.00141 15% 0.00156 17% Ametoctradin 11 0.00245 0% 0.00181 0% 0.00389 0% 0.01846 0% Azadirachtin 4 0.00048 0% 0.00068 1% 0.00087 1% 0.00100 1% Azoxystrobine 16 0.00176 1% 0.00260 1% 0.00466 2% 0.00937 4% Benomyl (carbendazim) 19 0.00210 8% 0.00168 6% 0.00342 13% 0.02565 * 96% Bifenazate 3 0.00038 10% 0.00053 14% 0.00076 20% 0.00091 24% Bifenthrin 3 0.00017 2% 0.00023 2% 0.00028 3% 0.00031 3% Bitertanol 4 0.00012 1% 0.00016 1% 0.00023 2% 0.00028 2% Boscalid 18 0.00989 7% 0.00943 7% 0.02767 21% 0.07471 56% Bupirimate 7 0.00048 1% 0.00049 1% 0.00096 1% 0.00161 2% Buprofezin 7 0.00139 3% 0.00040 1% 0.00370 7% 0.00845 16% Captan 1 0.00145 1% 0.00170 1% 0.00184 1% 0.00194 1% Carbofuran 1 0.00003 8% 0.00003 8% 0.00003 8% 0.00003 8% Chlorantraniliprole 3 0.00061 0% 0.00087 0% 0.00099 0% 0.00106 0% Chlorothalonil 5 0.00056 0% 0.00105 0% 0.00114 0% 0.00120 0% Chlorpyrifos (-ethyl) 2 0.00012 9% 0.00013 10% 0.00014 11% 0.00014 11% Clofentezine 18 0.00821 62% 0.00623 47% 0.02862 * 215% 0.05236 * 393% Cyflumetofen 12 0.00033 0% 0.00029 0% 0.00042 0% 0.00214 1% Cyhalothrin 7 0.00030 9% 0.00029 9% 0.00074 22% 0.00129 39% Cypermethrin 10 0.00039 0% 0.00074 1% 0.00093 1% 0.00130 2% Cyproconazole 1 0.00012 0% 0.00012 0% 0.00012 0% 0.00012 0% Cyprodinil 14 0.00038 1% 0.00033 1% 0.00112 3% 0.00212 5% Deet 17 0.00042 - 0.00054 - 0.00068 - 0.00085 -Deltamethrin 8 0.00021 2% 0.00023 2% 0.00040 4% 0.00063 6% Dicofol 1 0.00010 - 0.00010 - 0.00010 - 0.00010 -Difenoconazole 10 0.00034 0% 0.00041 0% 0.00085 0% 0.00157 1% Diflubenzuron 2 0.00010 0% 0.00012 0% 0.00014 0% 0.00014 0% Dimethoate 1 0.00005 4% 0.00005 4% 0.00005 4% 0.00005 4% Dimethomorph 14 0.00136 1% 0.00090 0% 0.00158 1% 0.00993 5% Diphenylamine 5 0.00041 0% 0.00026 0% 0.00078 1% 0.00112 1% Dodemorph 13 0.00143 3% 0.00086 2% 0.00295 7% 0.01055 24% Endosulfan 5 0.00026 - 0.00043 - 0.00049 - 0.00052 -Etoxazole 9 0.00086 2% 0.00108 3% 0.00202 5% 0.00485 12%
Table 3. Cont. Active Substance N PDE (Mean) (mg/kg bw per day) SE (Mean) in % of AOEL PDE (75th P) (mg/kg bw per day) SE (75th P) in % of AOEL PDE (90th P) (mg/kg bw per day) SE (90th P) in % of AOEL PDE (Maximum) (mg/kg bw per day) SE (Maximum) in % of AOEL Famoxadone 12 0.00160 25% 0.00167 26% 0.00412 64% 0.00749 * 117% Fenamidone 8 0.00061 0% 0.00044 0% 0.00175 0% 0.00301 1% Fenazaquin 2 0.00214 16% 0.00319 24% 0.00381 29% 0.00423 32% Fenhexamid 17 0.00300 1% 0.00261 1% 0.01058 3% 0.01483 4% Fenoxycarb 1 0.00014 0% 0.00014 0% 0.00014 0% 0.00014 0% Fenpyroximate 1 0.00361 54% 0.00361 54% 0.00361 54% 0.00361 54% Fenvalerate 2 0.00056 - 0.00077 - 0.00089 - 0.00097 -Fipronil 8 0.00080 17% 0.00082 18% 0.00203 44% 0.00342 73% Flonicamid 18 0.00108 3% 0.00140 4% 0.00358 11% 0.00560 17% Fluazinam 4 0.00028 5% 0.00032 6% 0.00046 9% 0.00056 11% Flubendiamide 3 0.00036 5% 0.00051 6% 0.00075 9% 0.00090 11% Fludioxonil 17 0.00474 1% 0.00541 1% 0.01162 1% 0.03499 4% Flufenoxuron 3 0.00090 7% 0.00124 9% 0.00180 14% 0.00217 16% Fluopicolide 6 0.00073 1% 0.00073 1% 0.00204 3% 0.00314 5% Fluopyram 16 0.00103 2% 0.00126 2% 0.00228 3% 0.00463 7% Fluoxastrobin 1 0.00009 0% 0.00009 0% 0.00009 0% 0.00009 0% Flusilazole 1 0.00180 27% 0.00180 27% 0.00180 27% 0.00180 27% Flutolanil 1 0.00059 0% 0.00059 0% 0.00059 0% 0.00059 0% Flutriafol 4 0.00030 0% 0.00031 0% 0.00075 1% 0.00104 2% Fluxapyroxad 3 0.00042 1% 0.00061 1% 0.00066 1% 0.00069 1% Hexythiazox 11 0.00098 8% 0.00055 5% 0.00103 9% 0.00813 68% Imidacloprid 15 0.00021 0% 0.00025 0% 0.00031 0% 0.00058 1% Indoxacarb 8 0.00022 4% 0.00018 3% 0.00050 9% 0.00092 17% Iprodione 19 0.00690 2% 0.00550 1% 0.01569 4% 0.04825 12% Iprovalicarb 8 0.00067 3% 0.00080 4% 0.00169 8% 0.00309 15% Kresoxim-methyl 10 0.00168 0% 0.00135 0% 0.00449 0% 0.00989 1% Lufenuron 18 0.00082 6% 0.00064 5% 0.00125 9% 0.00702 53% Malathion 1 0.00005 - 0.00005 - 0.00005 - 0.00005 -Mandipropamid 12 0.00647 3% 0.00127 1% 0.00395 2% 0.06793 30% Mepanipyrim 4 0.00062 1% 0.00111 1% 0.00125 1% 0.00134 1% Metalaxyl (metalaxyl-M) 3 0.00099 1% 0.00140 1% 0.00205 2% 0.00249 2% Methiocarb 15 0.00345 20% 0.00176 10% 0.01306 * 75% 0.02184 * 126% Methoxyfenozide 14 0.00047 0% 0.00063 0% 0.00088 1% 0.00193 1% Metrafenone 3 0.00025 0% 0.00035 0% 0.00038 0% 0.00040 0% Myclobutanil 4 0.00019 0% 0.00025 1% 0.00027 1% 0.00028 1% Nitrothal-isopropyl 1 0.00025 - 0.00025 - 0.00025 - 0.00025 -Novaluron 1 0.00964 - 0.00964 - 0.00964 - 0.00964 -Oxycarboxin 1 0.00005 - 0.00005 - 0.00005 - 0.00005 -Paclobutrazol 3 0.00083 1% 0.00120 1% 0.00187 1% 0.00231 2%
Int. J. Environ. Res. Public Health 2017, 14, 526 14 of 19 Table 3. Cont. Active Substance N PDE (Mean) (mg/kg bw per day) SE (Mean) in % of AOEL PDE (75th P) (mg/kg bw per day) SE (75th P) in % of AOEL PDE (90th P) (mg/kg bw per day) SE (90th P) in % of AOEL PDE (Maximum) (mg/kg bw per day) SE (Maximum) in % of AOEL Penconazole 1 0.00037 1% 0.00037 1% 0.00037 1% 0.00037 1% Permethrin 1 0.00011 - 0.00011 - 0.00011 - 0.00011 -Picoxystrobin 5 0.00063 1% 0.00009 0% 0.00180 3% 0.00294 5% Piperonyl-butoxyde 9 0.00019 - 0.00016 - 0.00042 - 0.00100 -Pirimicarb 3 0.00008 0% 0.00010 0% 0.00010 0% 0.00011 0% Pirimiphos-methyl 1 0.00007 0% 0.00007 0% 0.00007 0% 0.00007 0% Prochloraz 13 0.00136 5% 0.00118 4% 0.00300 11% 0.00869 33% Procymidone 17 0.00225 14% 0.00178 11% 0.00744 47% 0.01199 75% Profenofos 1 0.00004 - 0.00004 - 0.00004 - 0.00004 -Propamocarb 13 0.00219 1% 0.00177 0% 0.00553 1% 0.01454 4% Propiconazole 4 0.00009 0% 0.00010 0% 0.00015 0% 0.00018 0% Pymetrozine 9 0.00021 1% 0.00021 1% 0.00041 1% 0.00080 2% Pyraclostrobin 10 0.00168 8% 0.00197 10% 0.00576 29% 0.00633 32% Pyridaben 6 0.00186 28% 0.00195 29% 0.00524 * 79% 0.00799 * 120% Pyridalyl 13 0.00050 2% 0.00049 2% 0.00116 4% 0.00178 7% Pyrimethanil 5 0.00027 0% 0.00031 0% 0.00061 0% 0.00081 1% Pyriproxyfen 1 0.00004 0% 0.00004 0% 0.00004 0% 0.00004 0% Simazine 1 0.00006 - 0.00006 - 0.00006 - 0.00006 -Spinetoram 5 0.00005 1% 0.00006 1% 0.00006 1% 0.00007 1% Spinosad 7 0.00042 3% 0.00018 1% 0.00109 7% 0.00239 15% Spirodiclofen 1 0.00570 48% 0.00570 48% 0.00570 48% 0.00570 48% Spiromesifen 1 0.00007 0% 0.00007 0% 0.00007 0% 0.00007 0% Spirotetramat 6 0.00020 0% 0.00030 0% 0.00037 1% 0.00040 1% Spiroxamine 16 0.00103 5% 0.00179 9% 0.00232 12% 0.00294 15% Tebuconazole 8 0.00092 2% 0.00092 2% 0.00247 6% 0.00426 11% Tebufenozide 1 0.00044 4% 0.00044 4% 0.00044 4% 0.00044 4% Tebufenpyrad 2 0.00046 3% 0.00066 5% 0.00077 6% 0.00085 6% Tetraconazole 1 0.00011 0% 0.00011 0% 0.00011 0% 0.00011 0% Tetrahydrophtalimide 1 0.00006 - 0.00006 - 0.00006 - 0.00006 -Tetramethrine 1 0.00012 0% 0.00014 0% 0.00015 0% 0.00016 0% Thiabendazole 2 0.00099 4% 0.00065 2% 0.00292 11% 0.00506 19% Thiacloprid 9 0.00084 1% 0.00065 1% 0.00252 2% 0.00319 3% Thiametoxam 11 0.00025 0% 0.00037 0% 0.00055 1% 0.00066 1% Thiophanate methyl 7 0.00010 0% 0.00012 0% 0.00015 0% 0.00016 0% Tolclofos-methyl 4 0.00015 0% 0.00015 0% 0.00015 0% 0.00015 0% Triadimefon (triadimenol) 1 0.00046 1% 0.00067 1% 0.00106 1% 0.00151 2% Trifloxystrobin 10 0.00008 0% 0.00008 0% 0.00008 0% 0.00008 0% Triflumizole 1 0.00016 0% 0.00021 1% 0.00025 1% 0.00027 1%
4. Discussion
A linear relationship exists between the levels of dislodgeable residue and the dermal exposure [40–42]. Contact with contaminated flowers resulted in the transfer of pesticide residues to gloves worn by florists. All glove samples appeared to be highly contaminated by many different pesticide residues (111 active substances detected with an average of about 37 active substances per sample and a total concentration per glove sample of 22.22 mg/kg). These concentrations are 1000 times higher than the concentrations which are usually detected on foodstuffs. Half of the detected active substances are insecticides and the other half are fungicides. Only one substance is a growth regulator (paclobutrazol) and another one is a herbicide (simazine). Three fungicides (benomyl and its metabolite carbendazim, boscalid, and iprodione) and three insecticides (clofentezine, lufenuron, and flonicamid) are the most frequently detected active substances (90% of the samples). Twenty eight active substances (25%) are detected only once.
The maximum residue concentrations are measured for boscalid, clofentezine, iprodione, and mandipropamid (26.21, 18.37, 16.93, and 16.50 mg/kg, respectively). Boscalid, novaluron, clofentezine, iprodione, and spirodiclofen present the highest average concentrations, with 3.47 and 3.38, 2.88, 2.42, and 2 mg/kg, respectively. Boscalid is the active substance that has both the highest average and maximum concentrations out of all the active substances analysed.
Of the 111 detected active substances, most of the pesticides belong to the following chemical groups: triazoles (13 a.s.); pyrethroids (8 a.s.); organophosphates (7 a.s.); carbamates and strobilurins (6 a.s.); and benzoylurea, keto-enol, and neonicotinoids (4 a.s.). Pesticides from these families are known for their toxicological properties (acute toxicity, with an action on the nervous system). Many active substances detected in the glove samples may affect the skin of the florists after exposure by contact (allergic reaction: 23; skin irritation: 5; harmful in contact with skin: 5; severe skin burns and eye damage: 1; toxic in contact with skin: 1). However, there are no active substances that could be fatal in contact with skin. According to the CLP (classification, labelling, and packaging) classification (Table2), some of these active substances have potential hazardous chronic effects. Seven active substances are suspected of damaging fertility or the unborn child, two may damage fertility or the unborn child, one may cause genetic defects, one is suspected of causing genetic defects, and another one may cause harm to breast-fed children. Moreover, ten active substances are also suspected of causing cancer after prolonged or repeated exposure. The potential health effects of these hazards are in accordance with symptoms recorded in various publications. In the survey of Morse et al. [3] the symptoms most frequently reported by the florists after exposure are headaches (20%), skin irritation (20%), and watery eyes (20%). In the survey of Restrepo et al. [13], a moderate increase in the prevalence of abortion, prematurity, and congenital malformations for pregnant female workers in floriculture was noted. During the interviews conducted by Toumi et al. [4], only one florist mentioned frequent headaches and recurrent tiredness, but many of them declared suffering from various symptoms like skin allergy, eye irritation, itching of their skin, respiratory problems, thyroid problems and even, for two out of 25, cancer. These testimonies should of course be considered with caution when no diagnosis can support such declarations. Based on repeated observations of workers who are regularly exposed to pesticides at concentrations above their AOEL, such exposures can result in adverse health effects.
The potential dermal exposures of florists were estimated for the average, for different percentiles, and for the maximum concentration of residues in samples (Table3). The results from the different percentiles used to estimate PDE vary by orders of magnitude. As was shown in Table3, no active substance exceeds the AOEL for PDEmean and PDE P75 values. However, at the P90 and at the maximum (or worst case) values of PDE, three and five active substances respectively exceed the AOEL indicating risk situations. The potential dermal exposure values are in accordance with Thongsinthusak et al. [43] and Brouwer et al. [29]. They have respectively reported contamination levels of 0.0005 mg/kg bw per day after handling chrysanthemums and roses and 0.1714 mg/kg bw per day during cutting, sorting, and bundling of roses. For a vast majority of active substances, PDE values obtained in our trial have the same order of magnitude. Even for the worst cases of exposure
Int. J. Environ. Res. Public Health 2017, 14, 526 16 of 19
(e.g., clofentezine or methiocarb), the values are rather similar to previously reported data. Only results of dermal exposure reported by Brouwer et al. [17] for workers in contact with flowers at the field were significantly higher. Average exposures of 0.8571 mg/kg bw per day during cutting and 0.6000 mg/kg bw per day during sorting and bundling of carnations were observed. The short elapsed time between application of pesticides and the re-entry of workers as well as the application rates and the nature of their activities could explain a higher transfer of residues after contact. Nevertheless, the comparison between those previous studies and our results should be considered with caution as local situations are different and practises have evolved with time.
For the systemic exposure, one active substance (clofentezine) exceeds the AOEL at the P90 predictive level. In the worst case, SEMAX(at the maximum concentrations), four active substances (clofentezine, famoxadone, methiocarb, and pyridaben) exceed their respective AOEL values. Among the 14 most frequently detected active substances, two have SEMAX values exceeding the AOEL. Exposure could be particularly critical for clofentezine with SEMAXvalues that are four times higher the AOEL (393%).
For the actual dermal exposure (ADE), whatever the PDE values considered, it is interesting to confirm that no active substances exceed the AOEL when the florists are wearing PPE. A few studies on workers have confirmed that protective clothing [44,45] and gloves [46] can reduce the amount of pesticides reaching the skin. It is assumed today that their potential dermal exposure can be reduced by 90% when workers protect themselves with appropriate PPE [15]. Nevertheless, the survey conducted in Belgium [4] showed that this scenario is not representative of their habits; the majority of florists do not wear gloves, or any other PPE, even if they spend 2 to 6 h per day handling cut flowers and preparing bouquets.
5. Conclusions
In conclusion, the exposure of florists is an example of a unique situation in which a professional is exposed regularly to both a very high number of toxic chemicals and rather high concentration levels. According to the results of the risk assessment, Belgian florists who handle a large number of flowers are at risk of exposure to pesticides residues with potential effects on their health. To better assess the risk, bio-monitoring of the florists with analysis of their blood, urines, and hairs is still to be investigated.
Meanwhile, to reduce their exposure, solutions could be recommended. The priority should be to raise the level of awareness among the florists who can change their habits and practices if they want to minimize their exposure. Wearing gloves, washing their hands and their arms, and respecting hygiene rules could be effective. In the near future, it is necessary to promote a better pesticide management at the field level (integrated pest management, certification schemes, and labels) or even organic flower production if clients are ready to pay. Moreover, extending the European regulation on maximum residue limits (Regulation (EC) N◦396/2005) for pesticide residues on flowers or controlling the residue levels on cut flowers could also be discussed.
Acknowledgments: The authors would like to express their gratitude to the Ministry of Agriculture and the Ministry of Research and Higher Education of Tunisia for their financial support. Many thanks go to the Belgian florists for their kind participation to this study. Laure Joly is grateful to Martine Deridder and Martine Vanhouche for the daily pesticides standard management and for the financial support provided by the Belgian Federal Agency for the Safety of the Food Chain (AFSCA-FAVV).
Author Contributions:This research was undertaken as part of Khaoula Toumi’s Doctor of Phytopharmacy thesis. Bruno Schiffers is the promoter of this thesis. All authors contributed significantly to the successful completion of this research work both intellectually and financially. Accordingly, they conceived and designed the study plan. Khaoula Toumi conducted sampling, analyzed the data, and wrote the intial manuscript. Bruno Schiffers guided this study and provided revisions on the manuscript. Laure Joly and Christiane Vleminckx provided feedback on the manuscript. Finally, all the authors have read and approved the final manuscript.
References
1. Cooper, J.; Dobson, H. The benefits of pesticides to mankind and the environment. Crop Prot. 2007, 26, 1337–1348. [CrossRef]
2. Bethke, J.A.; Cloyd, R.A. Pesticide use in ornamental production: What are the benefits? Pest Manag. Sci.
2009, 65, 345–350. [CrossRef] [PubMed]
3. Morse, D.L.; Baker, E.L.; Landrigan, P.J. Cut flowers: A potential pesticide hazard. Am. J. Public Health 1979, 69, 53–56. [CrossRef] [PubMed]
4. Toumi, K.; Vleminckx, C.; Van Loco, J.; Schiffers, B. Pesticide residues on three cut flower species and potential exposure of florists in Belgium. Int. J. Environ. Res. Public Health 2016, 13, 943. [CrossRef] [PubMed] 5. Toumi, K.; Vleminckx, C.; Van Loco, J.; Schiffers, B. A survey of pesticides residues in cut flowers from
various countries. Commun. Appl. Biol. Sci. Ghent Univ. 2016, 81, 493–502.
6. Rikken, M. Le Marché Européen des Fleurs et Plantes Équitables et Durables (The European Market for Equitable and Sustainable Flowers and Plants). Available online:http://www.befair.be/sites/default/files/ all-files/brochure/Le%20march%C3%A9%20europ%C3%A9en%20des%20fleurs%20et%20plantes%20% C3%A9quitables%20et%20dur%E2%80%A6_0.pdf(accessed on 1 March 2017).
7. Baldi, I.; Cordier, S.; Coumoul, X.; Elbaz, A.; Gamet-Payrastre, L.; Le Bailly, P. Pesticides: Effets sur la Santé; Inserm (Institut National de la Santé et de la Recherche Médicale): Paris, France, 2013; pp. 22–34.
8. World Health Organization. The WHO Recommended Classification of Pesticides by Hazard and Guidelines to Classification 2004; World Health Organization: Geneva, Switzerland, 2004.
9. Dasgupta, S.; Meisner, C. Health Effects and Pesticide Perception as Determinants of Pesticide Use: Evidence from Bangladesh; World Bank Group: Bangladesh, South Africa, 2005.
10. Fleming, L.E.; Bean, J.A.; Rudolph, M.; Hamilton, K. Cancer incidence in a cohort of licensed pesticide applicators in Florida. J. Occup. Environ. Med. 1999, 41, 279–288. [CrossRef] [PubMed]
11. Munnia, A.; Puntoni, R.; Merlo, F.; Parodi, S.; Peluso, M. Exposure to agrochemicals and DNA adducts in Western Liguria, Italy. Environ. Mol. Mutagen. 1999, 34, 52–56. [CrossRef]
12. Bolognesi, C. Genotoxicity of pesticides: A review of human biomonitoring studies. Mutat. Res. 2003, 543, 251–272. [CrossRef]
13. Restrepo, M.; Munoz, N.; Day, N.E.; Parra, J.E.; de Romero, L.; Nguyen-Dinh, X. Prevalence of adverse reproductive outcomes in a population occupationally exposed to pesticides in Colombia. Scand. J. Work Environ. Health 1990, 16, 232–238. [CrossRef] [PubMed]
14. Lu, J.L. Risk factors to pesticide exposure and associated health symptoms among cut-flower farmers. Int. J. Environ. Health Res. 2005, 15, 161–170. [CrossRef] [PubMed]
15. European Food Safety Authority (EFSA). Guidance on the assessment of exposure of operators, workers, residents and bystanders in risk assessment for plant protection products. EFSA J. 2014, 12, 3874.
16. U.S. Environmental Protection Agency (U.S. EPA). Pesticide Assessment Guidelines, Subdivision U, Applicator Exposure Moniotoring; U.S. Environmental Protection Agency (U.S. EPA): Washington, DC, USA, 1986. 17. Brouwer, D.H.; Brouwer, R.; Mik, G.D.; Maas, C.L.; Hemmen, J.J.V. Pesticides in the cultivation of carnations
in greenhouses: Part I—Exposure and concomitant health risk. Am. Ind. Hyg. Assoc. J. 1992, 53, 575–581. [CrossRef] [PubMed]
18. Brouwer, R.; Brouwer, D.H.; Tijssen, S.C.; Hemmen, J.J.V. Pesticides in the cultivation of carnations in greenhouses: Part II—Relationship between foliar residues and exposures. Am. Ind. Hyg. Assoc. J. 1992, 53, 582–587. [CrossRef] [PubMed]
19. Kangas, J.; Manninen, A.; Liesivuori, J. Occupational exposure to pesticides in Finland. Int. J. Environ. Anal. Chem. 1995, 58, 423–429. [CrossRef]
20. Methner, M.M.; Fenske, R.A. Pesticide exposure during greenhouse applications. III. Variable exposure due to ventilation conditions and spray pressure. Appl. Occup. Environ. Hyg. 1996, 11, 174–180. [CrossRef] 21. Illing, H.P.A. Is working in greenhouses healthy? Evidence concerning the toxic risks that might affect
greenhouse workers. Occup. Med. 1997, 47, 281–293. [CrossRef]
22. Ecobichon, D.J. Occupational Hazards of Pesticide Exposure: Sampling, Monitoring, Measuring; CRC Press: Boca Raton, FL, USA, 1998.
Int. J. Environ. Res. Public Health 2017, 14, 526 18 of 19
23. Van Hemmen, J.J.; Brouwer, D.H. Assessment of dermal exposure to chemicals. Sci. Total Environ. 1995, 168, 131–141. [CrossRef]
24. Rajan-Sithamparanadarajah, R.; Roff, M.; Delgado, P.; Eriksson, K.; Fransman, W.; Gijsbers, J.H.J.; Van Hemmen, J.J. Patterns of dermal exposure to hazardous substances in European Union workplaces. Ann. Occup. Hyg. 2004, 48, 285–297. [PubMed]
25. Lesmes-Fabian, C.; García-Santos, G.; Leuenberger, F.; Nuyttens, D.; Binder, C.R. Dermal exposure assessment of pesticide use: The case of sprayers in potato farms in the Colombian highlands. Sci. Total Environ. 2012, 430, 202–208. [CrossRef] [PubMed]
26. U.S. EPA (U.S. Environmental Protection Agency). Agricultural Transfer Coefficients; Policy No 003.1 (dated August 7); Science Advisory Council for Exposure, Health Effects Division, Office of Pesticide Programs: Washington, DC, USA, 2000.
27. U.S. EPA (U.S. Environmental Protection Agency). Science Advisory Council for Exposure, Policy Number 12, Recommended Revisions to the Standard Operating Procedures (SOPs) for Residential Exposure Assessments; Office of Pesticide Programs, Health Effects Division: Washington, DC, USA, 2001.
28. EU—Pesticides Database. Available online:ec.europa.eu/food/plant/pesticides/eu-pesticides-database/ public/?event=activesubstance.selection&language=EN(accessed on 1 March 2017).
29. Brouwer, R.; Marquart, H.; de Mik, G.; Van Hemmen, J.J. Risk assessment of dermal exposure of greenhouse workers to pesticides after re-entry. Arch. Environ. Contam. Toxicol. 1992, 23, 273–280. [CrossRef] [PubMed] 30. Organisation for Economic Co-operation and Development. Guidance Document for the Conduct of Studies of Occupational Exposure to Pesticides during Agricultural Application; OECD Environmental Health and Safety Publications, Series on Testing and Assessment. OCDE/GD (97); Environmental Directorate: Paris, France, 1997.
31. Association of Official Analytical Chemists. AOAC official method 2007.01 pesticide residues in Foods by acetonitrile extraction and partitioning with magnesium sulfate gas chromatography/mass spectrometry and liquid chromatography/tandem mass spectrometry first action 2007. J. AOAC Int. 2007, 90, 485–520. 32. European Commission. Guidance Document on Analytical Quality Control and Method Validation Procedures for
Pesticides Residues Analysis in Food and Feed; SANTE/11945/2015; European Commission: Brussels, Belgium, 2015; p. 42.
33. Van Loco, J.; Beernaert, H. An alternative method validation strategy for the European Decision 2002/657/EC. In Proceedings of the Euro Food Chem XII: Strategies for Safe Food, Brugge, Belgium, 23–26 September 2003; Volume 1, pp. 91–94.
34. U.S. EPA (U.S. Environmental Protection Agency). Dermal Exposure Assessment: A Summary of EPA Approaches; U.S. Environmental Protection Agency: Washington, DC, USA, 2007.
35. European Food Safety Authority (EFSA). Guidance on selected default values to be used by the EFSA Scientific Committee, Scientific Panels and Units in the absence of actual measured data. EFSA J. 2012, 10, 2579.
36. AGP—List of Pesticides Evaluated by JMPS and JMPR. Available online:www.fao.org/agriculture/crops/ thematic-sitemap/theme/pests/lpe/en/(accessed on 1 March 2017).
37. FAO Plant Production and Protection Paper Series. JMPR Reports. Available online: www.who.int/ foodsafety/publications/jmpr-reports/en/(accessed on 1 March 2017).
38. Joint Meeting on Pesticide Residues (JMPR). Monographs & Evaluations. The International Programme on Chemical Safety Website. Available online:www.inchem.org/pages/jmpr.html(accessed on 1 March 2017). 39. European Commission. Regulation (EC). No. 1272/2008 of the European Parliament and of the Council of
16 December 2008; European Commission: Brussels, Belgium, 2009; p. 1355.
40. Popendorf, W.J.; Leffingwell, J.T. Regulating OP pesticide residues for farmworker protection. In Residue Reviews; Springer: New York, NY, USA, 1982; pp. 125–201.
41. Nigg, H.N.; Stamper, J.H.; Queen, R.M. The development and use of a universal model to predict tree crop harvester pesticide exposure. Am. Ind. Hyg. Assoc. J. 1984, 45, 182–186. [CrossRef] [PubMed]
42. Zweig, G.; Leffingwell, J.T.; Popendorf, W. The relationship between dermal pesticide exposure by fruit harvesters and dislodgeable foliar residues. J. Environ. Sci. Health Part B 1985, 20, 27–59. [CrossRef] [PubMed]
43. Thongsinthusak, T.; Ross, J.; Fong, H.; Formoli, T.; Krieger, R. Estimation of Exposure of Persons in California to Pesticide Products That Contain Abamectin. HS-1567; California Department of Food and Agriculture: Sacramento, CA, USA, 1990.
44. McCurdy, S.A.; Hansen, M.E.; Weisskopf, C.P.; Lopez, R.L.; Schneider, F.; Spencer, J.; Schenker, M.B. Assessment of azinphos-methyl exposure in California peach harvest workers. Arch. Environ. Health Int. J. 1994, 49, 289–296. [CrossRef] [PubMed]
45. Krieger, R.I.; Dinoff, T.M. Malathion deposition, metabolite clearance, and cholinesterase status of date dusters and harvesters in California. Arch. Environ. Contam. Toxicol. 2000, 38, 546–553. [CrossRef] [PubMed] 46. Gomes, J.; Lloyd, O.L.; Revitt, D.M. The influence of personal protection, environmental hygiene and exposure to pesticides on the health of immigrant farm workers in a desert country. Int. Arch. Occup. Environ. Health 1999, 72, 40–45. [CrossRef] [PubMed]
© 2017 by the authors. Licensee MDPI, Basel, Switzerland. This article is an open access article distributed under the terms and conditions of the Creative Commons Attribution (CC BY) license (http://creativecommons.org/licenses/by/4.0/).