Treatment and assessment of the CO
2-exchange at a complex forest site in
Thuringia, Germany
Corinna Rebmanna, Marcelo Zerib, Gitta Lasslopa, Martina Munda, Olaf Kollea, Ernst-Detlef Schulzea, Christian
Feigenwinterc,d
a Max Planck Institute for Biogeochemistry, Biogeochemical Processes, Hans-Knoell-Strasse 10, D-07745 Jena,
Germany
b Energy Biosciences Institute, 1206 West Gregory Drive, MC-195 Urbana, IL 61820, USA
c Faculté Universitaire des Sciences Agronomiques de Gembloux, Unité de Physique des Biosystèmes, Avenue de
la Faculté 8, B-5030 Gembloux, Belgium
d University of Basel, Institute of Meteorology, Climatology and Remote Sensing, Klingelbergstrasse 27,
CH-4056 Basel, Switzerland
Keywords: Managed spruce Eddy covariance Advection Complex terrain Carbon balance ADVEX
Abstract
Eddy covariance measurements were carried out at the Wetzstein site in Thuringia, Germany since December 2001. Soon after the start of the measurements night-time fluxes well above average CO2-fluxes measured in
temperate forest ecosystems were detected which could not be explained by biological processes but were valid with respect to standard quality criteria. The Wetzstein site is part of the CarboEurope-IP flux-network and the CO2-exchange of this spruce forest is of general ecological interest as the site is typical for central European
spruce forest ecosystems at mountainous elevation. Additional investigations were made in order to identify the causes for the large difference between the flux balance and the inventory based NEP. Specific weather patterns and micrometeorological situations were identified during which a decoupling of the flows above and below the canopy leads to additional CO2-effluxes at the tower site which are not part of the net ecosystem exchange
(NEE) at night. Rejecting data from these periods and gap-filling thereafter results in yearly sums of NEE, GPP and TER which are in better agreement with the biometric measurements at the tower site and comparable to other spruce forest sites. In this process ecosystem respiration was determined not only from extrapolation of nighttime data but also from flux partitioning based on day-time data using the hyperbolic light response function. It can be shown that flux measurements at this complex site need to be treated in a modified procedure compared to what is generally performed, namely extrapolating ecosystem respiration from night-time data. Using multiple data sources and applying a careful filtering of the data, confidence in the estimates of the carbon balance components increased.
1. Introduction
The exchange of carbon dioxide between ecosystems and the atmosphere is an important component of the global carbon cycle, with forests contributing to about 50% to the net amount of carbon fixed in terrestrial vegetation (Grace, 2005). The growth rates of forests are known to be increasing (Nemani et al., 2003; Schulze, 2006). Thus ecological research is interested in continuous monitoring of the carbon exchange of forests to identify carbon budgets and their trends worldwide (Baldocchi et al., 2001). The eddy covariance technique is the most established tool for deriving the long-term balance of net ecosystem exchange of CO2 (NEE) since the
seminal dataset at Harvard Forest in the early 1990s (Wofsy et al., 1993). With the eddy flux approach source areas ranging between a hundred meters and several kilometers are sampled in situ and without any disturbance so that interrelations between CO2-exchange and climatic factors can be elucidated (Baldocchi, 2003). But the
accuracy of this method is only true over flat, homogenous surfaces as certain assumptions have to be made (Kaimal and Finnigan, 1994). However, forest ecosystems are often located in hilly and patchy regions where these assumptions cannot be met. This is the case for the Wetzstein site in Thuringia, Germany which has a complex topography with the measuring tower on the top of a crest (Fig. 1). Quality tests such as presented by Foken and Wichura (1996) can help to identify situations when environmental conditions do not fulfil the requirements needed for fully developed turbulence.
Usually it has been reported that nocturnal carbon efflux is underestimated by the eddy covariance technique during calm and stable nights even if including the change in storage of CO2 below the flux sensors (Goulden et
al„ 1996; Aubinet et al„ 2000; Miller et al., 2004) which has to be added to the turbulent fluxes if measuring above tall vegetation because of insufficient vertical mixing in the canopy space. At the Wetzstein site night-time
fluxes of CO2 showed a very anomalous behaviour with half-hourly values up to about 20 µmol m-2 s-1 or higher
often lasting several hours during nights, as reported by Anthoni et al. (2004), albeit having applied restrictive quality tests (Foken and Wichura, 1996). Nocturnal NEE does not level off if plotted against the friction velocity u*. A similar behaviour of night-time fluxes had also been reported by Van Gorsel et al. (2007) for a temperate Eucalyptus forest in southeast Australia. The apparent flux balance is close to zero for this young Eucalypt forest stand which shows maximum rates of growth. Venting anomalies with extreme CO2-fluxes were also reported by
Cook et al. (2004) with even higher CO2-fluxes of up to 80 µmol m-2 s-1 indicating transport of pooled CO2 to
their flux measuring system.
Fig. 1. Topographic map of the Wetzstein area with age classes of the spruce forest (distinguished by grey scale), tower positions (main tower: MT, slope tower: ST, ADVEX towers: A, B, D and C, small towers: triangles), and area of intensive soil respiration measurements. Thick lines represent the topography, thin and dotted lines represent borders of forestry sections (marked with a1, a2, ...).
Zeri (2008) investigated the occurrence of high nocturnal fluxes of CO2 at this site and found that they were
associated with southwest winds (the main wind direction at the site), neutral stratification and high values of u*, as shown in Fig. 2. Additionally, the analysis of wind directions measured at the main tower at the hillcrest and at the slope tower revealed that the above- and below-canopy flows were not always coupled. For the hillcrest, the coupling of wind direction above and below the canopy for different classes of friction velocity (u*) and stratification regime (ζ = (z- d)/L, with z: measuring height, d: displacement height, I: Obukhov-length) revealed the existence of wind shear below the canopy. The decoupling was observed for south-west winds when u* was higher than approximately 0.5 ms_1 and the surface layer was neutrally stratified, the same conditions associated
with the unusually high nocturnal fluxes. The sub-canopy wind directions (1.5 m) varied between 200° and 300° when the wind direction at 30 m was approximately 240° (Zeri et al., 2010). The wind shear was most probably caused by the sub-canopy flow following the easiest way downhill, given that the tower is located near the edge of the plateau. Wind shear was also observed at the slope tower for south-west winds, as the sub-canopy flow follows the slope.
With the establishment of several additional measurements in the surrounding of the main flux tower and an extensive 3D-advection experiment (Feigenwinter et al., 2008) we tried to detect possible influences of advective contributions to the fluxes which might explain the unusual fluxes measured by the eddy covariance technique at the Wetzstein site. Results of the experiment performed at the Wetzstein site are discussed in detail in Zeri et al.
(2010), Aubinet et al. (2010) and Feigenwinter et al. (2008). Main findings of the advection experiment were that measured advective fluxes cannot be directly used to determine NEE on a half-hourly basis because of their large scatter. On average vertical as well as horizontal advection values were low even though specific wind sectors and micrometeorological conditions could be pointed out where advective fluxes reached considerable values (Feigenwinter et al., 2008). These conditions occur usually for cross-ridge wind directions at the site, which however are comparably rare (about 11%).
The difficulty to apply advective fluxes for the determination of NEE leads to the question whether it is possible to ascertain reliable estimates of annual carbon exchange rates despite the complexity of a site, and if derived procedures may be applicable to other sites situated in complex terrain.
2. Materials and methods
2.3. Site description
The research site Wetzstein is located in Thuringia, a state of the Federal Republic of Germany, near the village Lehesten on a plateau in a mountain range (50°27'N, 11°27'E, 785 m a.s.l.). The ridge is oriented approximately to north-northeast with steep slopes to the ESE and WNW. The main tree species at the site is an even aged Norway spruce (Picea abies) plantation, about 22 m tall with a stand age of ~50 years (Fig. 1). Ground vegetation is very sparse with patches of moss. Leaf area index determined with an LAI-2000 system (LiCor Inc., Lincoln, USA) as the average of 20 fixed measurement points in the main wind direction is about 7 m2 m-2
(corrected for clumping of needles according to LAI-2000 manual).
Eddy covariance measurements together with the acquisition of basic meteorological parameters started in December 2001. Due to heavy ice coating of the sonic anemometer reliable measurements could only be achieved starting from spring 2002.
A good fetch of 1-2 km exists in almost all wind directions. About 1 km from the tower to the south is a cleared area about 0.5 km2 in size. According to the footprint modelling this clearing affects the measurements only
under stable atmospheric conditions. Overall, in 90% of all half-hour footprint model calculations the fluxes contributed from areas with at least 80% spruce coverage as determined by an updated site evaluation with a Lagrangian stochastic footprint model combined with a quality assessment (Göckede et al., 2008). Only for a narrow wind sector around 110° flux data were rated 3-7 (intermediate quality concerning stationarity and integral turbulence characteristics according to Foken and Wichura, 1996) during stable to neutral stratification. This reduced quality can most probably be attributed to flow distortion induced by the instrumentation setup. The impact on the overall site performance is minor because the wind is blowing from the sector between 105° and 115° for less than 1.8% of the flux data.
2.2. Measurement system
Turbulent fluxes of momentum, sensible and latent heat and carbon dioxide were measured with the eddy covariance technique (Aubinet et al., 2000), using a research grade sonic anemometer (model 1210R3, Gill Instruments, Lymington, UK) and an infrared gas analyzer (IRGA) model LI6262 or LI7000 (LiCor Inc., Lincoln, NE, USA) operated in absolute mode. Air from the immediate vicinity of the sonic was drawn through a sampling tube (inner diameter 4.1 mm) and two aerosol filters, one at the inlet and one before the analyzer and pushed through the IRGA with a membrane pump. The flow rate was controlled at about 8 1 min-1, which should
provide turbulent airflow in the tubing (Reynolds number of about 2700) to minimize frequency losses and prevent the formation of condensation in the tubing. Until 2004 the tubing length was about 30 m with the analyzer placed in a hut close to the tower base. In 2004 an additional analyzer was installed almost on top of the tower which allowed to reduce the tubing length to about 5 m and thus minimizing the influence of vapour pressure deficit on H2O time lags. After an overlapping period of about 3 months from August to November with
two analyzers running in parallel, confidence about the reliability of CO2- and H2O-fluxes measured by the
Fig. 2. Frequency of occurrence of high night-time fluxes in 2006 depending on wind direction (a), friction velocity (b), and atmospheric stability ζ (c). NEE sorted into 3 classes: white: night-time NEE <5 µmol m-2 s-1,
grey: 5 µmol m-2 s-1 < NEE < 10 µmol m-2 s-1 black: NEE > 10 µmol m-2 s-1.
Data from the sonic anemometer together with CO2- and H2O-concentrations ([CO2], and [H2O], respectively)
were sampled with 20 Hz. EDDYSOFT (Kolle and Rebmann, 2007) was used for data-acquisition, online calculation of the fluxes and for post-processing (see Section 2.4). Additional meteorological measurements were sampled and stored with a CR23X data logger and connected AM416 signal multiplexers (Campbell Scientific, Logan, UT, USA). At the top of the tower, air temperature and relative humidity were measured with a humidity/temperature probe HMP35D (Vaisala, Helsinki, Finland), wind speed and direction with a cup anemometer and a wind vane (model A100R and W200P, Vector Instruments, Denbighshire, UK) and additionally with a heated 2D-ultrasonic anemometer (Adolf Thiess GmbH, Göttingen, Germany). Short-and long-wave incoming and outgoing radiation components were measured with a CNR1 net radiometer (Kipp & Zonen, Delft, NL). Short-wave diffuse radiation was acquired with a Kipp & Zonen CM11 sensor (Kipp &
Zonen, Delft, NL), incoming and reflected photosynthetically active radiation with an LI 190 (LiCor Inc., Lincoln, NE, USA) or PAR Lite sensors (Kipp & Zonen, Delft, NL). At ground level measurements included soil temperatures with home-made PT100 sensors at several depths (2, 4, 8,16, 32, and 64 cm), soil moisture withTheta probes (ML-2x, DeltaT, Cambridge, UK) at 8, 16, 32 and 64 cm depth, and soil heat flux with 6 HF3/CN3 heat flux plates (McVan Instruments, Mulgrave, Australia) at 2-3 cm depth.
CO2-concentrations were measured sequentially at 9 levels (0.1, 0.3,1.0, 2.0, 5.0, 9.0,15.0, 23.8 and 30 m) at the
tower with an infrared gas analyzer (LI6262 or LI6251, LiCor Inc., Lincoln, NE, USA). Air is drawn through equal length tubes and concentrations are measured after sufficient time of purging. Each level is measured once within 10 min. The gas analyzers were calibrated manually once a week with calibrated gases. From these measurements storage fluxes of CO2 below the flux measurement level were determined as the time change of an
integrated spline function through the CO2 profile measurements.
2.3. Additional measurements
In order to get further insight into transport processes at the site, additional measurements were established in the surrounding of the main tower.
• ADVEX-campaign: From April 10th until June 19th, 2006 the ADVEX-campaign was running at the Wetzstein site (Feigen-winter et al., 2008). Four additional towers (A-D) around the main tower were equipped with instrumentation for the measurements of [CO2], air temperatures (T) and wind components (u, v, w) at 4
levels (1.5, 4.4, 8.8 and 24 m). On tower C (south-west corner of the square, see Fig. 1) an additional eddy covariance system was mounted on top at 29.4 m height (sonic anemometer model 1210R3, Gill Instruments, Lymington, UK; gas analyzer: LI7500, LiCor Inc., Lincoln, NE, USA). Additionally [CO2] and Γ have been
measured in a crosswise transect between the towers at 1.5 m height. Details concerning measuring devices and data-acquisition are given in Feigenwinter et al. (2008).
• Measurements at the slope of the hill: Along a line south-west from the main tower (the prevailing wind direction) CO2-concentrations (carbon dioxide probes, GMP343, Vaisala, Helsinki, Finland), air temperatures
(Campbell, thermistor Type 107, Campbell Scientific, Logan, UT, USA) and horizontal wind components (2D-ultrasonic anemometers, Thies Type 4.3800.00.140, Germany) were measured at 4 additional points below the canopy in 2 m height (triangles named 'small towers', one at the slope tower, ST, see Fig. 1). In about 1 km distance south-west from the main tower an additional tower (slope tower, ST) was equipped with eddy covariance measurements on top (35 m), basic meteorological measurements (air temperature in 2 m height, short-wave, long-wave and total radiation components), and sonic anemometers in 2 and 8.5 m. Fluxes were acquired and processed as described above and in the next section.
2.4. Post-processing and treatment of eddy covariance data
For the post-processing of the eddy covariance data the software tools of EDDYSOFT (Kolle and Rebmann, 2007) were used. To achieve high quality CO2-fluxes we checked the time series with several objective quality
criteria: the raw data were checked for spikes and unrealistic change rates in the time series of single values with a procedure similar to those described in Vickers and Mahrt (1997). Half-hourly flux averages were discarded when spikes and change rates in the single time series occurred more often than pre-set thresholds. These thresholds were determined with the help of frequency distributions for the respective parameters. Additionally the variances for each contributing parameter (u', ν', W', T’, [CO2]', [H2O]') were checked. Fluxes were discarded
if the variances were outside the range of 95% of all values.
The planar fit technique (Wilczak et al., 2001) was applied sector wise (12 sectors) separate for periods with and without snow cover to above canopy eddy covariance data. Periods with very low wind velocities (<0.05ms-1)
were discarded for this purpose.
As the air is drawn through tubing before CO2- and H2O-concentrations are measured, the time needed to travel
down the tubing has to be determined. This is done by optimizing the correlation coefficient between [CO2]' and
[H2O]' and the vertical wind velocity w' (primes denote deviations from the mean) (McMillen, 1988). It turned
out that CO2 lags are usually very stable, but H2O-lags are strongly depending on vapour pressure deficits of the
air and contamination of the filters and tubing. The dependency of H2O-lags on vapour pressure deficits is thus
Spectral dampening of the high frequency signals is mainly caused by an insufficient time resolution of the gas analyzer but also for example by dampening of the signals while passing through the tubing, or by the sensor separation of the gas analyzer and the sonic anemometer. These combined effects can be treated with a spectral correction model according to Eugster and Senn (1995). Correction factors (inductances) determined for [CO2]-
and [H2O]-signals were around 0.3 and 0.8, respectively, before the tube length was shortened, and have reduced
to about 0.22 and 0.45 thereafter.
Fluxes of momentum, sensible and latent heat and carbon dioxide are calculated with established formulations (Aubinet et al., 2000; Baldocchi, 2003) as half-hourly averages. Half-hourly flux data deviating more than 30% from the stationarity test according to Foken and Wichura (1996) are further excluded. The change in CO2
-storage below the measurement level is added to the turbulent fluxes (Aubinet et al., 2005) to get the net ecosystem exchange (NEE) of CO2.
2.5. Data screening
Night-time flux data at the site are most crucial because they are possibly influenced by drainage flows. Such frequent occurrence of high night-time net ecosystem CO2-fluxes measured by the eddy covariance system at the
Wetzstein site were obviously not caused by respiration of the soil and biomass which makes the partitioning of NEE into gross primary production (GPP) and total ecosystem respiration (TER) uncertain. Therefore night-time data were carefully pre-selected. Unrealistic high night-time CO2-fluxes (NEE, turbulent flux plus storage flux)
can clearly be attributed to specific micrometeorological weather patterns. As a threshold we investigated CO2
-fluxes >5 µmol m-2 s-1. Such high CO
2-fluxes develop mainly for wind directions from southwest with 67% of
half-hourly CO2-fluxes >5 µmol m-2 s-1 between 200° and 280° (Fig. 2a), for strong turbulent mixing with 93%
of high CO2-fluxes occurring for friction velocities u* > 0.4 m s-1 (Fig. 2b), and neutral atmospheric stratification
with 84% of CO2-fluxes larger than 5 µmol m-2 s-1 occurring for -0.05 < ζ < 0.05 (Fig. 2c). These features
indicate upwind transport of enriched air which was pooled in the valley because of drainage. Night-time fluxes for these specific situations were discarded so that a reduced data set was used as basis for the gap-filling and partitioning procedure to avoid biases in TER caused by unrealistic flux data.
2.6. Determination of annual sums of NEE, GPP and TER
Annual sums of NEE were derived with the help of different gap-filling tools. The online tool by Reichstein et al. (2005) has been proven to be the most successful together with neural networks (Moffat et al., 2007). As an independent estimate of TER, day-time CO2-fluxes were used to determine night-time fluxes independent
of the night-time CO2-flux observations (Lasslop et al., 2009). The day-time data based estimates of TER and
GPP are determined by using a rectangular hyperbolic light response curve (Ruimy et al., 1995) extended with the Lloyd and Taylor model (Lloyd and Taylor, 1994) to account for the temperature dependency of respiration, and with a VPD limitation of photosynthesis (called HBLR-method hereafter). Parameters were estimated every 2 days to account for seasonality. Only the temperature sensitivity of the respiration model was estimated using night-time data with a data window of 12 days. The parameter that determines the flux magnitude, the base respiration, and the parameters for the photosynthesis are estimated with a 4 days window of day-time data. Respiration is extrapolated into the night using night-time temperature measurements. The partitioning into both flux components (TER and GPP) is thus independent of the possibly biased eddy covariance night-time data. 2.7. Stem growth measurements
Stem increment data were assimilated from different growth studies carried out in the tower area. They included the results of core samples taken from 551 trees in 2002 and 2003, of rope-dendrometers installed at 5 trees in 2003 and 2004, and of 5 rope-and 13 tape-dendrometers in the following years. All measurements were taken at breast height (1.3 m above ground level) of visually healthy and vital trees, and represented the diameter distribution of the even-age stands within the footprint of the main flux tower.
The tree cores were taken with an increment borer (5 mm in diameter, SUUNTO, Finland), air dried, fixed and cut for tree-ring analysis. Tree-ring widths were measured using the semiautomatic device LINTAB-III Digital Linear Table (410-1/100-HF-130, Frank Rinn Distribution, Heidelberg, Germany, Rinn 1996), and the software TSAP-Win (Professional Version 0.55). Diameter increments were then calculated backwards from the diameter at time of sampling (end of 2003) and multiplying the measured annual ring width by two.
The rope-dendrometers consisted of a steel rope (INVAR steel; thermal elongation coefficient α = 1.6 x 10⁻³
K-1), a measuring rotary disk and a nonius that allows for a minimum reading precision of 0.003 mm in diameter
(construction by W. Ziegler, Max Planck Institute for Biogeochemistry, Jena). The dendrometer tapes were commercially produced Astralon dendrometer tapes (Dl, UMS GmbH, München, Germany, thermal elongation coefficient α = 75 x 10-6 K-1) and had a reading precision of 0.01 mm in diameter. All dendrometers were read
manually every 4 weeks from April to November.
To minimize the influence of tree size on annual diameter increment we normalized the diameter increment to individual tree size (relative diameter increment, RDI).
3. Results
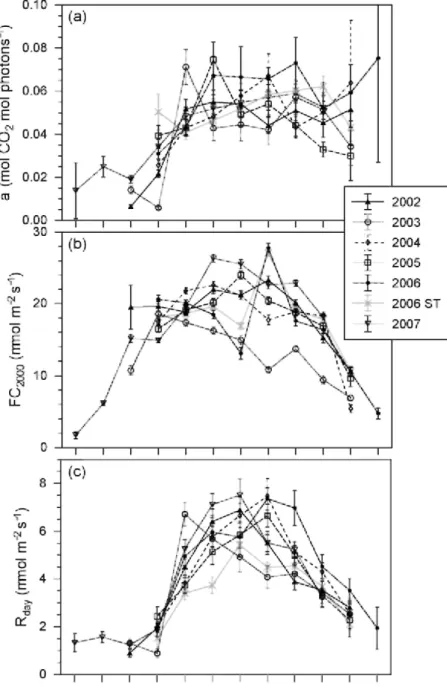
3.1. Day-time fluxes related to environmental parameters
Day-time fluxes of CO2 behave as expected at the site. This can be seen by investigating the factors α (ecosystem
quantum yield), FC2ooo (net CO2-uptake at a photosynthetic photon flux density PPFD equal to 2000 µmol m-2 s -1) and R
day (day-time ecosystem respiration), respectively of the Michaelis-Menten equation for fluxes measured
under positive incoming radiation conditions according to Eq. A.9 in Falge et al. (2001 ). Yearly courses of the three parameters derived from weighted least-square regression analysis (Lasslop et al., 2008) in general show lowest values in spring, maxima in summer and slightly lower values in autumn (Fig. 3), reflecting mainly the seasonal course of temperature and to a lesser extend the phenology of the canopy development. During the dry year of 2003 (Ciais et al., 2005) uptake of CO2 was significantly reduced during the summer months compared to
the other years as reflected by FC2ooo-values (open circles in Fig. 3b). A slight recovery of net CO2-uptake can be
detected in September of the respective year. Rday consistently declined during the summer months of 2003,
starting with a highest respiration rate occurring in May (6.7 µmol m-2 s-1) up to a minimum of about 4.1 µmol
rrr2 s_1 in August and September. In 2006, July was hot and dry (T
avjuly: 20.0 °C, VPDav,July: 10.2 hPa), provoking
a very low value of FC2ooo for this period (13.1 µmol m-2 s-1) determined from data measured at the main tower.
Compared to this value the reduction is less pronounced but also obvious (16.9 µmol m-2 s-1 ) at the slope tower
(ST), probably because of buffering soil moisture conditions in the valley. In contrast, August 2006 was moist (VPDav August: 2.3 hPa) with temperatures below average (Tav,August: 11.9 °C). Thus the spruce trees could benefit
and recover with a higher net uptake of CO2, resulting in an average uptake value of 27.8 µmol m-2 s-1 at the
main tower and 27.1 µmol m-2 s-1 at the slope tower, respectively. This value was the highest determined
throughout the study period at the Wetzstein site and is confirmed by the slope tower measurements. The three parameters α, FC2000 and Rday have their maxima in the temperature range 10-15 °C and for vapour
pressure deficits below 10 hPa, reflecting the adaptation to the comparably low temperatures and moist conditions in this mountainous region.
Maximum net uptake rates (determined as average of the 3 highest measured estimates per day) are clearly influenced by drought effects: during 2003 in only about 3.6% of the days net uptake rates were higher than 20 µmol m-2 s-1 compared to 11.0% in 2002, 7.7% in 2004, 13.4% in 2005 and 8.8% in 2006, respectively.
The reduction in maximum uptake rates during 2003 took place for the entire temperature range. This means that there was no recovery in autumn 2003, when temperatures were average or even below autumn temperatures of other years during which measurements were performed (data not shown). From this analysis one can conclude that 2002 and 2004 were the most favoured years concerning uptake of CO2 by the ecosystem. In 2004 no clear
damage from the 2003 drought was observed. 3.2. Gap-filling and partitioning
Different gap-filling methods were applied on the data sets as described above. If using all high quality half-hourly fluxes as basis for the gap-filling procedure (Reichstein et al., 2005), the resulting annual sums of NEE for the years 2003 until 2007 range from +34 g C m-2 in 2006 to -137 g C m-2 in 2005 (Table 1, NEE
oridata). After
the pre-selection of data with regard to venting events that cause unrealistic high fluxes under specific meteorological conditions, annual sums of NEE range from -63 g C m-2 in 2006 to -246 g C m-2 (Table 1,
NEEselecteddata). The range of yearly NEE sums is -96 g C m-2 in 2006 to -220 g C m-2 in 2007 determined with
the HBLR-method (Table 1, NEEHBLR)·Thus the highest net uptake occurs in different years (Table 1 and Fig. 4)
when using different methods for determining the annual flux. This can partly be explained by climatic
conditions such as the dry summer of 2003 with frequent occurrence of high-pressure situations and winds from easterly directions resulting in less frequent situations (16% of half-hourly fluxes) when high CO2-flux situations
could be assigned and fluxes were gap-filled. But the distribution of these situations over the year has an even bigger influence on resultingannual sums after gap-filling. During the growing season in June and July 2006 (including partly the period during which the ADVEX experiment was running at the site) comparably few data (3% in 2006 compared to almost 20% in 2007) had to be discarded due to the criteria determined as above explained. This is similar in 2003 when during the same summer period only 8% of the half-hourly data had to be discarded. For both of these years the estimates of annual sums of NEE with different gap-filling procedures are more similar as compared to the other years indicating their sensitivity to the gap-filling procedure applied especially during the growing season.
Fig. 3. Seasonal courses of the Michaelis-Menten parameters quantum yield a, net CO2-uptake at optimum light
(PPFD = 2000 µmolm-2 s_1) FC
2ooo and day-time respiration Rday derived from least-square regression analysis
determined on a monthly basis for the years 2002-2007 for the main tower and for 2006 at the slope tower (ST). In this test the number of available data ranges from 368 in October 2002 to 851 in June 2004.
Table 1 Annual sums of net ecosystem exchange (NEE), gross primary productivity GPP and total ecosystem respiration (TER) (gCm-2) for the years 2002-2007 determined with different procedures (ori data: common
gap-filling with exclusion of fluxes measured under low turbulence conditions or low quality, selected data: common gap-filling after pre-selection of night-time fluxes, and HBLR: gap-filling with HBLR-method).
Year NEEOtidata NEEselecte data NEEHBLR GPPselected data GPPHBLR TERselected data TERHBLR
2002 -181 -251 -108 1401 1580 1161 1472 2003 -58 -94 -126 1333 1368 1245 1242 2004 -59 -169 -99 1440 1527 1274 1428 2005 -137 -246 -141 1505 1631 1265 1490 2006 34 -63 -96 1454 1413 1394 1317 2007 -80 -241 -220 1523 1612 1290 1392 Avg -80 -177 -132 1443 1522 1272 1390
Fig. 4. Cumulative curves for NEE (upper panel), GPP (middle panel), and TER (lower panel) for the years 2003-2007 determined with the common gap-filling procedure after pre-selection of data (solid lines) and with the HBLR-method (dashed lines).
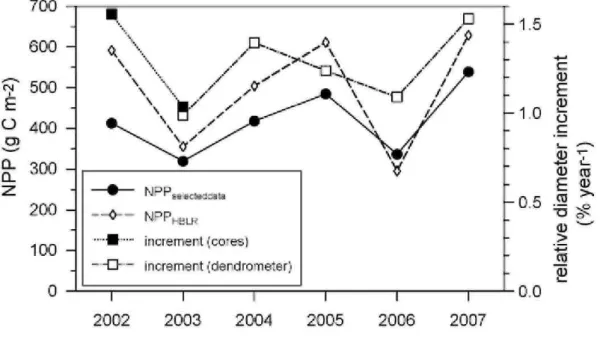
Fig. 5. NPP (using autotrophic respiration obtained in 2006 and 2007) determined with the common gap-filling procedure after pre-selection of data (dots with solid line) and with the HBLR-method (diamonds with dashed line) and relative diameter increment of sample trees in the footprint area of the main tower. Tree core data (full squares) are based on 551 trees, dendrometer data (open squares) are based on 5 trees in 2003 and in 2004, and on 18 trees in the other years, respectively.
The partitioning of NEE in its components gross primary production GPP and total ecosystem respiration TER shows that each of the components is larger if determined with the night-time data independent HBLR-method except for the year 2006 (Fig. 4). On average gross uptake by the ecosystem is 60 g C m-2 higher, but also
ecosystem respiration is higher (about 80 g C m-2). This can also be seen when comparing the cumulative curves
for NEE, GPP and TER on an annual basis for 2003-2007. The largest difference in annual net carbon uptake between the two methods 'classical gap-filling' and HBLR-method of about 100 g C m-2 occurred in 2005, a
"normal" year with respect to climatological conditions and a more evenly distributed number of data to be gap-filled.
3.3. Comparison of flux data with biometric measurements
With the help of the partitioning of soil respiration into autotrophic and heterotrophic components (F. Moyano, personal communication) we can get an estimate of NPP which can be compared with stem increment data measured in the footprint area of the main tower (Fig. 5). Soil respiration accounts for about 50% of TER with about 42% of which is the heterotrophic contribution. From this we can see that the course of NPP determined from eddy covariance data correlates clearly with the stem increment as a biometric measure of NPP, even though NPP determined from the eddy covariance data is still lower than one would expect for spruce
ecosystems in this area (Grünwald and Bernhofer, 2007; Lindroth et al., 2008) and of this age class. The method of pre-selection of data according to Fig. 2 is also supported by this comparison. Differences between the methods for the year 2002 may be explained by comparably large data gaps at the beginning of the year which introduces a higher uncertainty with the common gap-filling procedure. In 2006 the lower reduction in stem growth compared to the other NPP estimates may be explained by an extraordinarily dry july followed by a rainy August. In July, when spruce trees are usually still in the main phase of stem growth (intra-annual data are not shown in detail), high vapour pressure deficit and low soil water availability reduced carbon uptake by
photosynthesis as well as stem growth substantially. In August, low incoming radiation (50% lower than in July 2006, 25% lower than the average of 2002-2007) also reduced photosynthesis and growth, but the main growth phase of stem growth was already finished in August so that the net effect on annual stem growth was much lower than the net effect on annual carbon uptake reflected by the flux data and the HBLR-method. The contrary CO2-uptake values in July (low FC2ooo) and August (high FC2ooo. Fig. 3) seem to balance each other, but these
potential physiological states were overridden by the actual distribution of radiation income. In July, the high radiation income could not be used for carbon uptake due to dry weather conditions, and thus low FC2ooo· In
4. Conclusions
The analysis of the parameters α, FC20oo and Rday shows that day-time fluxes measured at the Wetzstein site
behave comparable to similar ecosystems (Rebmann, 2004; Grünwald and Bernhofer, 2007) and are most likely not biased by mesoscale transport effects.
The occurrence of unrealistic high night-time fluxes could be attributed to very specific situations when CO2 is
transported uphill due to a decoupling of the above and below-canopy flows similar as observed by Cook et al. (2004). These unrealistically high night-time fluxes have to be discarded and gap-filled to get reliable annual sums for NEE, GPP and TER, respectively. Since night-time fluxes which are left in the time series may still be influenced by drainage effects below a level that leads to their discarding, and for which it remains unknown if they are measured correctly, an additional method was applied for gap-filling: TER and GPP were determined only with day-time data based on a rectangular hyperbolic light response curve taking into account effects of VPD (HBLR-method). From these estimates TER on average was larger than when determined with the common gap-filling and partitioning method applied on a pre-selected data set. This may be a hint that the criteria for the selection of possibly biased CO2-fluxes are too conservative so that a larger percentage of
originally measured fluxes could be used for the determination of annual sums. Inter-annual variations of NEE are smaller for the results of the HBLR-method as can be seen from Fig. 4 and Table 1.
In summary it becomes obvious from the results presented here and in Zeri et al. (2010) and Aubinet et al. (2010) that eddy covariance sites in complex terrain need to be treated with special care. It has to be checked whether drainage and addition of CO2 occurs at a site and how one can deal with these additional fluxes if
reliable sums for net ecosystem exchange of CO2 have to be determined. As many forest flux sites are
established in complex terrain, similar procedures may have to be applied to other flux sites around the globe.
Acknowledgements
The authors thank in particular the ADVEX field crew and the field crew of the Max Planck Institute for Biogeochemistry for setting up towers and equipment and maintaining the running measurements, Ulrich Pruschitzki for taking biometric data in the field and Christian Wirth for their analysis. We also thank the reviewers for their valuable comments on the first version of the manuscript.
References
Anthoni, P.M., Knohl, A., Rebmann, C, Freibauer, A., Mund, M., Ziegler, W., Kolle, O., Schulze, E.D., 2004. Forest and agricultural land-use-dependent CO2 exchange in Thuringia, Germany. Global Change Biology 10 (12), 2005-2019.
Aubinet, M., Berbigier, P., Bernhofer, C.H., Cescatti, A., Feigenwinter, C, Granier, A., Grunwald, T.H., Havrankova, K., Heinesch, B., Longdoz, B., Marcolla, B., Mon-tagnani, L, Sedlak, P., 2005. Comparing CO2 storage and advection conditions at night at different
CarboEuroflux sites. Boundary-Layer Meteorology 116 (1), 63-94.
Aubinet, M., Feigenwinter, C, Bernhofer, C, Canepa, E., Lindroth, A., Montagnani, L., Rebmann, C, Sedlak, P., Van Gorsel, E., 2010. Advection is not the solution to the nighttime CO2 closure problem—evidence from three different forests. Agricultural and Forest
Meteorology 150, 655-664.
Aubinet, M., Grelle, A., Ibrom, A., Rannik, Ü., Moncrieff, J., Foken, T., Kowalski, A., Martin, P., Berbigier, P., Bernhofer, C, Clement, R., Elbers, J., Granier, A., Grunwald, T., Morgenstern, K., Pilegaard, K., Rebmann, C, Snijders, W., Valentini, R., Vesala, T., 2000. Estimates of the annual net carbon and water exchange of forests: the EUROFLUX methodology. Advances in Ecological Research 30,113-175. Baldocchi, D., Falge, E., Gu, L.H., Olson, R., Hollinger, D., Running, S., Anthoni, P., Bernhofer, C, Davis, K., Evans, R., Fuentes, J., Goldstein, A., Katul, G., Law, B., Lee, X.H., Malhi, Y., Meyers, T., Munger, W., Oechel, W., PawU, K.T., Pilegaard, K., Schmid, H.P., Valentini, R., Verma, S., Vesala, T., Wilson, K., Wofsy, S., 2001. FLUXNET: a new tool to study the temporal and spatial variability of ecosystem-scale carbon dioxide, water vapor, and energy flux densities. Bulletin of the American Meteorological Society 82 (11), 2415-2434.
Baldocchi, D.D., 2003. Assessing the eddy covariance technique for evaluating carbon dioxide exchange rates of ecosystems: past, present and future. Global Change Biology 9 (4), 479-492.
Ciais, P., Reichstein, M., Viovy, N., Granier, A., Ogee, J., Allard, V., Aubinet, M., Buchmann, N., Bernhofer, C, Carrara, A., Chevallier, F., De Noblet, N., Friend, A.D., Friedlingstein, P., Grunwald, T., Heinesch, B., Keronen, P., Knohl, A., Krinner, G., Loustau, D., Manca, G., Matteucci, G., Miglietta, F., Ourcival, J.M., Papale, D., Pilegaard, K., Rambal, S., Seufert, G., Soussana, J.F., Sanz, M.J., Schulze, E.D., Vesala, T., Valentini, R., 2005. Europe-wide reduction in primary productivity caused by the heat and drought in 2003. Nature 437 (7058), 529-533.
Cook, B.D., Davis, K.J., Wang, W.G., Desai, A., Berger, B.W., Teclaw, R.M., Martin, J.G., Bolstad, P.V., Bakwin, P.S., Yi, C.X., Heilman, W., 2004. Carbon exchange and venting anomalies in an upland deciduous forest in northern Wisconsin, USA. Agricultural and Forest Meteorology 126 (3-4), 271-295.
Eugster, W., Senn, W., 1995. A cospectral correction model for measurement of turbulent NO2 flux. Boundary Layer Meteorology 74,
321-340.
Falge, E., Baldocchi, D., Olson, R., Anthoni, P., Aubinet, M., Bernhofer, C, Burba, G., Ceulemans, R., Clement, R., Dolman, H., Granier, A., Gross, P., Grunwald, T., Hollinger, D., Jensen, N.O., Katul, G., Keronen, P., Kowalski, A., Lai, C.T., Law, B.E., Meyers, T., Moncrieff, H., Moors, E., Munger, J.W., Pilegaard, K., Rannik, U., Rebmann, C, Suyker, A., Tenhunen, J., Tu, K., Verma, S., Vesala, T., Wilson, K., Wofsy, S., 2001. Gap filling strategies for defensible annual sums of net ecosystem exchange. Agricultural and Forest Meteorology 107 (1), 43-69.
Feigenwinter, C, Bernhofer, C, Eichelmann, U., Heinesch, B., Hertel, M., Janous, D., Kolle, O., Lagergren, F., Lindroth, A., Minerbi, S., Moderow, U., Molder, M., Montagnani, L., Queck, R., Rebmann, C, Vestin, P., Yernaux, M., Zeri, M., Ziegler, W., Aubinet, M., 2008. Comparison of horizontal and vertical advec-tive CO2 fluxes at three forest sites. Agricultural and Forest Meteorology 148, 12-24.
Foken, T., Wichura, B., 1996. Tools for quality assessment of surface-based flux measurements. Agricultural and Forest Meteorology 78, 83-105.
Göckede, M., Foken, T., Aubinet, M., Aurela, M., Banza, J., Bernhofer, C, Bonnefond, J.M., Brunet, Y., Carrara, A., Clement, R., Dellwik, E., Elbers, J., Eugster, W., Fuhrer, J., Granier, A., Grùnwald, T., Heinesch, B., Janssens, I.A., Knohl, A., Koeble, R., Laurila, T., Longdoz, B., Manca, G., Marek, M.V., Markkanen, T., Mateus, J., Matteucci, G., Mauder, M., Migliavacca, M., Minerbi, S., Moncrieff, J., Montagnani, L., Moors, E., Ourcival, J.-M., Papale, D., Pereira, J.S., Pilegaard, K., Pita, G., Rambal, S., Rebmann, C, Rodrigues, A., Rotenberg, E., Sanz, M., Sedlak, P., Seufert, G., Siebicke, L., Soussana, J.F., Valentini, R., Vesala, T., Verbeeck, H., Yakir, D., 2008. Quality control of CarboEurope flux data. Part I. Coupling footprint analyses with flux data quality assessment to evaluate sites in forest ecosystems. Biogeosciences 5, 433-450.
Goulden, M.L., Munger, J.W., Fan, S.-M., Daube, B.C., Wofsy, S.C., 1996. Measurements of carbon sequestration by long-term eddy covariance: methods and a critical evaluation of accuracy. Global Change Biology 2 (3), 169-182.
Grace, J., 2005. Role of forest biomes in the global carbon balance. In: Griffiths, H., Jarvis, P.G. (Eds.), The Carbon Balance of Forest Biomes. Taylor & Francis Group, Abingdon, UK, pp. 19-45.
Grùnwald, T., Bernhofer, C, 2007. A decade of carbon, water and energy flux measurements of an old spruce forest at the Anchor Station Tharandt. Tellus Series B-Chemical and Physical Meteorology 59 (3), 387-396.
Kaimal, J.C., Finnigan, J.J., 1994. Atmospheric Boundary Layer Flows: Their Structure and Measurement. Oxford University Press, New York, 289 pp.
Kolle, O., Rebmann, C, 2007. Eddysoft-Documentation of a Software Package to Acquire and Process Eddy Covariance Data. 10. In: Technical Reports—Max-Planck-Institute for Biogeochemistry, vol. 10, Jena, Germany.
Lasslop, G., Reichstein, M., Kattge, J., Papale, D., 2008. Influences of observation errors in eddy flux data on inverse model parameter estimation. Biogeosciences 5(5), 1311-1324.
Lasslop, G., Reichstein, M., Papale, D., Richardson, A.D., Arneth, A., Barr, A., Stoy, P., Wohlfahrt, G., 2009. Separation of net ecosystem exchange into assimilation and respiration using a light response curve approach: critical issues and global evaluation. Global Change Biology doi: 10.1111/j.l365-2486.2009.02041.x.
Lindroth, A., Klemedtsson, L., Grelle, A., Weslien, P., Langvall, O., 2008. Measurement of net ecosystem exchange, productivity and respiration in three spruce forests in Sweden shows unexpectedly large soil carbon losses. Biogeochemistry 89 (1), 43-60.
Lloyd, J., Taylor, J.A., 1994. On the temperature dependence of soil respiration. Functional Ecology 8, 315-323.
McMillen, R.T., 1988. An eddy correlation technique with extended applicability to non-simple terrain. Boundary Layer Meteorology 43, 231-245.
Miller, S.D., Goulden, M.L., Menton, M.C., da Rocha, H.R., de Freitas, H.C., Figueira, A., de Sousa, C.A.D., 2004. Biometric and micrometeorological measurements of tropical forest carbon balance. Ecological Applications 14 (4), S114-S126.
Moffat, A.M., Papale, D., Reichstein, M., Hollinger, D.Y., Richardson, A.D., Barr, A.G., Beckstein, C, Braswell, B.H., Churkina, G., Desai, A.R., Falge, E., Gove, J.H., Heimann, M., Hui, D., Jarvis, A.J., Kattge, J., Noormets, A., Stauch, V.J., 2007. Comprehensive comparison of gap-filling techniques for eddy covariance net carbon fluxes. Agricultural and Forest Meteorology 147, 209-232.
Nemani, R.R., Keeling, CD., Hashimoto, H., Jolly, W.M., Piper, S.C., Tucker, C.J., Myneni, R.B., Running, S.W., 2003. Climate-driven increases in global terrestrial net primary production from 1982 to 1999. Science 300 (5625), 1560-1563.
Rebmann, C, 2004. Kohlendioxid-, Wasserdampf- und Energieaustausch eines Fichtenwaldes in Mittelgebirgslage in Nordostbayern. Bayreuther Forum Öko-logie 106, BITÖK, Bayreuth.
Reichstein, M., Falge, E., Baldocchi, D., Papale, D., Aubinet, M., Berbigier, P., Bernhofer, C, Buchmann, N., Gilmanov, T., Granier, A., Grunwald, T., Havrankova, K., Ilvesniemi, H., Janous, D., Knohl, A., Laurila, T., Lohila, A., Loustau, D., Matteucci, G., Meyers, T., Miglietta, F., Ourcival, J.M., Pumpanen, J., Rambal, S., Rotenberg, E., Sanz, M., Tenhunen, J., Seufert, G., Vaccari, F., Vesala, T., Yakir, D., Valentini, R., 2005. On the separation of net ecosystem exchange into assimilation and ecosystem respiration: review and improved algorithm. Global Change Biology 11 (9), 1424-1439.
Ruimy, A., Jarvis, P.G., Baldocchi, D.D., Saugier, B., 1995. CO2 fluxes over plant canopies and solar radiation: a review. Advances in
Ecological Research 26, 1-68.
Schulze, E.D., 2006. Biological control of the terrestrial carbon sink. Biogeosciences 3 (2), 147-166.
Van Gorsel, E., Leuning, R., Cleugh, H.A., Keith, H., Suni, T., 2007. Nocturnal carbon efflux: reconciliation of eddy covariance and chamber measurements using an alternative to the u (*)-threshold filtering technique. Tellus Series B-Chemical and Physical Meteorology 59 (3), 397-403.
Vickers, D., Mahrt, L., 1997. Quality control and flux sampling problems for tower and aircraft data. Journal of Atmospheric & Oceanic Technology 14, 512-526.
Wilczak, J.M., Oncley, S.P., Stage, S.A., 2001. Sonic anemometer tilt correction algorithms. Boundary Layer Meteorology 99 (1), 127-150. Wofsy, S.C., Goulden, M.L., Munger, J.W., Fan, S.-M., Bakwin, P.S., Daube, B.C., Bassow, S.L., Bazzaz, F.A., 1993. Net exchange of CO2
in a mid-latitude forest. Science 260, 1314-1317.
Zeri, M., 2008. Investigation of high nighttime CO2-fluxes at the Wetzstein spruce forest site in Thuringia, Germany. Ph.D. Thesis.
Max-Planck-Institute for Biogeochemistry (Jena, Germany), Technical Reports 13, 115 pp. Online at http:// www.bgc-jena.mpg.de.
Zeri, M., Rebmann, C, Feigenwinter, C, Sedlak, P., 2010. Analysis of periods with strong and coherent CO2 advection over a forested hill.