arXiv:1702.01171v1 [astro-ph.HE] 3 Feb 2017
Study of the variability of Nova V5668 Sgr, based on high resolution
spectroscopic monitoring
D. Jack1,⋆, J. de J. Robles P´erez1, I. De Gennaro Aquino2, K.-P. Schr¨oder1, U. Wolter2, P. Eenens1, J. H.
M. M. Schmitt2, M. Mittag2, A. Hempelmann2, J. N. Gonz´alez-P´erez2, G. Rauw3, and P. H. Hauschildt2
1 Departamento de Astronom´ıa, Universidad de Guanajuato, A.P. 144, 36000 Guanajuato, GTO, Mexico 2 Hamburger Sternwarte, Universit¨at Hamburg, Gojenbergsweg 112, 21029 Hamburg, Germany
3 Groupe d’Astrophysique des Hautes Energies, Institut d’Astrophysique et de G´eophysique, Universit´e de Li`ege, All´ee
du 6 Aoˆut, Bˆat B5c, 4000 Li`ege, Belgium Received XXXX, accepted XXXX Published online XXXX
Key words stars: novae, cataclysmic variables – stars: individual: Nova V5668 Sgr – techniques: spectroscopic – line: identification – line: profiles
We present results of our dense spectroscopic monitoring of Nova V5668 Sgr. Starting on March 19 in 2015, only a few days after discovery, we have obtained a series of spectra with the TIGRE telescope and its HEROS ´echelle spectrograph which offers a resolution of R ≈ 20,000 and covers the optical wavelength range from 3800 to 8800 Å. We performed a line identification of the discernible features for four spectra which are representative for the respective phases in the light curve evolution of that nova. By simultaneously analysing the variations in the visual light curve and the corresponding spectra of Nova V5668 Sgr, we found that during the declining phases of the nova the absorption features in all hydrogen and many other lines had shifted to higher expansion velocities of ≈ −2000 km s−1. Conversely, during the rise towards
the following maximum, these observed absorption features had returned to lower expansion velocities. We found that the absorption features of some Fe ii lines displayed the same behaviour, but in addition disappeared for a few days during some declining phases. Features of several N i lines also disappeared while new N ii lines appeared in emission for a few days during some of the declining phases of the light curve of Nova V5668 Sgr. The shape of the emission features is changing during the evolution and shows a clear double peak structure after the deep minimum.
Copyright line will be provided by the publisher
1 Introduction
A white dwarf (WD) in a close binary system can ac-crete hydrogen from a Roche-lobe filling companion star. A layer of hydrogen accumulates in an accretion disk and, eventually, on the degenerate surface of the WD. At some point, the hydrogen ignites and a thermonuclear runaway starts and ejects material from the surface of the WD. These explosive events are observed as classical novae (see Bode & Evans (2008); Gallagher & Starrfield (1978); Payne-Gaposchkin (1964) or Bode (2010) for reviews). It is believed that the hydrogen keeps burning on the surface of the white dwarf, as the detection of X-ray and its light curve indicate. Nova envelopes are usually found to be close to the Eddington limit and it is likely that this results in a continu-ous ejection of gas comparable to a very strong stellar wind with the respective expansion velocity profile.
To understand in more detail the physics of this ex-plosive ejection of gas in a nova event, dense spectro-scopic monitoring of novae is an important tool, since whatever is causing rapid changes in the light curve of a nova should also have direct effects on its spectrum on
⋆ Corresponding author: dennis@astro.ugto.mx
the same very short time scales. Performing the spectro-scopic monitoring with high resolution is also desirable in order to observe details in the respective nova absorption and emission features of the characteristic spectral lines. De Gennaro Aquino et al. (2015) studied the bright Nova V339 Del, which appeared in August 2013, based on ob-servations using spectroscopic monitoring with high resolu-tion obtained with the robotic telescope TIGRE (Telescopio Internacional en Guanajuato, Rob ´otico y Espectrosc´opico) and presented a detailed atlas of lines that show features in the optical spectra of that nova.
On March 15 in 2015 a new and very bright clas-sical nova appeared in the constellation of Sagittarius (Williams et al. 2015). The Nova V5668 Sgr has been stud-ied by many observers and also in different wavelength re-gions. Near infrared observations clearly show the forma-tion of dust in this nova when it drops to a deep mini-mum in the light curve after about 90 days after discovery (Banerjee et al. 2015a, 2016b). Carbon monoxide has also been detected in its spectra (Banerjee et al. 2015b). Dur-ing the later phases, Nova V5668 Sgr could also be ob-served in X-rays (Page et al. 2015a,b,c) as well as in gamma rays (Cheung et al. 2015a,b). The Hubble Space Telescope has observed the nova with observations performed in the
ultraviolet wavelength region using the STIS instrument (Kuin et al. 2015). Furthermore, polarimetry data have been taken of that nova (Harvey et al. 2015). The observations re-sumed once Nova V5668 Sgr was again observable after its conjunction with the Sun showing that dust emission is still present but has weakened over the months (Banerjee et al. 2016a).
In this paper, we present the results of our analysis of the spectroscopic monitoring of Nova V5668 Sgr with the TIGRE telescope. We give the details of our observations and a short discussion of the light curve of the nova in Sec-tion 2. The results that we obtained from our spectroscopic monitoring of the nova during the different phases of the light curve evolution are shown in the following Section 3. We will close this paper with Section 4, where we present a discussion and our conclusions.
2 Observations of Nova V5668 Sgr
Starting from day March 19 UT in 2015 on, we ob-served a dense time series of spectra of Nova V5668 Sgr (Kazarovets & Samus 2015) – also known as Nova Sagit-tarii 2015 No. 2 or PNV J18365700-2855420 – with the 1.2 m robotic telescope TIGRE situated near Guanajuato, Central Mexico, and equipped with the ´echelle spectro-graph HEROS (Heidelberg Extended Range Optical Spec-trograph). The time series was interrupted on June 17, when the nova was in a steep decline about 90 days after its dis-covery. Between March 19 and June 17 we were able to obtain a total of 46 spectra during this period of 91 possible days of observation. Starting on July 26, 133 days after dis-covery, when the light curve of Nova V5668 Sgr had recov-ered from the deep minimum, we resumed monitoring until October 11 in 2015, 210 days after discovery, when the nova had started to be too close to the Sun and was eventually heading for its conjunction. During this phase we obtained 26 spectra, which gives a total of 72 spectra of Nova V5668 Sgr.
With the ´echelle spectrograph HEROS, the spectra have a quite high resolution of R ≈ 20, 000 and cover the op-tical wavelength range from 3800 to 8800 Å, with just a small gap of about 130 Å around 5800 Å. The spectra are obtained in two channels (red and blue) simultaneously. For the observations we aimed for exposure times of one hour to obtain a high signal-to-noise ratio of > 100. The spec-tra after the deep minimum have only a signal-to-noise ra-tio of S /N ≈ 15, which is due to the lower brightness of the nova and the low continuum emission during that phase. However, the emission lines in the spectra show a signto-noise ratio that is significantly higher, therefore still al-lowing for studying these features in detail. Since TIGRE is a robotic telescope the observations as well as the data re-duction were performed automatically. It needs to be stated that the observed spectra could not be calibrated for ab-solute fluxes, but we were able to obtain all the spectra with relative fluxes. For a more detailed technical
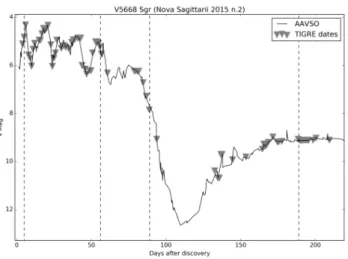
descrip-Fig. 1 Visual light curve of Nova V5668 Sgr after its dis-covery on March 15 in 2015. The data points were taken from AAVSO observations. The vertical lines indicate the days where we performed a thorough line identification. The triangles mark the days where we obtained TIGRE spectra.
tion of the TIGRE instrumentation and its capabilities, see Schmitt et al. (2014). The TIGRE telescope, although orig-inally not designed for it, has turned out to be very useful for spectroscopic monitoring of high energy astrophysical events like novae (De Gennaro Aquino et al. 2015) and su-pernovae (Jack et al. 2015).
Nova V5668 Sgr also has been observed with an even higher resolution of R ≈ 60, 000 by Tajitsu et al. (2016), but they only obtained one spectrum on May 29 and, therefore, did not perform a dense spectroscopic monitoring, which is the big advantage of our observation campaign. Obser-vations with the PEPSI spectrograph and a resolution of R ≈ 270, 000 have also been reported (Wagner et al. 2016).
2.1 Visual light curve
Fig. 1 demonstrates the visual light curve of Nova V5668 Sgr starting from its day of discovery until the be-ginning of November in 2015, when the nova started to be too close to the Sun for further observations. The data points were taken from the AAVSO Database1, and March 15 in
2015 was taken as day zero after the discovery. The trian-gles mark the days where we obtained spectra with the TI-GRE telescope. As can be seen in the graph, during the first 90 days there are significant variations in the light curve of up to 2 mag, while the magnitude stays more or less be-tween 5 and 7 mag. This phase will be discussed in detail in the following Section 2.2. After the variation phase, the light curve of Nova V5668 Sgr shows a very steep decline down to a minimum with a magnitude of ≈ 13.5 mag. Af-ter this deep minimum the visual light curve rose again up
0 10 20 30 40 50 60 70 80 90
days after discovery
3.5 4.0 4.5 5.0 5.5 6.0 6.5 7.0 7.5 mag AAVSO 1 2 3 4 5
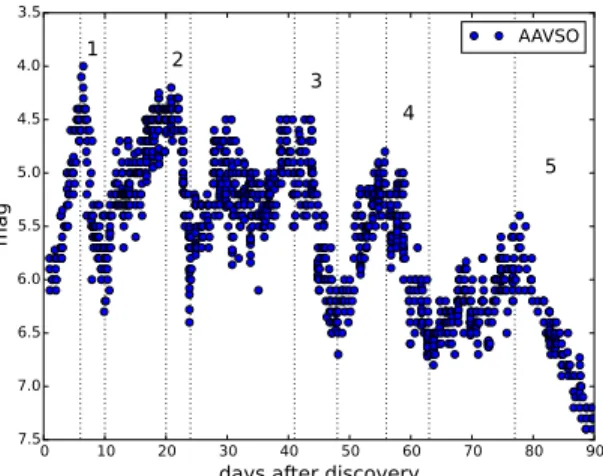
Fig. 2 Visual light curve of Nova V5668 Sgr during the first 90 days after its discovery on March 15 in 2015. The data points were taken from AAVSO observations. Five clear declining phases have been identified.
to a magnitude of ≈ 9 mag. The light curve then stayed al-most constant and subsequently declined very slowly. The vertical lines in Fig. 1 mark the days after discovery where we performed a detailed line identification in the observed spectra (see Section 3.1.1).
The observed visual magnitude during the first maxi-mum of Nova V5668 Sgr is about 4.2 mag. Using the accu-rate CCD measurements of the AAVSO Database, the color in B−V is found to be 0.26 mag during the first days. During this phase the intrinsic (B − V)0due to an effective
tempera-ture of ≈ 9000 K is about 0.05 mag. This gives an estimate for the interstellar extinction of E(B−V) = 0.21 mag, which corresponds to a moderate extinction of AV = 0.7 mag.
As-suming an absolute magnitude of Mvis ≈ −7.5 mag, like the one observed for DQ Her, we obtain a distance modulus of 11.0 mag, which places the Nova V5668 Sgr at a dis-tance of about 1.6 kpc. Banerjee et al. (2016b) determined the distance to Nova V5668 Sgr to have a value of 1.54 kpc and state that this is in good agreement with the MMRD estimate using the relation of della Valle & Livio (1995).
2.2 Light curve variation phase
In Fig. 2, the visual light curve of Nova V5668 Sgr is shown for the first 90 days after discovery. The data points were taken from AAVSO observations. As can be seen this part of the light curve shows five clear declining phases that are indicated in the graph. These declines occur during just few days and are also in general steeper than the following phases of increasing brightness. We will study the corre-sponding changes that are observed in the optical spectra in the following chapter.
In comparison with other novae, the light curve of Nova V5668 Sgr displays the typical characteristics of the very bright Nova DQ Herculis from 1934 (Gaposchkin 1956),
with many variations during a long period and a final de-cline around 90 days after discovery. After a deep minimum the light curve recovers to show then a very slow declining phase. See also Strope et al. (2010) for other novae of that type and with similar light curves.
3 Spectroscopic monitoring of Nova
V5668 Sgr
Our spectroscopic monitoring of Nova V5668 Sgr covers all different phases of the light curve evolution as presented above. In this section, we first present four of our high reso-lution spectra taken at very different stages of the outburst, along with a detailed line identification. We then offer a de-tailed analysis of the spectra of Nova V5668 Sgr and their evolution until after the deep minimum of the light curve, when all lines are only seen in emission.
3.1 High resolution spectroscopic monitoring
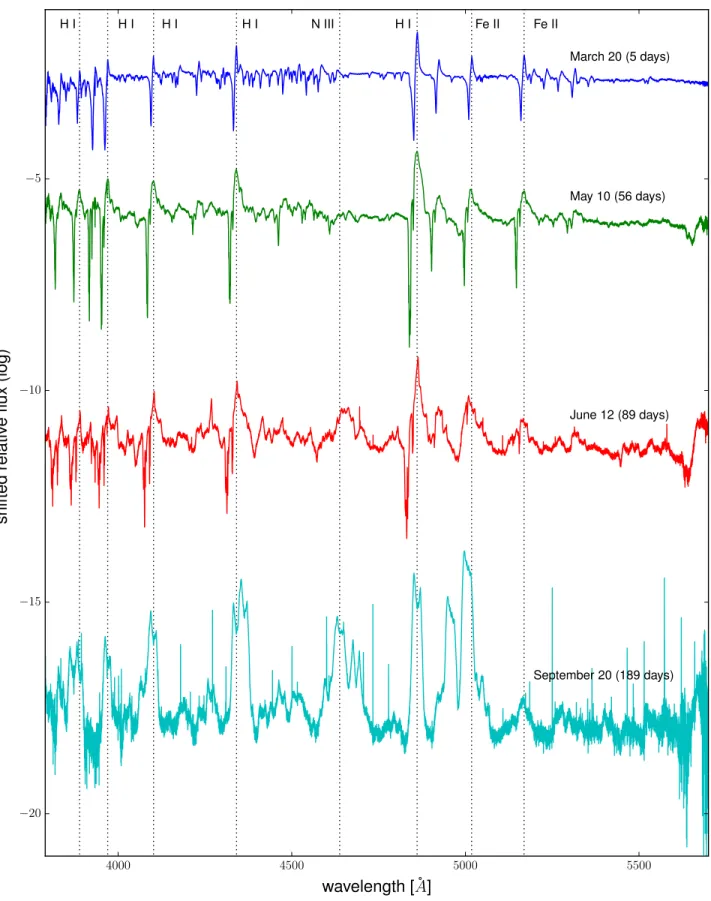
Fig. 3 shows four spectra of the nova observed in the blue channel of the HEROS spectrograph between 3800 and 5800 Å. The spectra were taken at the dates indicated in the graph. To represent the different phases of the nova, we chose a spectrum during the first maximum as well as two spectra during the variation phase: one during a maximum, the other when the light curve was declining towards the big minimum. The fourth spectrum spectrum was taken af-ter the minimum during the emission line or dust phase. In Fig. 1, the corresponding days after discovery are marked by vertical lines.
The first spectrum presented was taken on March 20 in 2015, which corresponds to 5 days after discovery, when the nova was around its maximum brightness. The spectrum shows the characteristic P-Cygni profile features which one expects during this phase. We marked some of the strongest and most important features in the spectrum with vertical lines at their respective rest-wavelengths. All features show the emission peak at around the rest-wavelength and a blue shifted absorption feature corresponding to a negative ex-pansion velocity caused by the ejected gas of the nova event that is moving towards the observer. Features of all the Hy-drogen Balmer lines that can be observed in this wavelength range are clearly visible (H β at 4861 Å, H γ at 4341 Å, H δ at 4102 Å, etc.). Two clear Fe ii features are also marked in Fig. 3, but there are many more iron lines present in that spectrum (see Section 3.1.1 for a detailed list of iden-tified lines). The second spectrum presented was taken on May 10 during the light curve variation phase around the fourth maximum 56 days after discovery. All Balmer lines are still present, but the line profiles have already changed. The emission features are now broader, and the absorption features are still present. Looking closely one can see that there are now two distinct absorption features in most of the lines. On June 12 we took the third spectrum presented here. It was taken 89 days after discovery when the light
4000 4500 5000 5500
wavelength [ ˚
A
]
−20 −15 −10 −5s
h
if
te
d
re
la
ti
ve
fl
u
x
(l
o
g
)
March 20 (5 days) May 10 (56 days) June 12 (89 days) September 20 (189 days) H I H I H I H I Fe II Fe II H I N IIIFig. 3 Four spectra of Nova V5668 Sgr observed in the blue channel of the HEROS spectrograph. Dates are of 2015 and the corresponding days after discovery are given in brackets.
6000 6500 7000 7500 8000 8500
wavelength [ ˚
A
]
−20 −15 −10 −5s
h
if
te
d
re
la
ti
ve
fl
u
x
(l
o
g
)
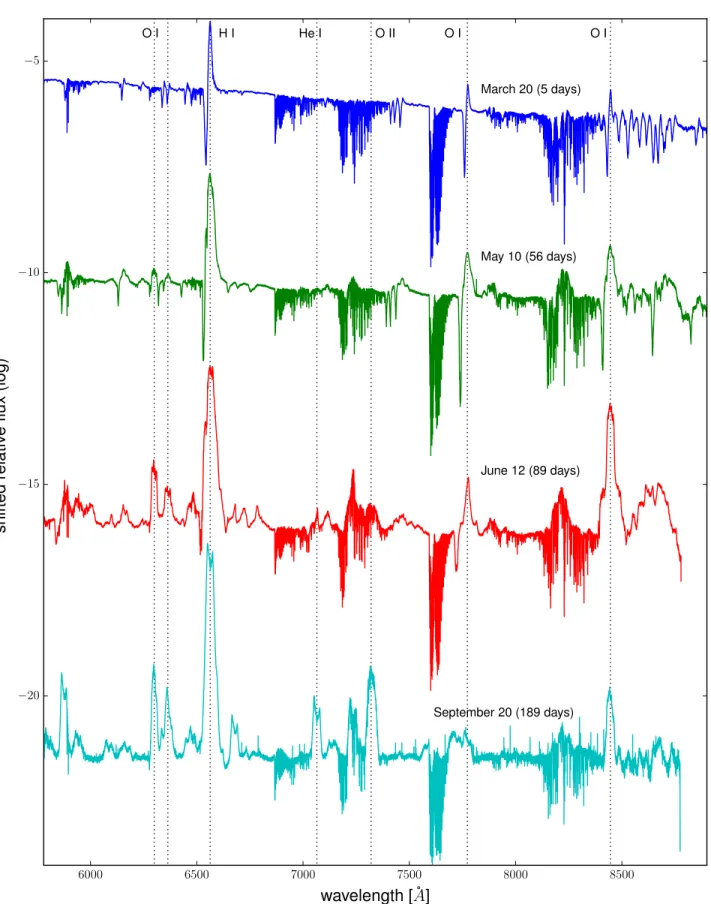
March 20 (5 days) May 10 (56 days) June 12 (89 days) September 20 (189 days) O I H I He I O II O I O IFig. 4 Four spectra of Nova V5668 Sgr observed in the red channel of the HEROS spectrograph. Dates are of 2015 and the corresponding days after discovery are given in brackets. Broad bands of telluric lines are present in this wavelength range.
curve was in the steep decline towards the deep minimum. The Balmer lines show mainly emission features but still have some absorption features, while the marked features of the Fe ii lines are only in emission. In the last presented spectrum, which was observed after the deep minimum 189 days after discovery on September 20, no absorption fea-tures were found, but some new emission lines appear, such as one at 4638.0 Å, presumably due to N iii, as can be seen in Fig. 3.
In Fig. 4, we present four spectra of Nova V5668 Sgr ob-served by the TIGRE telescope and in the red channel of the HEROS spectrograph in the wavelength range from 5800 to 8800 Å. The spectra were taken at the same days as the spectra presented in Fig. 3 and as indicated by the vertical lines in Fig. 1. Comparing the spectra of the two channels, it can be seen that the spectra of the red channel show less features than the ones that were taken in the blue channel. The observations in the red channel are affected by telluric lines, which we did not remove in our spectra. In the spectra, the telluric lines are visible in Fig. 4 around the wavelength ranges from 6800 to 7300 Å, 7600 to 7700 Å and 8000 to 8400 Å. The first spectrum in Fig. 4 from March 20 shows features of lines with clear P-Cygni profiles as was already observed in the blue channel. Strong lines are H α at a wave-length of 6562.7 Å and an O i line at 7773.0 Å. The lines in the second spectrum from May 10 still show P-Cygni pro-files but the emission features are now broader than before. In the H α line has appeared an additional small absorption feature that can also be seen in the two strong lines of O i marked in the spectrum. In the third spectrum from June 12, the line profiles have started to change to present now mainly emission features, but some lines still show absorp-tion features. Two new clear emission features of [O i] at wavelengths of 6300.3 and 6363.7 Å appear in the spectrum and are still visible in the fourth presented spectrum from September 20. There also arises a new emission feature of the [O ii] line at 7320.0 Å, which is clearly visible in this last spectrum. In the spectrum from June 12 there are too many telluric lines in that wavelength region so that a clear iden-tification is difficult. A further new strong emission feature in this spectrum is the He i line at 7065.2 Å, which is also present in the spectrum of Nova V5668 Sgr from September 20, which was observed after the deep minimum 189 days after discovery. As one can clearly see many of the emission features have a double peak shape.
3.1.1 Line Identification
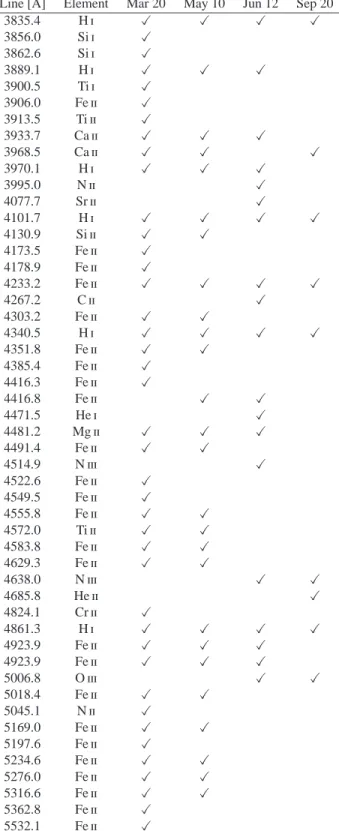
The four selected characteristic spectra described above were used to identify all the lines that show spectral fea-tures. For this thorough analysis we made use of the spectral atlas presented in De Gennaro Aquino et al. (2015) which was obtained from observations with the same telescope us-ing spectra of Nova V339 Del. In the Tables 1 for the blue and 2 for the red channel, we list all the identified lines for which we found features in the respective spectra. The ta-bles are sorted by the rest-wavelength of the lines, and it
Table 1 List of lines in the blue channel that have been identified in four selected spectra of Nova V5668 Sgr during characteristic light curve phases.
Line [Å] Element Mar 20 May 10 Jun 12 Sep 20
3835.4 H i X X X X 3856.0 Si i X 3862.6 Si i X 3889.1 H i X X X 3900.5 Ti i X 3906.0 Fe ii X 3913.5 Ti ii X 3933.7 Ca ii X X X 3968.5 Ca ii X X X 3970.1 H i X X X 3995.0 N ii X 4077.7 Sr ii X 4101.7 H i X X X X 4130.9 Si ii X X 4173.5 Fe ii X 4178.9 Fe ii X 4233.2 Fe ii X X X X 4267.2 C ii X 4303.2 Fe ii X X 4340.5 H i X X X X 4351.8 Fe ii X X 4385.4 Fe ii X 4416.3 Fe ii X 4416.8 Fe ii X X 4471.5 He i X 4481.2 Mg ii X X X 4491.4 Fe ii X X 4514.9 N iii X 4522.6 Fe ii X 4549.5 Fe ii X 4555.8 Fe ii X X 4572.0 Ti ii X X 4583.8 Fe ii X X 4629.3 Fe ii X X 4638.0 N iii X X 4685.8 He ii X 4824.1 Cr ii X 4861.3 H i X X X X 4923.9 Fe ii X X X 4923.9 Fe ii X X X 5006.8 O iii X X 5018.4 Fe ii X X 5045.1 N ii X 5169.0 Fe ii X X 5197.6 Fe ii X 5234.6 Fe ii X X 5276.0 Fe ii X X 5316.6 Fe ii X X 5362.8 Fe ii X 5532.1 Fe ii X
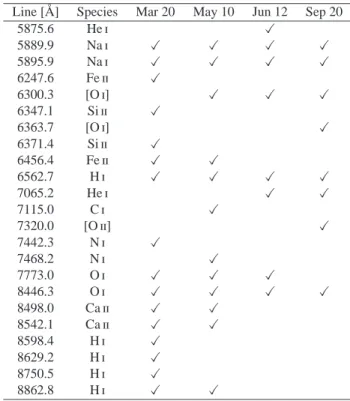
Table 2 List of lines in the red channel that have been identified in four selected spectra of Nova V5668 Sgr during characteristic light curve phases.
Line [Å] Species Mar 20 May 10 Jun 12 Sep 20
5875.6 He i X 5889.9 Na i X X X X 5895.9 Na i X X X X 6247.6 Fe ii X 6300.3 [O i] X X X 6347.1 Si ii X 6363.7 [O i] X 6371.4 Si ii X 6456.4 Fe ii X X 6562.7 H i X X X X 7065.2 He i X X 7115.0 C i X 7320.0 [O ii] X 7442.3 N i X 7468.2 N i X 7773.0 O i X X X 8446.3 O i X X X X 8498.0 Ca ii X X 8542.1 Ca ii X X 8598.4 H i X 8629.2 H i X 8750.5 H i X 8862.8 H i X X
contains also the element and ionization stage to which the line belongs to. Tick-marks indicate, in which of the four spectra the presence of a feature was clearly identified.
The first spectrum around the first maximum brightness contains the largest number of lines with features in Nova V5668 Sgr. We found many Balmer and also Paschen lines of Hydrogen as well as Fe ii lines and strong lines of O i in the spectra of the nova. Additionally, we could identify some lines of Ti ii, Mg ii, Si i, Si ii, N ii, Na i among others. The hydrogen lines are present in all of the four spectra. Other lines like some of Fe ii could only be observed in the first spectra of Table 1 and then disappeared in the later spectra. There are also lines which were not observed in the first spectra, but appeared in the later ones. These are some lines of He ii, O iii, N iii among others. We could also iden-tify some forbidden lines of oxygen ([O i] and [O ii]), which appear in the later spectra when the nova is in its optically thin nebular phase after the deep minimum. There might be also forbidden lines of nitrogen present in the spectra of Nova V5668 Sgr. These lines are [N ii] at 6548 Å and [N ii] at 6583 AA. However, the possible features of these lines coincide with the broad emission feature of Hα and it is difficult to clearly identify them. Fig. 11 might indicate the possible presence of these [N ii] lines.
3.2 The light curve variation phase
During the light curve variation phase, we have taken op-tical spectra of Nova V5668 Sgr between 4 days and 94
days after discovery covering all five clear declining phases as indicated in Fig. 2. This dense spectroscopic time series enables us to relate the spectral evolution directly to the changes seen in the visual light curve and may reveal the physical circumstances during this phase of small variations in the light curve.
A general observation during all of the declining phases of the nova is that when the light curve decreases, the con-tinuum flux decreases as well. The same occurs respectively during the rising phases of the light curve namely the con-tinuum flux increases. Although we do not have flux cal-ibrated spectra, we find that during declining phases the emission line flux increases relative to the continuum. This rules out the possibility that the changes in the light curve are only due to changes in the emission line profiles and is consistent with the constant colour in the AAVSO light curve of Nova V5668 Sgr. In addition, we observed that some spectral features undergo significant changes as well. These allow the study of the physical properties of the en-velope during variations in the visual light curve. It needs to be emphasised that this is possible only due to the dense time series of high resolution spectra, which we obtained with the TIGRE telescope.
Regarding the spectra observed during the first maxi-mum in the visual light curve, before the maximaxi-mum, the lines in the observed spectra show clear P Cygni profile fea-tures, which are caused by an optically thick expanding en-velope, as it is the case for a nova. After the first maximum the nova seems to change into its transition phase. The spec-tra are now showing more complex features which are also beginning to change into emission. This is the typical be-haviour of a classical nova, and the first maximum of the light curve of Nova V5668 Sgr can be understood in this normal context as well. However, one (and only one) for-bidden line of O i already appears in the spectra of the nova at that time (see Sect. 3.2.4).
As is typical for DQ Her type novae, the visual light curve rises again after the first declining phase. In our time series of spectra, we see that when the nova brightness de-clines steeply after its second maximum, the absorption fea-tures shift to notably higher expansion velocities in several lines. Table 3 gives a list of lines which have features that show clearly this behaviour during the various declining phases towards the following minima. The Na i D doublet also shows the high expansion velocity absorption trough, but it needs to be stated that the two individual lines are overlapping and that there is also a He i line at 5875.6 Å in the same wavelength range that could have been blended into this features. There are other lines, probably more Fe ii lines, that showed this behaviour, but it was not clearly seen in our spectra because of a low signal to noise or other rea-sons. We listed only the lines where the behaviour could definitely be seen.
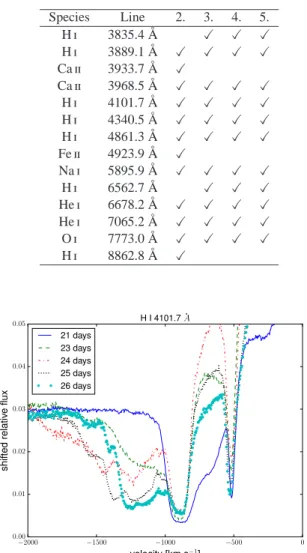
As an example of the different lines, which show the described behaviour, we present in Fig. 5 the changes ob-served in the H δ line at a wavelength of 4101.7 Å. We
con-Table 3 List of lines that show absorption features mov-ing to higher expansion velocities durmov-ing the second to fifth declining phase of the visual light curve of Nova V5668 Sgr.
Species Line 2. 3. 4. 5. H i 3835.4 Å X X X H i 3889.1 Å X X X X Ca ii 3933.7 Å X Ca ii 3968.5 Å X X X X H i 4101.7 Å X X X X H i 4340.5 Å X X X X H i 4861.3 Å X X X X Fe ii 4923.9 Å X Na i 5895.9 Å X X X X H i 6562.7 Å X X X He i 6678.2 Å X X X X He i 7065.2 Å X X X X O i 7773.0 Å X X X X H i 8862.8 Å X −2000 −1500 −1000 −500 0 velocity [km s−1] 0.00 0.01 0.02 0.03 0.04 0.05 s h if te d re la ti ve fl u x H I 4101.7 ˚A 21 days 23 days 24 days 25 days 26 days
Fig. 5 Evolution of the H i line at a wavelength of 4101.7 Å during the second minimum phase observed in the visual light curve of Nova V5668 Sgr. The spectra are shown at different days after discovery.
centrate on the negative expansion velocity part of the line profile and ignore the emission part of the line which has its maximum around the rest wavelength at 0 km s−1. 21 days after discovery the light curve is still in its secondary max-imum, and the spectrum displays only absorption features below an expansion velocity of ≈ −1000 km s−1. These ab-sorption features then shift to expansion velocities between −1500 and −1000 km s−1and during the minimum of the light curve 24 days after discovery, these features reach their maximum expansion velocities of over −1500 km s−1. Dur-ing the followDur-ing rise, they shift slowly towards slower ex-pansion velocities. The absorption feature at ≈ −500 km s−1 can also be observed in many different lines. However, it does not seem to change its position during the light curve variations. −2000 −1500 −1000 −500 velocity [km s−1] 0.0000 0.0002 0.0004 0.0006 0.0008 0.0010 0.0012 0.0014 0.0016 0.0018 s h if te d re la ti ve fl u x O I 7773.0 ˚A 44 days 46 days 47 days 49 days 51 days
Fig. 6 Evolution of the O i line at a wavelength of 7773.0 Å during the third minimum phase observed in the visual light curve of Nova V5668 Sgr. The spectra are shown at different days after discovery.
As a representative example for the third declining phase, we show in Fig. 6 the spectral evolution of the O i line at 7773.0 Å. 44 days after discovery, during the third maximum, absorption features between −1500 and −1000 km s−1 were observed. During the following mini-mum 46 days after discovery, absorption features appear at expansion velocities between −2000 and −1500 km s−1and shift during the following rise to slower expansion veloci-ties as can be seen in the spectra of 49 and 51 days after discovery.
During the fourth declining phase we observed the nova 56 and 57 days after discovery, which is during the max-imum phase. Due to bad weather and scheduled mainte-nance of the telescope we obtained only one spectrum dur-ing the declindur-ing phase 61 days after discovery. However, we could again observe that high velocity absorption fea-tures appear in some of the lines, this time at relatively high expansion velocities of between −2500 and −2000 km s−1. Unfortunately, we cannot say anything about the subse-quent behaviour of these features since we did not cover the following rising phase of the visual light curve. The ob-served expansion velocities of the absorption features dur-ing the fifth declindur-ing phase move to between −2100 and −1700 km s−1. This fifth declining phase has eventually a steep decline down to the deep minimum in the light curve of Nova V5668 Sgr.
As a further illustration, we present the complete evo-lution of the O i line at 7773.0 Å during the whole light curve variation phase covering the observed spectra of the first 100 days after discovery. Fig. 7 shows the variations in expansion velocities of the respective absorption features. The variations in the light curve can be directly related to these changes in the expansion velocities. Fig. 7 is also a great visualization of that the Nova V5668 Sgr shows all the classical systems of spectra, which are principal, diffuse
en-Fig. 7 Evolution of the O i line profile at a wavelength of 7773.0 Å during the light curve variation phase of the visual light curve (continuous line) of Nova V5668 Sgr during the first 100 days after discovery.
Fig. 8 Evolution of the expansion velocities of the min-ima of the absorption features of the O i line at 7773.0 Å. There are two groups of minima one at around 500 km s−1 and the other between 1000 to 2000 km s−1.
hanced, and Orion (Kuiper & Greenstein 1960; McLaughlin 1943, 1944).
To further illustrate and quantify the behaviour of the absorption features, we measured the expansion velocity of the respective minima for each day in the O i line at 7773.0 Å. We used this line because it showed a sim-pler structure than the hydrogen lines, which have vari-ous subfeatures and on some days many more minima. In Fig. 8, we show a graph of the position of all of the min-ima of the absorption features of the O i line. There is one group of minima at around −500 km s−1(red circles) which slowly changes position to higher negative expansion
ve-locity. This group of absorption features disappears later, but because of an observation gap we cannot determine on which day this happens. The other group of absorption fea-tures can be found between expansion velocities of −1000 and −2000 km s−1(blue circles). While the slow expansion velocity group does not display big changes, the group of higher velocity illustrates quite well the changes that oc-cur during a change in the visual light oc-curve as can be seen in Fig. 2. Comparing the graph of the absorption feature minima with the visual light curve, one finds a good agree-ment. When the light curve is in a minimum, the velocity of the absorption feature minimum also jumps to higher neg-ative expansion velocities. During the following rise in the light curve this absorption feature moves back to lower neg-ative velocities. The overall trend shows that while the vi-sual light curve slightly decreases during the variation phase of 90 days, the absorption features also move to higher neg-ative expansion velocities. When the light curve eventually shows the steep decline towards the deep minimum, the ex-pansion velocities of the absorption feature also moves to significantly higher negative expansion velocities.
3.2.1 Appearance of He i features
The list of lines that have features, which show the char-acteristic behaviour of Table 3, contains two He i lines at wavelengths of 6678.2 and 7065.2 Å. These two lines were not observed during the maximum before the second declin-ing phase. Instead, they appear in emission and show the high expansion velocity absorption component only during the secondary minimum phase. This means that the respec-tive He i lines get only excited and visible during this second minimum phase.
During the third minimum phase, the absorption fea-tures of these lines were already observed during the max-imum before and show the same shift in expansion veloc-ity as the features of the other lines. In the few spectra that we could obtain during the fourth declining phase, we ob-served the same behaviour. During the fifth declining phase the lines already show absorption features during the maxi-mum, which then shift during the declining phase to higher expansion velocities.
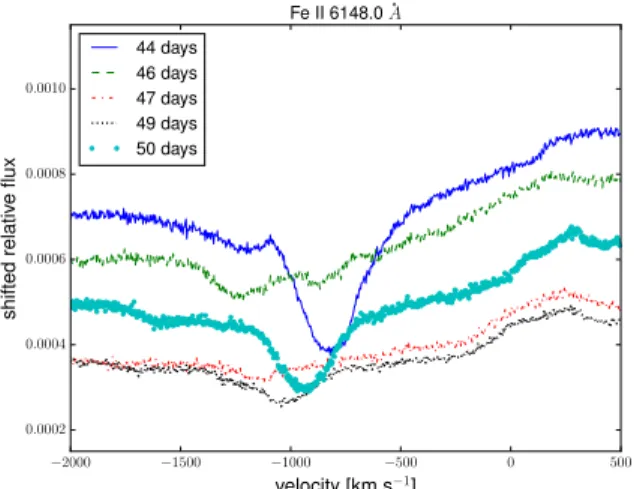
3.2.2 Disappearance of Fe i features
During the third declining phase of the visual light curve of Nova V5668 Sgr, the features of the Fe ii line at a wave-length of 6148.0 Å show a very interesting behaviour in its spectral evolution, which is demonstrated in Fig. 9. During the third maximum 44 days after discovery, clear absorp-tion features at an expansion velocity of ≈ −800 km s−1 are observed in the spectrum. During the following de-clining phase (46 and 47 days after discovery) these fea-tures disappear. However, 49 days after discovery they start to appear again, now at higher expansion velocities of ≈ −1000 km s−1. In the spectrum 50 days after discovery the absorption features become more clearly visible. They also
−2000 −1500 −1000 −500 0 500 velocity [km s−1] 0.0002 0.0004 0.0006 0.0008 0.0010 s h if te d re la ti ve fl u x Fe II 6148.0 ˚A 44 days 46 days 47 days 49 days 50 days
Fig. 9 Evolution of the absorption features of the Fe ii line at 6148.0 Å during the third minimum phase of the visual light curve of Nova V5668 Sgr. The features disappear for a few days. The spectra are shown at different days after discovery.
shift back to lower expansion velocities, reaching almost their original position in the spectrum 51 days after discov-ery. Basically, the expansion velocity evolution observed in the features of this Fe ii line is very similar to those observed in other lines. However, it is interesting that this Fe ii line disappears for a few days, while the light curve is in the de-clining phase. Explanations may be that the Fe ii might be ionized to Fe iii for a few days or that one just sees different layers with different abundances of the expanding envelope.
Actually, absorption features of several Fe ii lines disap-pear during the third declining phase of Nova V5668 Sgr. Features of the Fe ii line at a wavelength of 4232.0 Å that were observed during the third maximum disappear during the third declining phase. In addition, there are several lines of Fe ii in the wavelength range between 5000 and 5300 Å, i. e. 4232.5, 5018.4, 5169.0, 5234.6 and 5276.0 Å, showing the same behaviour. We also found a small emission feature at a wavelength of ≈ 6090 Å appearing during exactly this phase.
Although we only have one spectrum during the fourth declining phase, we found that again some of the Fe ii fea-tures observed during the maximum phase disappear in the spectrum 61 days after discovery during the fourth declin-ing phase. Namely, these are the absorption features of the Fe ii lines at wavelengths of 4491.4, 5316.6 and 6148.0 Å. Additionally, we observed that the absorption features of the Si ii line at a wavelength of 6347.1 Å disappear during the fourth declining phase. During the fifth declining phase the absorption features of the Fe ii lines at 4491.4 and 6148.0 Å do finally disappear.
3.2.3 Disappearance of N i, appearance of N ii
We found also an interesting behaviour of the absorption features of the nitrogen lines in the spectra of Nova V5668 Sgr in the light curve variation phase. During the declining phase towards the third minimum absorption features of two N i lines at wavelengths of 7442.3 and 7468.2 Å disappear. At the same time small emission features of N ii lines appear at wavelengths of 3995.0, 5935.0 and 6483.8 Å. During the fourth declining phase the N i lines at wavelengths of 7442.3 and 7468.2 Å disappear in the spectrum observed 61 days after discovery. At the same time emission features of two N ii lines appear at wavelengths of 3995.0 and 6483.8 Å. During the fifth declining phase, emission features of the N ii line at a wavelength of 3995.0 Å appear in the observed spectra of Nova V5668 Sgr.
3.2.4 The forbidden [O i] 5577.3 Å line
The only forbidden line that appears in the early observed spectra of Nova V5668 Sgr is the one of [O i] at a wave-length of 5577.3 Å. The first time it is visible is in the spec-trum 9 days after discovery during the first declining phase. The line was observed in emission, and the flux increased during the declining phases relatively to the continuum flux. However, this may be explained by a decreasing continuum flux as already noted above. During the following evolu-tion of the visual light curve during the variaevolu-tion phase, we see the same behaviour. During a minimum phase the emis-sion feature of the [O i] line is clearly visible, while during a maximum phase it seems to disappear (in comparison to the continuum flux). In the later spectra there appear features of other forbidden [O i] lines at wavelengths of 6300.3 and 6363.7 Å as can be seen in Fig.4.
3.2.5 Daily variations in the Na i D doublet line From April 25 to April 28 in 2015, which corresponds to 41 to 44 days after discovery, we were able to obtain a trum of Nova V5668 Sgr each night. Comparing these spec-tra we found that the features of the Na i D doublet lines at wavelengths of 5895.9 and 5889.9 Å show daily varia-tions. In Fig. 10, we present the corresponding spectra in the wavelength range of the Na i doublet, where we took the 5889.9 Å line as the reference for the velocities. The two strong narrow lines at the right hand part of the graph are features from interstellar absorption of both Na i lines. Sev-eral absorption features of the expanding nova envelope can be seen in the blue part of the Na i doublet lines. The struc-ture of the feastruc-tures are changing every day. It is difficult to quantify this evolution since the features of both lines overlap and therefore can cause the daily changes. There is also the above mentioned He i line at 5875.6 Å, which might have absorption and/or emission features that could contribute to the flux in that wavelength region and, there-fore, affect the daily changes. The position of this He i line has been marked in the spectra shown in Fig. 10.
−2000 −1500 −1000 −500 0 velocity [km s−1] 0.0000 0.0005 0.0010 0.0015 0.0020 s h if te d re la ti ve fl u x Na I D doublet Apr 25 Apr 26 Apr 27 Apr 28 He I
Fig. 10 Daily variations observed in the absorption fea-tures of the Na i doublet line in the spectra of Nova V5668 Sgr. −1000 −500 0 500 1000 velocity [km s−1] 0.0000 0.0002 0.0004 0.0006 0.0008 0.0010 0.0012 0.0014 s c a le d re la ti ve fl u x Hα 6562.7 ˚A Jun 12 Jul 25 Sep 20 Oct 11
Fig. 11 Evolution of the emission features of the H α line at 6562.7 Å in the spectra of Nova V5668 Sgr during the later phases.
3.3 Emission line phase
After recovering from the deep minimum in the light curve all lines show only emission features in our spectra of Nova V5668 Sgr, meaning that the nova is now in its nebular phase. During the rising phase after the minimum the visual light curve of the nova (Fig. 1) shows some fluctuations, e.g. at around 150 days after discovery. However, our observed spectra show for all lines a simple one peak emission line feature, but that is probably because of the low signal-to-noise ratio of the spectra during that phase, since the nova was still too dim for good observations with the TIGRE tele-scope. The only line showing more complex features is H α due to being the by far strongest line. In Fig. 11, we show the evolution of the shape of the emission features of the H α line at 6562.7 Å. The spectrum from June 12, 89 days after discovery, observed during the steep decline towards
the deep minimum, shows an emission feature which has a maximum close to 0 km s−1. The feature is almost symmet-rical, but it shows a small peak around +600 km s−1and a dip around −750 km s−1.
The narrow absorption features that can be seen in all of the spectra are due to telluric lines. The emission feature of the H α line in the spectrum from July 25, 132 days af-ter discovery, when the light curve is rising again, is strong on the blue side with negative expansion velocity, while on the positive expansion velocity side only a small emission is observed. The maximum of the emission feature can be found around −200 km s−1. When the light curve is in the al-most constant phase after the deep minimum, the H α emis-sion feature of Nova V5668 Sgr has a clear double peak structure. This can be seen in the observed spectrum from September 20 (189 days after discover) as well as in the spectrum from October 11 (210 days after discovery). The peak on the negative expansion velocity side is a bit higher than the second peak on the other side. Comparing the spec-tra from September 20 with the one from October 11, one can see that there are hardly any changes in the shape of the emission feature of the H α line.
4 Conclusions and discussion
With the TIGRE robotic telescope, we obtained a dense time series of high resolution spectra (R ≈ 20, 000) of Nova V5668 Sgr, which was discovered on March 15 in 2015, in the optical wavelength range between 3800 and 8800 Å. The nova is a typical DQ Her type nova, and it shows all the known classical systems of spectra: principal, diffuse en-hanced, and Orion spectra. We used the AAVSO visual light curve of Nova V5668 Sgr to spectroscopically characterise different phases, beginning with a phase of strong variations followed by a deep, prolonged minimum, leading then to a recovery and a phase at an almost constant brightness level. We could place Nova V5668 Sgr at an estimated distance of 1.6 kpc assuming a moderate extinction and a characteristic absolute magnitude of a classical nova type of DQ Her.
We presented four characteristic spectra of Nova V5668 Sgr and performed a detailed line identification on these respective spectra. We find that all the Hydrogen Balmer lines are present in all of the observed spectra, with H α the strongest line. The nova also shows many lines of iron in form of Fe ii and oxygen mainly in form of O i. In addition, we found some lines of Si ii, Ti ii, N ii, Mg ii, and Na i among others. In the later spectra we find some forbid-den lines of oxygen ([O i] and [O ii]). During the light curve evolution, the profiles of the features change from being P-Cygni profiles to later having only emission features.
We studied the observed spectra in order to find a corre-lation with the variations observed during the first 90 days in the visual light curve of Nova V5668 Sgr. We find that it is mainly the continuum flux which varies during the changes in the visual light curve. We can distinguish five relatively steep declines in the visual light curve of the nova. Our
dense series of spectra reveals that during the fast declin-ing phases the absorption features of many lines, especially the ones of hydrogen, shift to higher expansion velocities of about −2000 to −1500 km s−1. During the following, gener-ally slower rises of the light curve, these absorption features shift back to lower expansion velocities.
We also find that some absorption features, such as those of Fe ii, disappear for a few days during the third, fourth and fifth declining phases of the visual light curve, as well as one Si ii line during the fourth declining phase. During the third declining phase, new He i lines appear in the spectra, which had not been recorded before. In addition, we find that absorption features of some N i lines disappear while new emission features of N ii lines appear in the spectra dur-ing the third, fourth, and fifth declindur-ing phases in the light curve. The Na i D doublet line at around 5900 Å has many features that show daily variations during the first 90 days after discovery, which are probably due to a blend of the ab-sorption features of the two Na i lines with the He i line at 5875.6 Å.
Since a nova has a typical radial wind profile of in-creasing velocity with inin-creasing radius, one might suggest that what is seen during the minimum phases are layers of the envelope that lie farther outside and, therefore, show higher expansion velocities, occulting the layers and their less shifted line contributions from below. Such an optical depth effect would also explain the synchronisation of these changes in several, different lines: Comparing a graph of the positions of the minima of the absorption features of the O i line at 7773.0 Å, we find a good agreement with the vi-sual light curve. Whenever the light curve decreases the ab-sorption features move to higher expansion velocities. The second group of absorption features around −500 km s−1, which are also visible in many other lines, only shows the general trend of moving towards higher negative expansion velocities while the light curve is decreasing. However, the strong appearance of the highly blue shifted absorption just after any decline may also be explained by real, temporary changes in the expansion velocity, synchronized by some physical process with the steep brightness decreases of the nova. The same process may then also explain the synchro-nized changes in ionisation reported above. In any case, a lot of further analysis will be required to investigate these or other possible interpretations of the rich spectroscopic evidence presented here.
After having been enshrouded by dust (Banerjee et al. 2015a; Walter 2015) since around 90 days after discovery, the light curve of Nova V5668 Sgr has started to rise again around 130 days after discovery. The nova brightness hav-ing then returned to about 9 mag, we were able to resume our spectroscopic monitoring. After the deep minimum the lines in the spectra show only emission features and no ab-sorption features. The emission features have a clear double peak structure as can be clearly seen in the strongest line of H α at 6562.7 Å. The peak on the blue side is a bit higher than the red one.
The unique data set obtained by our ongoing dense spec-troscopic monitoring of Nova V5668 Sgr will be further analysed in a future publication, which will include detailed modelling of some spectra and will give us the opportunity to study the spectral evolution of this DQ Her type nova in much more detail.
Acknowledgements. We acknowledge with thanks the variable star
observations from the AAVSO International Database contributed by observers worldwide and used in this research. Our collabo-ration and work was much helped by travel money from bilat-eral (Conacyt-DAAD) project grant No. 207772 as well as Cona-cyt mobility grant No. 207662. We kindly acknowledge the DFG Graduiertenkolleg GrK 1351 for funding support as well as fund-ing of the DAIP-UG (534/2015) project grant of the University of Guanajuato.
References
Banerjee, D. P. K., Ashok, N. M., & Srivastava, M. 2015a, The Astronomer’s Telegram, 7748, 1
Banerjee, D. P. K., Ashok, N. M., Venkataraman, V., & Srivastava, M. 2015b, The Astronomer’s Telegram, 7303, 1
Banerjee, D. P. K., Joshi, V., Srivastava, M. K., & Ashok, N. M. 2016a, The Astronomer’s Telegram, 8753
Banerjee, D. P. K., Srivastava, M. K., Ashok, N. M., & Venkatara-man, V. 2016b, MNRAS, 455, L109
Bode, M. F. 2010, AN, 331, 160
Bode, M. F. & Evans, A. 2008, Classical Novae (Cambridge Uni-versity Press)
Cheung, C. C., Jean, P., Collaboration, F. L. A. T., & Shore, S. N. 2015a, The Astronomer’s Telegram, 7283, 1
Cheung, C. C., Jean, P., & Shore, S. N. 2015b, The Astronomer’s Telegram, 7315, 1
De Gennaro Aquino, I., Schr¨oder, K.-P., Mittag, M., et al. 2015, A&A, 581, A134
della Valle, M. & Livio, M. 1995, ApJ, 452, 704 Gallagher, J. S. & Starrfield, S. 1978, ARA&A, 16, 171 Gaposchkin, S. 1956, AJ, 61, 36
Harvey, E., Berdyugin, A., & Redman, M. 2015, The As-tronomer’s Telegram, 7986
Jack, D., Mittag, M., Schr¨oder, K.-P., et al. 2015, MNRAS, 451, 4104
Kazarovets, E. V. & Samus, N. N. 2015, Peremennye Zvezdy, 35, 3
Kuin, P., Page, K., Osborne, J., et al. 2015, The Astronomer’s Tele-gram, 8275
Kuiper, G. & Greenstein, J. 1960, Stars and Stellar Systems Vol 6: Stellar Atmospheres (University of Chicago Press)
McLaughlin, D. B. 1943, Publications of Michigan Observatory, 8, 149
McLaughlin, D. B. 1944, Popular Astronomy, 52, 109
Page, K. L., Beardmore, A. P., & Osborne, J. P. 2015a, The As-tronomer’s Telegram, 8133
Page, K. L., Kuin, N. P. M., Beardmore, A. P., Osborne, J. P., & Schwarz, G. J. 2015b, The Astronomer’s Telegram, 8054 Page, K. L., Kuin, N. P. M., Osborne, J. P., & Schwarz, G. J. 2015c,
The Astronomer’s Telegram, 7953
Payne-Gaposchkin, C. 1964, The Galactic Novae (Dover Publica-tions)
Schmitt, J. H. M. M., Schr¨oder, K.-P., Rauw, G., et al. 2014, AN, 335, 787
Strope, R. J., Schaefer, B. E., & Henden, A. A. 2010, AJ, 140, 34 Tajitsu, A., Sadakane, K., Naito, H., et al. 2016, ApJ, 818, 191 Wagner, R. M., Woodward, C. E., Starrfield, S., et al. 2016, in
American Astronomical Society Meeting Abstracts, Vol. 227, American Astronomical Society Meeting Abstracts, 239.10 Walter, F. M. 2015, The Astronomer’s Telegram, 7643, 1 Williams, S. C., Darnley, M. J., & Bode, M. F. 2015, The