Auroral spirals at Saturn
1
A. Radioti,1 D. Grodent,1 J.-C. G´erard,1 E. Roussos,2 D. Mitchell,3 B. Bonfond1 and W. Pryor4
A. Radioti, Laboratoire de Physique Atmosph´erique et Plan´etaire, Institut d’Astrophysique et de G´eophysique, Universit´e de Li`ege, Belgium. ([email protected])
1Laboratoire de Physique Atmosph´erique
et Plan´etaire, Institut d’Astrophysique et de G´eophysique, Universit´e de Li`ege, Belgium
2Max-Planck-Institute for Solar System
Research, Goettingen, Germany
3Applied Physics Laboratory, Johns
Hopkins University, Laurel, Maryland, USA
4Science Department, Central Arizona
Abstract.
2
We report observations of auroral spirals at Saturn propagating from
mid-3
night to noon via dawn, based on Cassini/UVIS measurements. The aurora
4
during that sequence is observed for the first time to consist of detached
fea-5
tures swirling as they propagate from dawn to early afternoon. The features
6
have a diameter of ∼6000 km in the ionosphere, which would correspond to
7
12 to 15 RS -wide plasma regions in the magnetosphere. Simultaneous ENA
8
enhancements are observed, however, they do not show a clear spiral form.
9
We estimate the velocity of the UV auroral features to decrease from 85%
10
of rigid corotation (28◦/h) near the equatorward edge to 68% of rigid
coro-11
tation (22◦/h) in the poleward edge. We discuss two posible scenarios which
12
could explain the generation of the auroral spirals. Firstly, we suggest that
13
the auroral spirals could be related to large dynamic hot populations which
14
create regions with strong velocity gradients. Alternatively, a less possible
15
theory could be that the auroral spirals are related to field line deformation
16
from the magnetosphere to the ionosphere, similar to the scenario proposed
17
to explain auroral spirals at Earth. Such field line twist can happen for a
con-18
figuration where the magnetospheric source region is located between a pair
19
of plasma flow vortices.
1. Introduction
Several theoretical and observational studies have dealt with the complexity of the
au-21
roral morphology at Saturn. Early studies suggested that the brightness and shape of
22
Saturn’s aurora varies with time and its general morphology corresponds to solar wind
23
changes [Grodent et al., 2005; Clarke et al., 2009]. Simultaneous HST and Cassini
ob-24
servations suggested that the quasi-continuous main UV emission at Saturn is produced
25
by magnetosphere-solar wind interaction, through the shear in rotational flow across the
26
open closed field line boundary [Bunce et al., 2008]. Magnetic reconnection in the
day-27
side magnetopause as well as in the nightside tail are suggested to largely influence the
28
morphology of Saturn’s aurora [Cowley et al., 2004; Badman et al., 2005].
29
The UV dawn auroral region, which is the main focus of the current study, is
occa-30
sionally observed to exhibit bright enhancements and poleward auroral expansions often
31
accompanied by closure of open magnetic flux [Mitchell et al., 2009; Nichols et al., 2014;
32
Radioti et al., 2014, 2015; Badman et al., 2015]. Such bright enhancements in the dawn
33
sector are often attributed to nightside reconnection events. Small-scale intensifications
34
in the nightside auroral emission are suggested to be signatures of dipolarisation in the
35
tail [Jackman et al., 2013] and the precursor to a more intense activity following tail
re-36
connection [Mitchell et al., 2009]. Localised UV enhancements related to tail reconnection
37
are observed to evolve into arc and spot-like small scale features, which resemble spirals
38
[Radioti et al., 2015]. These features are suggested to be related to plasma flows enhanced
39
from reconnection which diverge into multiple narrow channels then spread azimuthally
40
and radially. Additionally, small scale structures (from 500 km to several thousands of
km) are observed by UVIS at 06 to 18 LT and are related to patterns of upward field
42
aligned currents related to Kelvin-Helmholtz instabilities in the magnetopause of Saturn
43
[Grodent et al., 2011]. Plasma vortices associated to Kelvin-Helmholtz instability are
ob-44
served in Saturn’s dawn magnetopause and are suggested to form field-aligned current
45
systems which give rise to vortex footprints in the ionosphere [Fukazawa et al., 2007;
46
Masters et al., 2010]. Finally, Meredith et al. [2013] reported detached small-scale
struc-47
tures in Saturn’s prenoon UV aurora, based on Hubble Space Telescope observations, and
48
interpreted them as signatures of field-aligned currents associated with propagating ULF
49
waves.
50
In this study we investigate the origin of large spiral auroral features in the dawn sector
51
and in one possible interpretation we consider their association with particle injections. A
52
multi-instrumental study which combined UV, ENA (Energetic Neutral Atoms) and SKR
53
emissions [Mitchell et al., 2009] showed that UV auroral enhancements in the dawn sector
54
are indicative of the initiation of several recurrent acceleration events in the midnight to
55
dawn quadrant at radial distances of 15-20 RS. Saturn’s magnetospheric injections are
56
associated with inward moving flux tubes related to interchange instability (e.g. Mauk
57
et al. [2005]; Paranicas et al. [2007]) or particle acceleration related to the collapse of the
58
plasma sheet and tail reconnection (e.g. [Carbary et al., 2008; Mitchell et al., 2009]). Both
59
types of injections are investigated based on energetic particles and ENA emissions and
60
are believed to be connected with each other [Mitchell et al., 2014a]. Particle injections
61
have been previously suggested to generate auroral emissions at Saturn [Radioti et al.,
62
2009, 2013b]. Pitch angle diffusion and electron scattering within the injection region as
well as field-aligned currents driven by the pressure gradients along the boundaries of the
64
injected hot plasma cloud could generate aurora.
65
2. Observations of auroral spirals at Saturn
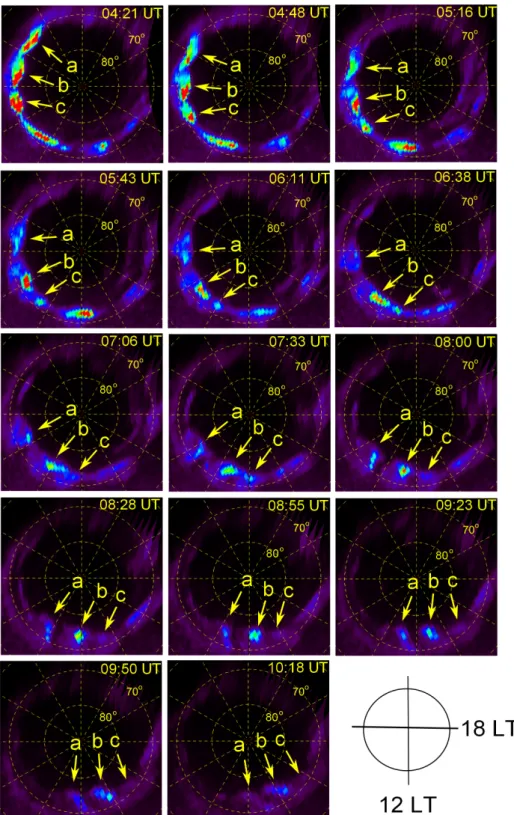
Figure 1 shows a sequence of polar projections of Saturn’s southern hemisphere obtained
66
with the FUV channel (111-191 nm) of the UVIS instrument [Esposito et al., 2004] on
67
board Cassini on DOY 197, 2008. The projections are constructed by combining slit
68
scans, which provide 64 spatial pixels of 1 mrad (along the slit) by 1.5 mrad (across the
69
slit) and the emission is assumed to peak at an altitude of 1100 km, using the method
70
described by Grodent et al. [2011]. Between the start of the 1st image and the end of the
71
last image, the sub-spacecraft planetocentric latitude increased from -28.7 to -21.4 degrees
72
and the spacecraft altitude changed from 9.5 to 11.5 RS. Because of the relatively high
73
sub-spacecraft latitude, the limb brightening effect is limited and therefore no correction
74
was applied.
75
During this sequence the main emission in the dawn sector consists of three detached
76
features labelled with a, b and c in Figure 1. The features are initially observed to be
77
aligned with the main emission, while as they propagate towards noon they form spirals,
78
a shape that is less evident for feature c. It should be noted that even though the features
79
do not completely satisfy the definition of a spiral, as they do not seem to curve out
80
from a central point, in the following we keep on using the term ’spiral’ for simplicity.
81
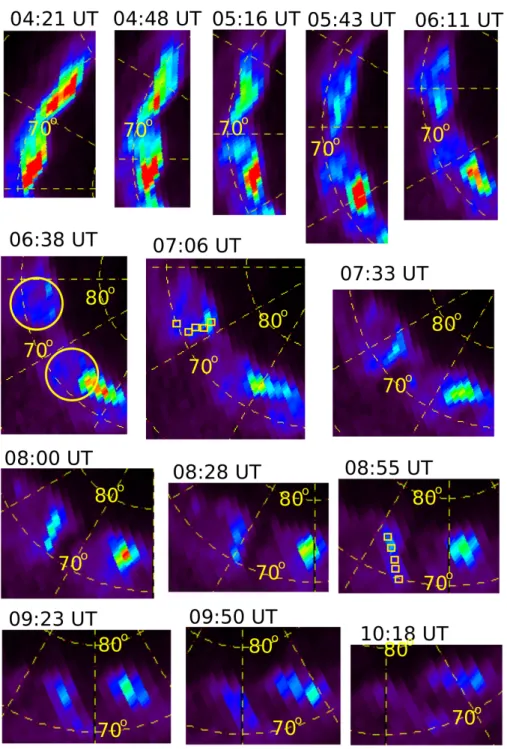
A close up view of the auroral features a and b is presented in Figure 2. We choose to
82
analyse further only features a and b as their spiral shape is more evident in the UVIS
83
images. Particularly, in the first five panels (up to 0638 UT) the features are not very well
84
organised. They are observed to be aligned with the main emission, while progressively
their shape changes and they become wider. The leading edge is moving slightly poleward
86
and the trailing edge is moving equatoward, an evolution more evident for feature b. At
87
0638 UT the features take a circular and coherent form. Two circles are drawn on top of
88
the emissions in the panel at 0638 UT for guidance. The spiral pattern continues during
89
at least the first half of the sequence (until 0800 UT). Afterwards the leading part of the
90
emissions is mainly evident, while the trailing part is fainter. A movie constructed based
91
on the polar projections of Figure 1 is included in the auxiliary material and shows the
92
evolution and motion of the features. The diameter of the features in the ionosphere is
93
on the order of 6000 km. The auroral features correspond to 12 to 15 RS -wide plasma
94
regions in the magnetosphere. For the magnetic mapping on the equatorial plane we
95
use a magnetic field model incorporating a current sheet with half thickness of 2.5 RS, a
96
magnetopause standoff distance of 22 and 27 RS, consistent with Achilleos et al. [2008]
97
inner and outer magnetopause boundary position, and the current sheet scaling laws from
98
Bunce et al. [2007]. The ’Cassini’ model of Dougherty et al. [2005] is used as internal
99
magnetic field model.
100
Even though the morphology of this auroral region has been occasionally observed to
101
change drastically (dramatic brightness enhancements and poleward expansions [Mitchell
102
et al., 2009; Nichols et al., 2014; Radioti et al., 2014, 2015; Badman et al., 2015]), this is the
103
first time that it is observed to break into separate detached spiral features along a large
104
local time sector (8 hours in LT). It should be noted that Meredith et al. [2013] recently
105
reported detached small-scale UV structures between 05 and 11 LT, which however do not
106
exhibit a spiral form. UV features which resemble small-scale spirals are recently observed
at one snapshot and were related to plasma flows enhanced from tail reconnection [Radioti
108
et al., 2015].
109
The emissions discussed here should not be confused with the ’bifurcations’ of the
110
main emission at noon-dusk quadrant [Radioti et al., 2011, 2013a], even though at the
111
later stage of their development (panel at 0950 and 1018 UT of Figure 1), they
resem-112
ble morphologically the bifurcations. The UV spirals are observed to originate in the
113
postmidnight-predawn sector, while the auroral bifurcations are generated at noon (see
114
Figure 1 in [Radioti et al., 2011]). The later are interpreted as magnetopause reconnection
115
signatures based on their observed location and on the expansion of the main emission to
116
lower latitudes following the appearance of the bifurcations [Radioti et al., 2011].
117
Simultaneously with the UV observations, the ion and neutral camera (INCA) on board
118
Cassini observed a localized enhancement in ENA emissions from Saturn’s magnetosphere,
119
evidence of a rotating heated plasma region whose peak emission is located near 7-10 RS
120
in the dawn-noon quadrant, possibly related to magnetospheric injections. Figure 3 shows
121
the ENA enhancement (indicated by the yellow arrow on the first panel) which starts in
122
the midnight-dawn quadrant (0200 UT), passes through dawn and then goes out of the
123
field of view. The images are integrated during 40 minutes centered on the time indicated
124
and the x-axis points noon. Due to the orientation of the camera a part of the emission
125
moves out of the field of view after 08:00 UT. The ENA emissions here consist of several
126
substructures. However, it is unclear whether they exhibit spiral forms, as we cannot
127
resolve the detailed structure due to limited resolution. Comparison of the UVIS and
128
INCA measurements suggests that the ENA enhancement is observed simultaneously and
129
on the same location as the UV feature a and partially b (Figure 1), implying that both
UV and ENA emissions are associated with the same dynamical event. Previous studies
131
showed that similar ENA enhancements are closely correlated with UV transient features
132
and are related to the same energetic particle injection event [Mitchell et al., 2009; Radioti
133
et al., 2013b].
134
3. On the origin of the auroral spirals
3.1. Large scale energetic particle injections
The UV auroral spirals observed here might be the optical signatures of large
magne-135
tospheric particle injections extended over several RS. Saturn’s magnetosphere contains
136
several sources of heated plasma either associated with inward moving flux tubes related to
137
interchange instability or particle acceleration related to nightside reconnection [Mitchell
138
et al., 2014a]. An association of the present UV auroral emissions with magnetospheric
139
injections is supported by the simultaneous UV-ENA emissions as discussed above.
Addi-140
tionally, the UV brightness of the features decays with time, which is in accordance with
141
the expectations of the UV counterpart of particle injections, considering pitch angle
dif-142
fusion and electron scattering as the driving mechanism [Radioti et al., 2013b]. However,
143
it should be noted that this cannot be the only triggering mechanism, as field-aligned
144
currents driven by the pressure gradients along the boundaries of the injected hot plasma
145
cloud related to the ENA enhancements should contribute to the UV emission part, as
146
explained by Radioti et al. [2013b].
147
A key parameter responsible for the spiral shape of the auroral emission is the corotation
148
lag of the source population. Within an injection event the corotation fraction might
149
change locally, because of the dynamics of the feature. Carbary and Mitchell [2014]
150
analysed ENA measurements and revealed substructures within the ENA emissions and
large velocity variations as a function of local time and L-shell. They showed that in
152
the dawn sector the velocities decrease with radial distance (with an exception of a local
153
increase of the velocities at 20 RS). In particularly, they showed that the velocity may
154
vary in the dawn sector from ∼30◦/h (∼90% of rigid corotation) at 5 RS to ∼23◦/h
155
(∼68% of rigid corotation) at 20RS. In addition to ENA emissions, particle measurements
156
have been used to investigate the flow velocities. Thomsen et al. [2010] showed that the
157
measured azimuthal flow speeds are characteristically below full corotation over 5 to 20
158
L-Shell, varying on average from ∼50% to ∼70% of rigid corotation. Livi et al. [2014]
159
demonstrated that between 10 and 13 RS the thermal plasma rotation velocity accelerates
160
once more toward rigid corotation but abruptly stops at 13 RS. They also showed that
161
the velocities may vary largely at given radial distance. For example at 12 RS it may vary
162
from 20 to 80% of rigid corotation.
163
In the following, we estimate the velocity of the auroral feature based on the present
164
observations. We trace the motion of the feature a starting from panel at 0611 UT, as
165
in the beginning of the sequence the emission changes randomly from panel to panel and
166
at around 0611 UT stabilises its shape. We follow the motion of the leading part of the
167
emission (leading in local time) which persists until the end of the sequence. We trace
168
the longitude of the peak of the emission at certain latitudes (70◦, 71◦, 72◦, 73◦ and 74◦)
169
and plot it as a function of time (panel a Figure 4). These locations are shown by the
170
yellow diamonds on top of the emission at panels 0706 and 0855 UT of Figure 2. We
171
apply a linear fit function (solid lines in panel a of Figure 4) to the set of data at each
172
latitude and we show that the emission rotates at a different fraction of the rigid corotation
173
starting from 68% (22◦/h) for the poleward part and increasing up to 85% (28◦/h) for
the most equatorward part. In our analysis we consider that the electron drift is only due
175
to corotation, because the gradient-curvature drift is negligible at these L-Shells. This
176
statement is based on the estimation of the gradient-curvature drift for electron energies
177
between 1-10 KeV, which we find to be on the order of 5% of the corotation for the L-shell
178
under study, following the method described in Roussos et al. [2013].
179
Panel b Figure 4 shows the decrease of the feature’s corotation fraction as a function
180
of latitude. The magnetically mapped radial distance is also indicated. The corotation
181
fraction is estimated to decrease with a rate of 4.2% of rigid corotation per degree of
182
latitude based on a linear fit (solid line). In Figure 4, panel c we plot a simulated emission
183
as a function of time based on the estimated corotation fraction. The snapshots are
184
calculated every 50 minutes and each color stands for the emission at different latitudes.
185
The simulated pattern resembles the motion of the leading part of the observed auroral
186
spiral. It should be noted that here we consider only the leading part of the auroral
187
emission. The evolution of the trailing part (lagging in local time) also requires a velocity
188
gradient. However, a similar analysis for the trailing part, which aims to derive the
189
gradient, would be inaccurate due to the fact that the spiral shape is not conserved until
190
the end of the sequence, possibly because the emission is below the UVIS threshold.
191
We suggest that the spiral auroral features could be the ionospheric signatures of large
192
(12-15 RS) injections, considering that within the injection the corotation fraction changes
193
locally, because of the dynamical behaviour of the event. This scenario could work for
194
strong velocity gradients at a rate of 4.2 % of rigid corotation per degree of latitude, as it
195
is shown in the above analyses. The velocities estimated from the auroral measurements,
196
which result at the velocity gradient are in accordance with the particle velocities derived
based on magnetospheric data [Thomsen et al., 2010; Livi et al., 2014] and ENA emissions
198
[Carbary and Mitchell , 2014].
199
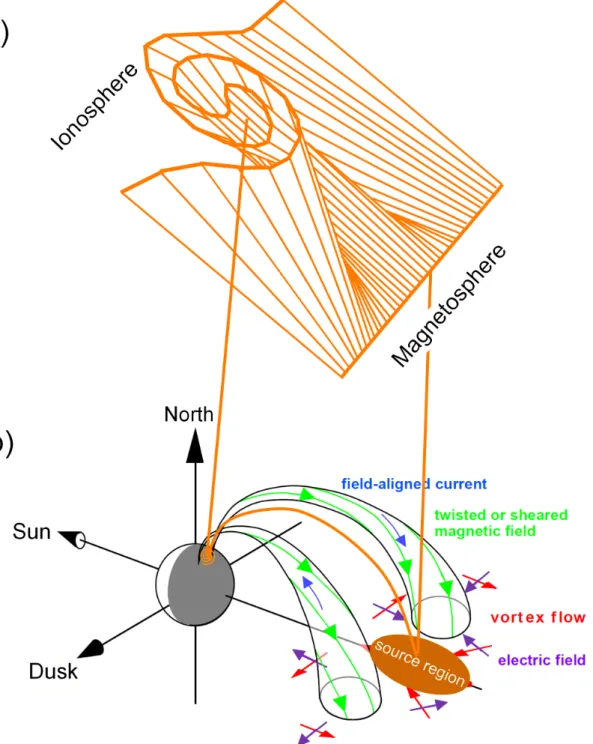
3.2. Field line deformation from the magnetosphere to the ionosphere
Another possible interpretation of the UV auroral spirals, indirectly related to
magne-200
tospheric plasma vortices, is field line deformation (twist) from the magnetosphere to the
201
ionosphere as suggested to explain auroral spirals (of 200-300 km large) at Earth
[Keil-202
ing et al., 2009] and illustrated in panel a, Figure 5. Field line deformation can happen
203
for a configuration where the magnetospheric source region is located between a pair of
204
opposite rotating plasma flow vortices. The auroral spiral is related to a magnetic
field-205
aligned current system which is generated to connect the magnetospheric source region
206
with the ionosphere [Keiling et al., 2009]. This scenario is in accordance with the fact
207
that the magnetospheric ENA emissions (Figure 3) do not form clear spirals, while the
208
simultaneous UV emissions (Figure 1) at the polar end of the twisted field lines form
209
spiral structures. The field line deformation theory differs from the scenario related to
210
injections. According to it, the spiral shape of the auroral emission is the result of the
211
twist of the field lines from the magnetosphere to the ionosphere and does not require
212
an extended in latitude (radial distance) magnetospheric plasma population with strong
213
velocity gradient, as it is the case for the scenario related to injections.
214
A similar process is suggested to explain auroral spiral-like structures observed only
215
during a snapshot, following the onset of tail reconnection [Radioti et al., 2015]. The
216
present observations differ from those reported in Radioti et al. [2015], as they describe
217
large scale spirals that are persistent for several hours. The formation of the spirals
218
observed here could be related to vortices not necessary associated with tail reconnection.
The field line deformation scenario requires that the auroral spiral is not the ionospheric
220
footprint of the magnetospheric plasma flow vortex, but however, flow vortices are essential
221
for providing the necessary conditions for the generation process of the auroral spiral form.
222
Cassini’s energetic particle detector observed fast and brief episodes of convective flows
223
in the nightside magnetosphere [Mitchell et al., 2014a], which have been identified as
224
transitional events between current sheet collapse and interchange. The brief periods
225
of radial flow could set up oppositely directed flow at their boundaries, assuming they
226
are limited in azimuth. Additionally, simulation studies [Jia et al., 2012] predict fast
227
plasma flows, released from tail reconnection at Saturn, to move towards the planet and
228
create flow shear with the surroundings. Consequently, those rapidly moving flux tubes
229
are expected to generate strong disturbances in the ionosphere. Plasma vortices in the
230
Saturnian magnetosphere could be formed by nonlinear Kelvin-Helmholtz instabilities at
231
Saturn’s morning magnetopause [Masters et al., 2010]. However, such vortices cannot
232
provide the necessary conditions for the spiral formation in the ionosphere, in the context
233
of the field-line deformation scenario, as a pair of them would be same-directed.
234
In summary, even though there are arguments that a field line deformation theory could
235
form auroral spirals at Saturn, this might not be the most possible scenario to interpret
236
the present observations. The main concern is that there is no direct evidence that a twin
237
vortex in the equatorial plane could remain coherent with time over a large local time
238
sector, in order to support the persistence of the spiral shape observed here over several
239
hours.
4. Summary and conclusions
In this study we report for the first time auroral spirals at Saturn propagating from
241
midnight to noon. The emission consists of several persistent detached swirling features
242
extended over a larger local time sector. Simultaneously ENA enhancements are observed,
243
however, they do not show a clear vortical form, possibly due to their limited resolution.
244
The UV features have a diameter of∼6000 km in the ionosphere, which would correspond
245
to 12 to 15 RS -wide plasma regions in the magnetosphere. We estimated the velocity of
246
the auroral feature and concluded that there is a strong velocity gradient with a decrease
247
rate of 4.2% of rigid corotation per degree of latitude. In particularly, we show that
248
the velocity decreases from 85% (28◦/h) in the equatorward part to 68% (22◦/h) in the
249
poleward part. Particle velocities derived from magnetospheric data [Thomsen et al.,
250
2010; Livi et al., 2014] and ENA emissions [Carbary and Mitchell , 2014], showed large
251
variations of the corotation velocity fraction as a function of radial distance in accordance
252
with the values derived from the auroral observations. We discuss two scenarios as possible
253
mechanisms for the generation of the auroral spirals.
254
Firstly, we suggest that the spiral auroral features could be the ionospheric signatures
255
of large (12-15 RS) injections, considering that within the injection the corotation fraction
256
changes locally, because of the dynamical behaviour of the event. We perform a simple
257
simulation of the auroral emission considering magnetospheric plasma regions rotating
258
at different velocities and we generate the observed auroral pattern. This scenario could
259
work for strong velocity gradients at a rate of 4.2 % of rigid corotation per degree of
260
latitude. Alternatively, we consider field line deformation (twist) from the magnetosphere
261
to the ionosphere, illustrated in panel a, Figure 5, as another possible mechanism that
could generate the auroral spirals. According to this scenario the auroral spiral is not
263
the ionospheric footprint of the magnetospheric plasma flow vortex, but flow vortices are
264
essential for providing the necessary conditions for the generation process of the auroral
265
spiral form. This scenario is in accordance with the fact that the magnetospheric ENA
266
(Figure 3) emissions do not form clear spirals, while the simultaneous UV emissions
(Fig-267
ure 1) at the polar end of the twisted field lines form spiral structures. This is however,
268
a less possible theory as there is not evidence that a twin vortex in the equatorial plane
269
could remain coherent with time over a large local time sector. Finally, it should be
270
noted that the auroral features observed here could not be the direct optical signatures of
271
plasma vortical flows related to Kelvin-Helmholtz instabilities in the magnetopause
[Mas-272
ters et al., 2010]. The Kelvin-Helmholtz vortical flows are generated close to noon and
273
propagate antisunward, while the UV features here are detected in the pre-dawn sector
274
and propagate with a large velocity of 68 to 85 % of rigid corotation towards noon.
275
Acknowledgments.
276
This work is based on observations acquired with the UVIS instrument onboard the
277
NASA/ESA Cassini spacecraft and are available in
278
https://pds.jpl.nasa.gov/tools/subscription service/SS-20150703.shtml. This research
279
was supported by the Belgian Fund for Scientific Research (FNRS) and the PRODEX
280
Program managed by the European Space Agency in collaboration with the Belgian
Fed-281
eral Science Policy Office. B.B. is funded by the Belgian Fund for Scientific Research
282
(FNRS).
References
Achilleos, N., C. S. Arridge, C. Bertucci, C. M. Jackman, M. K. Dougherty, K. K.
Khu-284
rana, and C. T. Russell, Large-scale dynamics of Saturn’s magnetopause: Observations
285
by Cassini, Journal of Geophysical Research (Space Physics), 113 , 11,209, 2008.
286
Badman, S. V., E. J. Bunce, J. T. Clarke, S. W. H. Cowley, J.-C. G´eRard, D. Grodent, and
287
S. E. Milan, Open flux estimates in Saturn’s magnetosphere during the January 2004
288
Cassini-HST campaign, and implications for reconnection rates, Journal of Geophysical
289
Research (Space Physics), 110 , 11,216, 2005.
290
Badman, S. V., et al., Saturns auroral morphology and field-aligned currents during a
291
solar wind compression, Icarus, 2015.
292
Bunce, E. J., S. W. H. Cowley, I. I. Alexeev, C. S. Arridge, M. K. Dougherty, J. D.
293
Nichols, and C. T. Russell, Cassini observations of the variation of Saturn’s ring current
294
parameters with system size, Journal of Geophysical Research (Space Physics), 112 ,
295
10,202, 2007.
296
Bunce, E. J., et al., Origin of Saturn’s aurora: Simultaneous observations by Cassini and
297
the Hubble Space Telescope, Journal of Geophysical Research (Space Physics), 113 ,
298
9209, 2008.
299
Carbary, J. F., and D. G. Mitchell, Keogram analysis of ENA images at Saturn, Journal
300
of Geophysical Research (Space Physics), 119 , 1771–1780, 2014.
301
Carbary, J. F., D. G. Mitchell, P. Brandt, E. C. Roelof, and S. M. Krimigis,
Statisti-302
cal morphology of ENA emissions at Saturn, Journal of Geophysical Research (Space
303
Physics), 113 , 5210, 2008.
304
Clarke, J. T., et al., Response of Jupiter’s and Saturn’s auroral activity to the solar wind,
Journal of Geophysical Research (Space Physics), 114 , 5210, 2009.
306
Cowley, S., E. Bunce, and R. Prang´e, Saturn’s polar ionospheric flows and their relation
307
to the main auroral oval, Annales Geophysicae, 22 , 1379–1394, 2004.
308
Dougherty, M. K., et al., Cassini Magnetometer Observations During Saturn Orbit
Inser-309
tion, Science, 307 , 1266–1270, 2005.
310
Esposito, L. W., et al., The Cassini Ultraviolet Imaging Spectrograph Investigation, Space
311
Science Review , 115 , 299–361, 2004.
312
Fukazawa, K., T. Ogino, and R. J. Walker, Vortex-associated reconnection for northward
313
IMF in the Kronian magnetosphere, Geophys. Res. Lett., , 34 , 23,201, 2007.
314
Grodent, D., J.-C. G´erard, S. W. H. Cowley, E. J. Bunce, and J. T. Clarke, Variable
315
morphology of Saturn’s southern ultraviolet aurora, Journal of Geophysical Research
316
(Space Physics), 110 , 7215, 2005.
317
Grodent, D., J. Gustin, J.-C. G´erard, A. Radioti, B. Bonfond, and W. R. Pryor,
Small-318
scale structures in Saturn’s ultraviolet aurora, Journal of Geophysical Research (Space
319
Physics), 116 , 9225, 2011.
320
Jackman, C. M., N. Achilleos, S. W. H. Cowley, E. J. Bunce, A. Radioti, D. Grodent,
321
S. V. Badman, M. K. Dougherty, and W. Pryor, Auroral counterpart of magnetic field
322
dipolarizations in Saturn’s tail, Planetary and Space Science, 82 , 34–42, 2013.
323
Jia, X., K. C. Hansen, T. I. Gombosi, M. G. Kivelson, G. T´oth, D. L. DeZeeuw, and
324
A. J. Ridley, Magnetospheric configuration and dynamics of Saturn’s magnetosphere:
325
A global MHD simulation, Journal of Geophysical Research (Space Physics), 117 , 5225,
326
2012.
327
Keiling, A., et al., THEMIS ground-space observations during the development of auroral
spirals, Annales Geophysicae, 27 , 4317–4332, 2009.
329
Livi, R., J. Goldstein, J. L. Burch, F. Crary, A. M. Rymer, D. G. Mitchell, and A. M.
330
Persoon, Multi-instrument analysis of plasma parameters in Saturn’s equatorial, inner
331
magnetosphere using corrections for corrections for spacecraft potential and penetrating
332
background radiation, Journal of Geophysical Research (Space Physics), 119 , 3683–
333
3707, 2014.
334
Masters, A., et al., Cassini observations of a Kelvin-Helmholtz vortex in Saturn’s outer
335
magnetosphere, Journal of Geophysical Research (Space Physics), 115 , 7225, 2010.
336
Mauk, B. H., et al., Energetic particle injections in Saturn’s magnetosphere, Geophys.
337
Res. Lett., , 32 , 14, 2005.
338
Meredith, C. J., S. W. H. Cowley, K. C. Hansen, J. D. Nichols, and T. K. Yeoman,
339
Simultaneous conjugate observations of small-scale structures in Saturn’s dayside
ultra-340
violet auroras: Implications for physical origins, Journal of Geophysical Research (Space
341
Physics), 118 , 2244–2266, 2013.
342
Mitchell, D. G., et al., Recurrent energization of plasma in the midnight-to-dawn quadrant
343
of Saturn’s magnetosphere, and its relationship to auroral UV and radio emissions,
344
Planetary and Space Science, 57 , 1732–1742, 2009.
345
Mitchell, D. G., et al., Injection, Interchange, and Reconnection: Energetic Particle
Ob-346
servations in Saturns Magnetosphere, Magnetotail in the Solar System, Geophysical
347
Monograph, 2014a.
348
Nichols, J. D., et al., Dynamic auroral storms on Saturn as observed by the Hubble Space
349
Telescope, Geophysical Research Letters, 41 , 3323–3330, 2014.
350
Paranicas, C., et al., Energetic electrons injected into Saturn’s neutral gas cloud, Geophys.
Res. Lett., , 34 , 2109, 2007.
352
Radioti, A., D. Grodent, J.-C. G´erard, S. E. Milan, B. Bonfond, J. Gustin, and W. Pryor,
353
Bifurcations of the main auroral ring at Saturn: ionospheric signatures of
consecu-354
tive reconnection events at the magnetopause, Journal of Geophysical Research (Space
355
Physics), 116 , 11,209, 2011.
356
Radioti, A., D. Grodent, J.-C. G´erard, B. Bonfond, J. Gustin, W. Pryor, J. M. Jasinski,
357
and C. S. Arridge, Auroral signatures of multiple magnetopause reconnection at Saturn,
358
Geophysical Research Letters, 40 , 4498–4502, 2013a.
359
Radioti, A., E. Roussos, D. Grodent, J.-C. G´eRard, N. Krupp, D. G. Mitchell, J. Gustin,
360
B. Bonfond, and W. Pryor, Signatures of magnetospheric injections in Saturn’s aurora,
361
Journal of Geophysical Research (Space Physics), 118 , 1922–1933, 2013b.
362
Radioti, A., D. Grodent, J.-C. G´erard, S. E. Milan, R. C. Fear, C. M. Jackman, B.
Bon-363
fond, and W. Pryor, Saturn’s elusive nightside polar arc, Geophysical Research Letters,
364
2014.
365
Radioti, A., D. Grodent, X. Jia, J. C. G´erard, B. Bonfond, W. Pryor, J. Gustin, D. G.
366
Mitchell, and C. M. Jackman, A multi-scale magnetotail reconnection event at Saturn
367
and associated flows: Cassini/UVIS observations, Icarus, 2015.
368
Radioti, A., et al., Transient auroral features at Saturn: Signatures of energetic particle
369
injections in the magnetosphere, Journal of Geophysical Research (Space Physics), 114 ,
370
3210, 2009.
371
Roussos, E., M. Andriopoulou, N. Krupp, A. Kotova, C. Paranicas, S. M. Krimigis, and
372
D. G. Mitchell, Numerical simulation of energetic electron microsignature drifts at
Sat-373
urn: Methods and applications, Icarus, 226 , 1595–1611, 2013.
Thomsen, M. F., D. B. Reisenfeld, D. M. Delapp, R. L. Tokar, D. T. Young, F. J. Crary,
375
E. C. Sittler, M. A. McGraw, and J. D. Williams, Survey of ion plasma parameters in
376
Saturn’s magnetosphere, Journal of Geophysical Research (Space Physics), 115 , 10,220,
377
2010.
04:21 UT 04:48 UT 05:16 UT 05:43 UT 07:33 UT 07:06 UT 06:38 UT 06:11 UT 08:00 UT 08:28 UT 08:55 UT 09:23 UT 09:50 UT 10:18 UT
Figure 1. A sequence of polar projections of Saturn’s southern aurora obtained with the FUV channel of UVIS on board Cassini. The first image starts at 0421 UT and the last one at 1018 UT on DOY 197, 2008. Noon is to the bottom and dusk to the right. The grid shows latitudes at intervals of 10◦ and meridians of 30◦. Yellow arrows indicate the separate intensifications in
05:43 UT
06:38 UT
06:11 UT
07:33 UT
07:06 UT
08:00 UT
05:16 UT
08:28 UT
04:48 UT
80
80
80
80
70
70
70
70
70
70
70
70
04:21 UT
08:55 UT
09:23 UT
09:50 UT
10:18 UT
Figure 2. Projected close ups of a selected region on the polar projections from Figure 1 starting at 0421 to 1018 UT. The images show the two features a and b that form auroral spirals. Two circles are drawn on top of the two auroral features in the images taken at 0638 UT, in order to indicate the spiral form. The diamonds at panels 0706 and 0855 UT indicate the coordinates at certain latitudes (70◦, 71◦, 72◦, 73◦ and 74◦) used to calculate the corotation fractions.
04:21 UT 04:48 UT 07:33 UT 07:06 UT 08:00 UT 08:28 UT 08:55 UT 09:23 UT 09:50 UT 10:18 UT a/b
Figure 3. ENA emissions from Saturn’s magnetosphere on DOY 197, 2008. The images are 40 min integration centered on the time indicated. The two circles represent the E-ring boundaries at 2.5 and 7.5 RS. The innermost circle is Saturn’s limb (1 RS). The Z axis is aligned with Saturn’s spin axis, X axis (highlighted in red) indicates the direction toward the sun, and Y axis points to dusk. Arrows indicate the ENA enhancement discussed in this work and possibly correspond to UV emission a and b shown in Figure 1.
Panel a: Longitude of the leading part of the UV emission (see Figure 2) at five latitudes
379
(70◦, 71◦, 72◦, 73◦ and 74◦) as a function of time. Some of these points are indicated on top of
380
the emission at panels 0706 and 0855 UT of Figure 2. The solid lines represent a linear fit to
381
the set of data at each latitude. The corotation rates 68%, 72%,75%,80% and 85% correspond
382
to 22◦/h, 24◦/h, 25◦/h, 26◦/h and 28◦/h, respectively. The error bars indicate the standard
383
deviations of longitude at a given time. Panel b: shows the decrease of the feature’s corotation
384
fraction as a function of latitude. The respective magnetically mapped radial distance is derived
385
for magnetopause standoff distance of 22 and 27 RS and is indicated for 70◦ and 75◦ latitude.
386
Details of the magnetic mapping are described in the text. The corotation fraction decreases
387
at a rate of 4.2% of rigid corotation per degree of latitude based on a linear fit (solid line).
388
Panel c: Simulated emission as a function of time based on the estimated corotation fraction.
389
The snapshots are taken every 50 minutes and each color stands for the emission at different
390
latitudes.
Dusk
North
Sun
Figure 5. Schematic illustrating the generation of an auroral spiral and its source region, located between two oppositely rotating plasma vortices in the magnetosphere of Saturn (adapted from Radioti et al. [2015]). The field line twisting from the magnetosphere to the ionosphere, which gives rise to auroral spirals is illustrated in a close up. The same mechanism is believed to explain auroral spirals at Earth [Keiling et al., 2009]. This simple illustration does not consider