American Dairy Science Association, 2004.
Type Trait (Co)Variance Components for Five Dairy Breeds
G. R. Wiggans,1N. Gengler,2and J. R. Wright1
1Animal Improvement Programs Laboratory, Agricultural Research Service,
USDA, Beltsville, MD 20705-2350
2Animal Science Unit, Gembloux Agricultural University, B-5030 Gembloux, Belgium
and National Fund for Scientifique Research, B-1000 Brussels, Belgium
ABSTRACT
(Co)variance components were estimated for final score and 14 or 15 linear type traits for the Ayrshire, Brown Swiss, Guernsey, Jersey, and Milking Shorthorn breeds. Appraisals from 1995 or later were used. New estimates were calculated to accommodate changes in scoring of traits and because of a change from multipli-cative to additive adjustment for age and lactation stage. The adjustment method was changed for better support of the adjustment for heterogeneous variance within iteration, which was implemented in 2002. The largest changes in heritability were an increase of 0.10 for rump angle for Milking Shorthorns and a decrease of 0.11 for udder depth for Jerseys. The new estimates of (co)variance components should provide improved accuracy of type evaluations, particularly for traits that have had variance changes over time.
(Key words: type trait, variance component esti-mation)
INTRODUCTION
A multitrait model has been used by the Animal Im-provement Programs Laboratory, ARS, USDA (Belts-ville, MD), to calculate genetic evaluations for linear type traits of all breeds except Holstein since February 1998 (Gengler et al., 1999). The Holstein Association USA (Brattleboro, VT) calculates the Holstein type evaluations. The multitrait analysis used in the USDA evaluations was implemented using a canonical trans-formation with missing data (Ducrocq and Besbes, 1993). The required (co)variance matrices, which in-clude all linear traits for each breed, were estimated as described by Gengler et al. (1997) in 1997.
Changes in the appraisal system for linear type traits have been implemented since 1997. Scoring of body depth was discontinued during 2002 for the Jersey
Received November 20, 2003. Accepted March 28, 2004.
Corresponding author: G. R. Wiggans; e-mail: wiggans@aipl. arsusda.gov.
2324
Table 1. Criteria for selecting data.
Minimum number of Minimum number of cows scored per herd times herd scored Breed appraisal date 1995–2002
Ayrshire 5 No minimum
Brown Swiss 10 4
Guernsey 10 6
Jersey1 10 6
Milking Shorthorn 5 5
1Additional edit of 10% sample based on herd code imposed.
breed. The Ayrshire breed now assigns only nine differ-ent scores, but these range over a 50-point scale for compatibility with earlier data. Beginning in 1994, a substantial increase in within-herd-year variance oc-curred in the Brown Swiss breed.
An adjustment for heterogeneous variance was im-plemented in May 2001 for Jerseys and in August 2002 for the other breeds evaluated by USDA (Gengler et al., 2001a,b,c). The method of accounting for age and stage effects was simplified by discontinuing the multi-plicative adjustment and by removing these effects from the model. They were removed from the model to ex-clude them from the heterogeneous variance adjust-ment. An additive adjustment was applied prior to iter-ation. The changes in data and model motivated the update of (co)variance estimates.
MATERIALS AND METHODS Data
Based on an investigation of changes in variances within herd-year of appraisal, only appraisals from
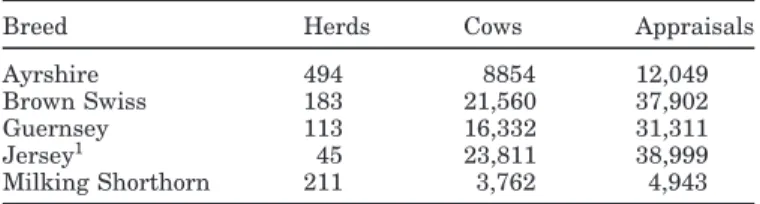
Table 2. Numbers of herds, cows, and appraisals.
Breed Herds Cows Appraisals
Ayrshire 494 8854 12,049
Brown Swiss 183 21,560 37,902
Guernsey 113 16,332 31,311
Jersey1 45 23,811 38,999
Milking Shorthorn 211 3,762 4,943
Table 3. Number of levels of effects by breed.
Fixed effects
Random effects Herd
appraisal Permanent
Breed date Age Stage environment Animal Ayrshire 979 27 22 5332 15,931 Brown Swiss 2758 35 24 18,623 36,870 Guernsey 2291 35 21 15,528 32,746 Jersey 794 22 14 17,214 36,690 Milking 462 28 24 3172 8383 Shorthorn
1995 and later were included. The amount of data was reduced to the capacity of the variance component esti-mation program by using the edits in Table 1. These edits were intended to eliminate herds and appraisal dates with little information. The additional reduction required for the Jersey data was accomplished by select-ing a 10% sample based on herd. Estimates from the sample were confirmed by calculating estimates from 3 additional samples. Numbers of herds, cows, and ap-praisals included for each breed are in Table 2.
Estimation of Variance Components
The variance component estimation program was provided by I. Misztal (University of Georgia, Athens), and calculations were as described by Gengler et al. (1997), using expectation-maximization REML and ca-nonical transformation. Final score was not included in the multitrait analysis because the Ayrshire and Jersey breeds compute this trait from linear scores. Variance components for final score were estimated as a single trait. The model included fixed effects of herd appraisal date, age, and lactation stage and random effects of animal and permanent environment. The numbers of levels of effects by breed are in Table 3. The
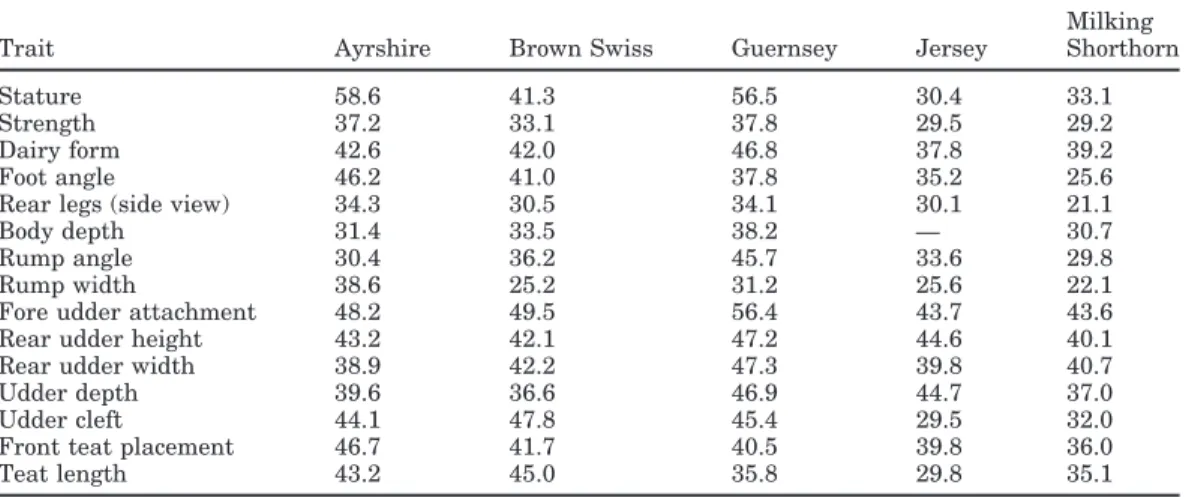
Table 5. Estimated total variance for 15 linear type traits by breed.
Milking Trait Ayrshire Brown Swiss Guernsey Jersey Shorthorn
Stature 58.6 41.3 56.5 30.4 33.1
Strength 37.2 33.1 37.8 29.5 29.2
Dairy form 42.6 42.0 46.8 37.8 39.2
Foot angle 46.2 41.0 37.8 35.2 25.6
Rear legs (side view) 34.3 30.5 34.1 30.1 21.1
Body depth 31.4 33.5 38.2 — 30.7
Rump angle 30.4 36.2 45.7 33.6 29.8
Rump width 38.6 25.2 31.2 25.6 22.1
Fore udder attachment 48.2 49.5 56.4 43.7 43.6
Rear udder height 43.2 42.1 47.2 44.6 40.1
Rear udder width 38.9 42.2 47.3 39.8 40.7
Udder depth 39.6 36.6 46.9 44.7 37.0
Udder cleft 44.1 47.8 45.4 29.5 32.0
Front teat placement 46.7 41.7 40.5 39.8 36.0
Teat length 43.2 45.0 35.8 29.8 35.1
Table 4. Estimated heritability, repeatability, and total variance for
final score by breed.
Total Breed Heritability Repeatability variance
Ayrshire 0.27 0.49 9.2
Brown Swiss 0.29 0.60 7.9
Guernsey 0.20 0.48 26.4
Jersey 0.19 0.44 32.4
Milking Shorthorn 0.20 0.60 9.1
stage effect consisted of up to 8 levels within parity. Age was by 2-mo groups within parity except that larger numbers of months were included for the youngest and oldest ages. Following the policy for genetic evaluations, appraisals from only the first 2 parities were included for Jerseys.
The effects of the changes in (co)variance components were investigated by calculating correlations between evaluations using the old and new (co)variances. The change in variance of evaluations also was computed. Bulls used in AI, born in 1975 or later, and with a final score reliability of 75% or more and cows born in 1995 or later were included.
RESULTS Heritabilities
Heritabilities for final score by breed are given in Table 4. They ranged from 0.19 for Jersey to 0.29 for Brown Swiss. There was substantial variation in total variance. In 2002, 66% of first-parity Ayrshires scored between 81 and 85, whereas only 47% of Jerseys scored between 78 and 82. These 2 ranges include the 5 most common scores for each breed. The total variances for the linear traits by breed are in Table 5. The heritabilit-ies and genetic and phenotypic correlations for the
lin-Table 6. Estimated genetic (above diagonal) and phenotypic (below diagonal) correlations and heritabilities (on diagonal) among 15 linear type traits of Ay rshires. Rear legs Fore Rear Rear Front Dairy Foot (side Body Rump Rump udder udder udder Udder Udder teat Teat Item Stature Strength form angle view) depth angle width attachment height width depth cleft placement length Stature 0.54 0.70 0.23 0.43 0.04 0.60 − 0.09 0.71 0.28 0.14 0.26 0.28 0.05 0.10 0.32 Strength 0.44 0.31 − 0.17 0.46 − 0.20 0.81 − 0.13 0.71 0.21 0.04 0.34 0.01 − 0.11 0.00 0.26 Dairy form 0.12 − 0.19 0.20 0.08 0.32 0.28 − 0.20 0.02 − 0.05 0.47 0.26 − 0.11 0.21 0.20 0.00 Foot angle 0.17 0.23 0.00 0.15 − 0.45 0.38 − 0.20 0.56 0.36 0.32 0.47 0.24 0.15 0.20 0.22 Rear legs (side view) − 0.02 − 0.11 0.12 − 0.29 0.15 − 0.07 − 0.16 − 0.12 − 0.05 − 0.20 − 0.25 0.00 − 0.24 0.10 − 0.17 Body depth 0.36 0.56 0.17 0.15 − 0.05 0.29 − 0.16 0.54 0.04 0.19 0.37 − 0.20 0.00 0.06 0.26 Rump angle 0.01 − 0.04 − 0.05 − 0.08 − 0.04 − 0.03 0.28 − 0.18 − 0.33 − 0.23 − 0.19 − 0.19 − 0.10 − 0.05 − 0.07 Rump width 0.46 0.52 − 0.02 0.23 − 0.08 0.37 − 0.07 0.35 0.26 0.21 0.38 0.16 − 0.04 0.07 0.29 Fore udder attachment 0.13 0.11 0.05 0.17 − 0.04 0.07 − 0.16 0.15 0.21 0.43 0.56 0.61 0.27 0.54 − 0.01 Rear udder height 0.08 0.01 0.32 0.12 − 0.05 0.11 − 0.12 0.10 0.28 0.26 0.75 0.16 0.49 0.25 0.03 Rear udder width 0.15 0.19 0.23 0.16 − 0.09 0.19 − 0.08 0.24 0.26 0.53 0.19 0.16 0.40 0.44 0.13 Udder depth 0.15 − 0.04 − 0.08 0.09 − 0.01 − 0.17 − 0.10 0.06 0.42 0.11 0.04 0.31 0.31 0.33 − 0.03 Udder cleft 0.02 0.00 0.15 0.07 − 0.02 0.04 − 0.06 0.01 0.23 0.31 0.25 0.27 0.23 0.48 − 0.02 Front teat placement 0.06 0.03 0.10 0.07 0.02 0.05 − 0.04 0.06 0.34 0.19 0.19 0.24 0.36 0.24 − 0.24 Teat length 0.16 0.15 0.02 0.07 − 0.04 0.12 − 0.02 0.15 − 0.01 0.01 0.06 − 0.07 − 0.04 − 0.18 0.30 Table 7. Estimated genetic (above diagonal) and phenotypic (below diagonal) correlations and heritabilities (on diagonal) among 15 linear type traits of Br own Swiss. Rear legs Fore Rear Front Dairy Foot (side Body Rump Rump udder Rear udder Udder Udder teat Teat Item Stature Strength form angle view) depth angle width attachment udder height width depth cleft placement length Stature 0.43 0.64 0.44 0.32 0.00 0.54 0.13 0.66 0.13 0.25 0.25 0.19 0.12 0.08 0.20 Strength 0.44 0.20 0.10 0.29 − 0.04 0.85 0.03 0.85 0.10 0.03 0.35 − 0.14 0.12 0.08 0.20 Dairy form 0.19 − 0.11 0.18 0.02 0.15 0.44 − 0.11 0.15 0.03 0.52 0.51 − 0.11 0.20 0.19 0.03 Foot angle 0.13 0.13 0.00 0.13 − 0.40 0.17 − 0.07 0.27 0.25 0.17 0.17 0.18 0.13 0.13 − 0.01 Rear legs (side view) − 0.02 − 0.07 0.10 − 0.19 0.18 0.03 0.00 0.00 − 0.13 − 0.08 − 0.04 − 0.10 − 0.06 − 0.04 0.02 Body depth 0.38 0.64 0.19 0.09 − 0.01 0.25 − 0.01 0.66 − 0.01 0.13 0.42 − 0.31 0.18 0.13 0.16 Rump angle 0.11 0.00 − 0.02 − 0.03 0.01 0.00 0.27 0.02 − 0.25 − 0.24 − 0.15 − 0.16 − 0.07 − 0.10 0.01 Rump width 0.39 0.51 − 0.01 0.11 − 0.02 0.43 0.02 0.18 0.14 0.13 0.40 − 0.03 0.17 0.09 0.15 Fore udder attachment 0.08 0.16 − 0.02 0.13 − 0.08 0.10 − 0.13 0.11 0.22 0.57 0.36 0.73 0.24 0.43 − 0.13 Rear udder height 0.11 0.01 0.32 0.10 − 0.05 0.08 − 0.10 0.07 0.31 0.22 0.67 0.36 0.35 0.29 0.01 Rear udder width 0.13 0.18 0.31 0.11 − 0.06 0.24 − 0.05 0.21 0.21 0.52 0.19 − 0.08 0.37 0.32 0.00 Udder depth 0.09 − 0.06 − 0.13 0.06 − 0.04 − 0.17 − 0.09 − 0.03 0.41 0.14 − 0.12 0.34 0.22 0.32 − 0.17 Udder cleft 0.05 0.05 0.09 0.05 − 0.01 0.08 − 0.04 0.06 0.16 0.19 0.19 0.19 0.22 0.45 − 0.05 Front teat placement 0.04 0.07 0.03 0.05 − 0.01 0.08 − 0.05 0.04 0.27 0.13 0.12 0.24 0.29 0.27 − 0.37 Teat length 0.12 0.09 0.04 0.01 0.00 0.10 0.01 0.08 − 0.06 0.02 0.05 − 0.12 0.01 − 0.19 0.34
Table 8. Estimated genetic (above diagonal) and phenotypic (below diagonal) correlations and heritabilities (on diagonal) among 15 linear type traits of Gu ernseys. Rear legs Fore Rear Rear Front Dairy Foot (side Body Rump Rump udder udder udder Udder Udder teat Teat Item Stature Strength form angle view) depth angle width attachment height width depth cleft placement length Stature 0.49 0.68 0.63 0.30 0.03 0.63 0.26 0.73 − 0.11 0.32 0.47 − 0.15 0.11 0.01 0.32 Strength 0.45 0.22 0.36 0.26 0.07 0.82 0.08 0.81 0.01 0.16 0.45 − 0.22 0.16 0.07 0.37 Dairy form 0.36 0.07 0.28 0.20 − 0.06 0.63 0.06 0.47 − 0.23 0.51 0.71 − 0.42 0.22 0.07 0.18 Foot angle 0.13 0.15 0.05 0.10 − 0.29 0.16 − 0.06 0.30 0.10 0.31 0.29 0.05 0.18 0.07 0.12 Rear legs (side view) − 0.03 − 0.08 0.03 − 0.18 0.16 0.06 − 0.08 0.07 − 0.06 − 0.27 − 0.22 − 0.03 − 0.23 − 0.06 − 0.04 Body depth 0.46 0.60 0.37 0.10 − 0.03 0.32 0.11 0.67 − 0.11 0.23 0.50 − 0.37 0.22 0.12 0.30 Rump angle 0.18 0.01 0.05 − 0.04 − 0.01 0.04 0.41 0.05 − 0.22 − 0.05 − 0.02 − 0.18 − 0.08 − 0.04 0.03 Rump width 0.48 0.53 0.19 0.13 − 0.02 0.45 0.03 0.29 0.00 0.32 0.54 − 0.20 0.18 0.06 0.39 Fore udder attachment − 0.03 0.11 − 0.11 0.09 − 0.08 0.01 − 0.15 0.05 0.29 0.40 0.06 0.80 0.19 0.51 − 0.14 Rear udder height 0.20 0.09 0.33 0.11 − 0.11 0.15 − 0.03 0.17 0.29 0.28 0.72 0.21 0.36 0.29 0.04 Rear udder width 0.28 0.26 0.43 0.14 − 0.12 0.30 0.00 0.33 0.13 0.53 0.28 − 0.25 0.40 0.20 0.17 Udder depth − 0.07 − 0.06 − 0.23 0.05 − 0.04 − 0.19 − 0.13 − 0.08 0.53 0.16 − 0.10 0.40 0.18 0.36 − 0.27 Udder cleft 0.05 0.07 0.14 0.06 − 0.05 0.11 − 0.05 0.08 0.17 0.24 0.28 0.18 0.21 0.37 − 0.01 Front teat placement 0.02 0.07 0.03 0.04 − 0.02 0.08 − 0.04 0.05 0.36 0.19 0.15 0.29 0.28 0.31 − 0.29 Teat length 0.20 0.16 0.11 0.03 − 0.01 0.16 0.02 0.18 − 0.05 0.04 0.12 − 0.15 0.04 − 0.12 0.34 Table 9. Estimated genetic (above diagonal) and phenotypic (below diagonal) correlations and heritabilities (on diagonal) among 14 linear type traits of Je rseys. Rear Fore Rear Rear Front Dairy Foot legs Rump Rump udder udder udder Udder Udder teat Teat Item Stature Strength form angle (side view) angle width attachment height width depth cleft placement length Stature 0.37 0.80 0.40 0.40 0.00 0.29 0.77 0.21 0.24 0.36 0.16 0.16 0.15 0.30 Strength 0.55 0.21 0.32 0.43 − 0.11 0.23 0.89 0.20 0.18 0.42 − 0.04 0.25 0.25 0.33 Dairy form 0.26 0.25 0.21 0.29 0.20 0.09 0.46 0.32 0.68 0.86 − 0.09 0.44 0.47 0.13 Foot angle 0.19 0.22 0.19 0.11 − 0.49 − 0.05 0.47 0.40 0.34 0.37 0.27 0.27 0.24 0.16 Rear legs (side view) − 0.02 − 0.05 0.07 − 0.22 0.07 0.07 0.01 − 0.08 0.05 0.10 − 0.12 0.16 0.15 − 0.13 Rump angle 0.17 0.13 0.09 0.00 0.03 0.22 0.18 − 0.09 − 0.01 0.03 − 0.09 0.01 0.01 0.08 Rump width 0.45 0.57 0.29 0.24 − 0.03 0.12 0.18 0.27 0.32 0.53 0.01 0.29 0.31 0.27 Fore udder attachment 0.12 0.16 0.23 0.23 − 0.03 − 0.05 0.18 0.19 0.77 0.62 0.76 0.45 0.61 0.07 Rear udder height 0.17 0.17 0.53 0.22 0.00 0.02 0.21 0.57 0.26 0.86 0.45 0.56 0.51 0.13 Rear udder width 0.24 0.31 0.63 0.23 0.01 0.05 0.34 0.42 0.72 0.22 0.14 0.59 0.62 0.15 Udder depth 0.05 − 0.06 − 0.05 0.13 − 0.04 − 0.06 − 0.02 0.48 0.33 0.10 0.27 0.29 0.33 − 0.04 Udder cleft 0.09 0.14 0.31 0.16 0.06 0.02 0.16 0.31 0.42 0.42 0.22 0.17 0.68 0.16 Front teat placement 0.10 0.16 0.29 0.15 0.04 0.01 0.18 0.39 0.39 0.39 0.25 0.45 0.20 − 0.01 Teat length 0.18 0.20 0.14 0.09 − 0.01 0.04 0.18 0.05 0.11 0.15 − 0.04 0.14 0.06 0.19
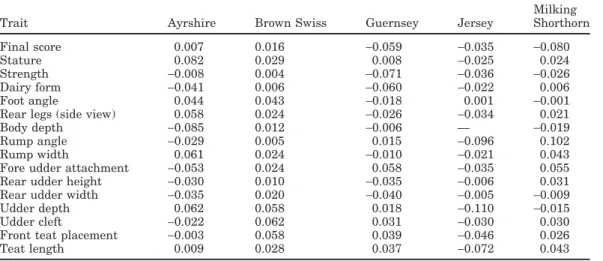
ear traits for each breed are given in Tables 6 through 10. The variance components can be derived from the total variance and the heritabilities and correlations. The highest heritability was 0.54 for stature in Ayrsh-ires, and the lowest was 0.07 for rear legs (side view) in Jerseys. Changes in heritability between this analy-sis and those of Gengler et al. (1997) are given in Table 11. The largest increase was 0.10 for rump angle in Milking Shorthorns. The largest decrease was 0.11 for udder depth in Jerseys. Most changes had an absolute value of 0.03 or less. The other Jersey samples gave results similar to the sample described in Table 2.
Correlations
The largest genetic correlation was 0.84 between rear udder width and rear udder height in Milking
Short-horns. The most negative correlation was −0.49
be-tween rear legs (side view) and foot angle in Jerseys. Phenotypic correlations generally followed similar pat-terns but with smaller magnitude.
Effect on Evaluations
Correlations between evaluations using the old and new (co)variances ranged from 0.924 to 0.999 for bulls and 0.819 to 0.997 for cows. Final score and stature had the highest correlations across breed. This was expected because final score was evaluated as a single trait, therefore changes in covariances had no effect. Because stature has a high heritability, other traits add relatively little information to evaluation of stature. Changes in covariances of stature with other traits, therefore, had little effect. Correlations with rear legs (side view) were among the lowest. This trait has a low heritability; therefore changes in correlations with other traits can have a large effect.
The changes in variances in Tables 12 and 13 reflect the changes in Table 11. For Ayrshires, heritabilities were generally reduced, and consequently the variances of evaluations also declined. For Brown Swiss, the re-verse occurred. Heritabilities increased as did vari-ances of evaluations. Changes were generally slightly larger for cows than for bulls.
DISCUSSION
Changes in data over time suggest variance compo-nent estimates should be updated periodically either with base changes or major changes in the evaluation system. The heterogeneous variance adjustment does not force the variance of evaluations to be stable over time. The variance of evaluations is affected by the
variance of the appraisals. A further step to stabilize Table
10. Estimated genetic (above diagonal) and phenotypic (below diagonal) correlations and heritabilities (on diagonal) among 15 linear type traits of Mi lking Shorthorns. Rear legs Fore Rear Rear Front Foot (side Body Rump Rump udder udder udder Udder Udder teat Teat Item Stature Strength Dairy form angle view) depth angle width attachment height width depth cleft placement length Stature 0.44 0.79 0.42 0.30 0.01 0.71 0.06 0.73 0.10 0.12 0.31 0.02 0.09 − 0.11 0.24 Strength 0.53 0.23 0.12 0.25 − 0.01 0.88 − 0.09 0.91 0.08 0.04 0.32 − 0.23 0.06 − 0.07 0.25 Dairy form 0.21 − 0.09 0.19 0.15 0.05 0.39 − 0.11 0.20 0.16 0.52 0.59 − 0.13 0.44 0.17 0.11 Foot angle 0.13 0.11 0.03 0.09 − 0.36 0.11 − 0.10 0.35 0.14 0.10 0.25 0.07 0.05 0.05 0.10 Rear legs (side view) − 0.01 − 0.03 0.05 − 0.25 0.11 0.03 − 0.09 0.04 0.06 − 0.02 − 0.08 0.01 0.15 0.05 0.06 Body depth 0.48 0.69 0.14 0.07 0.02 0.28 − 0.09 0.79 0.09 0.10 0.31 − 0.33 0.09 − 0.05 0.21 Rump angle 0.04 − 0.07 0.01 − 0.05 0.04 − 0.06 0.29 − 0.12 − 0.22 − 0.18 − 0.19 − 0.08 − 0.14 − 0.04 0.01 Rump width 0.44 0.54 0.00 0.11 − 0.02 0.49 − 0.06 0.20 0.06 0.06 0.42 − 0.17 0.15 − 0.03 0.20 Fore udder attachment 0.08 0.13 0.07 0.11 − 0.05 0.12 − 0.10 0.11 0.16 0.62 0.38 0.69 0.25 0.67 − 0.21 Rear udder height 0.10 0.04 0.30 0.10 − 0.08 0.09 − 0.06 0.09 0.39 0.16 0.84 0.31 0.65 0.32 0.03 Rear udder width 0.14 0.13 0.33 0.09 − 0.08 0.15 − 0.01 0.17 0.29 0.59 0.11 − 0.04 0.63 0.29 0.11 Udder depth 0.04 − 0.04 − 0.10 0.06 − 0.04 − 0.10 − 0.09 − 0.04 0.34 0.11 − 0.12 0.26 − 0.03 0.26 − 0.30 Udder cleft 0.04 0.02 0.16 0.05 0.00 0.05 − 0.03 0.05 0.17 0.22 0.24 0.09 0.08 0.24 − 0.01 Front teat placement 0.00 0.01 0.04 0.05 − 0.01 0.02 − 0.03 0.02 0.28 0.11 0.07 0.27 0.17 0.20 − 0.43 Teat length 0.11 0.08 0.08 0.01 0.00 0.08 0.01 0.07 − 0.07 0.05 0.10 − 0.20 0.05 − 0.22 0.28
Table 11. Changes (new− old) in heritability estimates for type traits by breed.
Milking Trait Ayrshire Brown Swiss Guernsey Jersey Shorthorn
Final score 0.007 0.016 −0.059 −0.035 −0.080
Stature 0.082 0.029 0.008 −0.025 0.024
Strength −0.008 0.004 −0.071 −0.036 −0.026
Dairy form −0.041 0.006 −0.060 −0.022 0.006
Foot angle 0.044 0.043 −0.018 0.001 −0.001
Rear legs (side view) 0.058 0.024 −0.026 −0.034 0.021
Body depth −0.085 0.012 −0.006 — −0.019
Rump angle −0.029 0.005 0.015 −0.096 0.102
Rump width 0.061 0.024 −0.010 −0.021 0.043
Fore udder attachment −0.053 0.024 0.058 −0.035 0.055 Rear udder height −0.030 0.010 −0.035 −0.006 0.031 Rear udder width −0.035 0.020 −0.040 −0.005 −0.009
Udder depth 0.062 0.058 0.018 −0.110 −0.015
Udder cleft −0.022 0.062 0.031 −0.030 0.030
Front teat placement −0.003 0.058 0.039 −0.046 0.026
Teat length 0.009 0.028 0.037 −0.072 0.043
Table 12. Changes (new− old) in variances of type trait evaluations for cows born in 1995 or later by breed.
Milking Trait Ayrshire Brown Swiss Guernsey Jersey Shorthorn
Final score −0.05 0.01 −0.16 −0.09 −0.05
Stature −0.55 0.14 −0.09 −0.23 0.06
Strength −0.30 0.01 −0.29 −0.12 −0.14
Dairy form −0.42 0.01 −0.29 −0.30 −0.13
Foot angle −0.11 0.06 −0.04 −0.06 −0.01
Rear legs (side view) 0.01 0.02 −0.14 −0.10 0.01
Body depth −0.63 0.01 −0.16 — −0.16
Rump angle −0.61 0.05 −0.01 −0.35 0.15
Rump width −0.34 0.03 −0.08 −0.08 0.05
Fore udder attachment −0.62 0.11 0.04 −0.43 0.06 Rear udder height −0.79 0.05 −0.20 −0.33 0.02 Rear udder width −0.49 0.04 −0.10 −0.18 −0.11
Udder depth −0.48 0.12 0.03 −0.76 −0.19
Udder cleft −0.52 0.13 0.02 −0.15 0.04
Front teat placement −0.71 0.10 −0.06 −0.32 −0.19
Teat length −0.73 0.11 −0.05 −0.25 −0.19
Table 13. Changes (new− old) in variances of type trait evaluations for AI bulls born in 1975 or later and
with a final score reliability of 75% or more by breed.
Milking Trait Ayrshire Brown Swiss Guernsey Jersey Shorthorn
Final score −0.11 0.02 −0.21 −0.12 −0.06
Stature −1.08 0.09 −0.35 −0.25 0.09
Strength −0.55 0.00 −0.39 −0.13 −0.21
Dairy form −0.44 0.01 −0.42 −0.68 −0.28
Foot angle −0.19 0.05 −0.04 −0.11 0.00
Rear legs (side view) −0.04 0.03 −0.20 −0.18 0.00
Body depth −0.87 0.00 −0.30 — −0.12
Rump angle −0.89 0.04 −0.10 −0.33 −0.03
Rump width −0.63 0.03 −0.14 −0.12 0.10
Fore udder attachment −1.26 0.07 −0.11 −0.44 0.04 Rear udder height −1.22 0.06 −0.29 −0.50 0.05 Rear udder width −0.72 0.04 −0.25 −0.32 −0.13
Udder depth −0.80 0.06 −0.10 −0.59 −0.36
Udder cleft −0.59 0.07 −0.07 −0.17 0.06
Front teat placement −0.95 0.07 −0.19 −0.40 −0.49
variance of evaluations by specifying a base period for variance has been developed. This change is expected to add to the stability of evaluations and reduce the effects of changes in the variability of the scores assigned. The new variance components should improve the corre-spondence between the evaluations and the current characteristics of the appraisal data. Heritabilities were generally similar to those estimated from earlier data but with relatively large changes for a few traits. The heritabilities and genetic variances presented are posted on the Interbull website (http://www-interbull.
slu.se/national_ges_info2/framesida-ges.htm), along
with those from other countries for comparison.
ACKNOWLEDGMENTS
The authors thank I. Misztal, University of Georgia (Athens), for providing the computer program to esti-mate variance components and L. L. M. Thornton, Ani-mal Improvement Programs Laboratory (Beltsville, MD), for assistance in manuscript review. N. Gengler, who is a research associate of the National Fund for Scientific Research (Brussels, Belgium), acknowledges
the Fund’s financial support. The authors also acknowl-edge partial support by the American Jersey Cattle Association (Reynoldsburg, Ohio).
REFERENCES
Ducrocq, V., and B. Besbes. 1993. Solution of multiple trait animal models with missing data on some traits. J. Anim. Breed. Genet. 110:81–92.
Gengler, N., T. Dusseldorf, G. R. Wiggans, J. R. Wright, and T. Druet. 2001a. Heterogeneity of (co)variance components for Jersey type traits. J. Dairy Sci. 84:1772. Online. Available: http://www. adsa.org/jds/papers/0385/JDS0385.html.
Gengler, N., T. Dusseldorf, G. R. Wiggans, J. R. Wright, and T. Druet. 2001b. Joint estimation of variances and effects in the US Jersey type evaluation system. Interbull Bull. 26:34–40. Available: http://www-interbull.slu.se/bulletins/bulletin26/Gengler.pdf. Gengler, N., G. R. Wiggans, and J. R. Wright. 1999. Animal model
genetic evaluation of type traits for five dairy cattle breeds. J. Dairy Sci. 82:1350. Online. Available: http://www.adsa.org/ manuscripts/jds8311.
Gengler, N., G. R. Wiggans, J. R. Wright, and T. Druet. 2001c. Simul-taneous accounting for heterogeneity of (co)variance components in genetic evaluation of type traits. J. Dairy Sci. 84 (Suppl. 1):247. Online. Available: http://www.adsa.org/jointabs/iaafs110.pdf. Gengler, N., G. R. Wiggans, J. R. Wright, H. D. Norman, and C. W.
Wolfe. 1997. Estimation of (co)variance components for Jersey type traits using a repeatability model. J. Dairy Sci. 80:1801– 1806.