r j W UNIVERSITEDE
B l SHERBROOKE
Faculte de genie
Departement de genie mecanique
APPROCHES DE MODELISATION HYBRIDES POUR LA PREDICTION DU BRUIT SOLIDIEN DANS LES STRUCTURES AERONAUTIQUES
Memoire de maitrise es sciences appliquees Specialite : genie mecanique
Etienne POULIN
1*1
Library and
Archives Canada
Published Heritage
Branch
395 Wellington Street Ottawa ON K1A0N4 CanadaBibliotheque et
Archives Canada
Direction du
Patrimoine de I'edition
395, rue Wellington Ottawa ON K1A0N4 CanadaYour file Votre reference ISBN: 978-0-494-43007-1 Our file Notre reference ISBN: 978-0-494-43007-1
NOTICE:
The author has granted a
non-exclusive license allowing Library
and Archives Canada to reproduce,
publish, archive, preserve, conserve,
communicate to the public by
telecommunication or on the Internet,
loan, distribute and sell theses
worldwide, for commercial or
non-commercial purposes, in microform,
paper, electronic and/or any other
formats.
AVIS:
L'auteur a accorde une licence non exclusive
permettant a la Bibliotheque et Archives
Canada de reproduire, publier, archiver,
sauvegarder, conserver, transmettre au public
par telecommunication ou par Plntemet, prefer,
distribuer et vendre des theses partout dans
le monde, a des fins commerciales ou autres,
sur support microforme, papier, electronique
et/ou autres formats.
The author retains copyright
ownership and moral rights in
this thesis. Neither the thesis
nor substantial extracts from it
may be printed or otherwise
reproduced without the author's
permission.
L'auteur conserve la propriete du droit d'auteur
et des droits moraux qui protege cette these.
Ni la these ni des extraits substantiels de
celle-ci ne doivent etre imprimes ou autrement
reproduits sans son autorisation.
In compliance with the Canadian
Privacy Act some supporting
forms may have been removed
from this thesis.
Conformement a la loi canadienne
sur la protection de la vie privee,
quelques formulaires secondaires
ont ete enleves de cette these.
While these forms may be included
in the document page count,
their removal does not represent
Bien que ces formulaires
aient inclus dans la pagination,
il n'y aura aucun contenu manquant.
N o t e to the Reader
This document is written as the Master's Thesis for the candidate.
This work was defined in a Natural Sciences and Engineering Research Council of Canada (NSERC) Industrial Research Chair (IRC) program held by Professors Berry and Atalla. Conducted in collaboration with Bell Helicopter-Textron Canada (BHTC), this project focuses on structure-borne noise.
English is the chosen language in the redaction of official documents for this project in order to avoid unnecessary translation.
Summary
The main objective of this research project was to study the feasibility and effectiveness of different modelling strategies available for the prediction of the propagation of structure-borne noise. A literature review of the helicopter cabin noise problematic is conducted in Chapter 1 in order to show the relevance of modelling correctly structure borne noise.
The outcome of this project is a modelling methodology that is computationally effective and leads to satisfactory results in the prediction of structure-borne noise.
Two modeling strategies are reviewed in Chapter 2, the deterministic and stochastic approaches, precisely the Finite Elements Method (FEM) and Statistical Energy Analysis (SEA). A hybrid theory that allies both FEM and SEA is introduced as a potential solution to overcome the
mid-frequency problem that occurs at the intersection of the domains of validity of FEM and SEA. The
hybrid methodology is also used to alleviate the conceptual limitations of SEA (structure-borne excitation, complex junctions . . . ) .
The theoretical background required to compare the deterministic, stochastic and hybrid approaches is introduced in Chapter 3, with emphasis on the hybrid approaches which constitute the originality of the present work.
The experimental case study of an in-vacuo structural problem and a coupled fluid-structure problem is presented in Chapter 4. This case study serves as a baseline for the comparison of the different methods in Chapter 5. In this chapter, models developed using the different strategies available are presented and discussed in terms of computational cost as well as capability to lead to adequate results.
Chapter 6 summarizes the main remarks regarding each technique and discussed the validity and relevance of the recently developed hybrid FEM-SEA and SEA-CMT techniques with a specific attention to the case of modeling structure-borne noise in helicopter cabins.
Resume
L'objectif premier de ce projet de recherche etait d'etudier la faisabilite et l'efficacite de differentes approches de modelisation disponibles pour la prediction du bruit solidien. Une revue de litterature en ce qui a trait au bruit dans les cabines d'helicopteres est conduite au Chapitre 1, ce qui permet de demontrer l'importance de pouvoir predire la propagation du bruit solidien. L'apport principal the ce projet est une methodologie de modelisation qui est a la fois efficace en terme de temps de calcul et apte a predire de facon satisfaisante la propagation du bruit solidien. Au niveau des strategies de modelisation, deux grandes ecoles de pensee sont presentees au Chapitre 2, soit les approches deterministes telles que la Mefhode des Elements Finis et les approches statistiques telles que l'Analyse Statistique Energetique. Une approche hybride qui allie les deux ecoles de pensee est ensuite presentee comme une solution potentielle au probleme qui apparait a l'intersection des domaines de validite des approches deterministes et statistiques. Le bagage theorique permettant de comparer les approches deterministes, statistiques et hybrides est detaille au Chapitre 3. Une attention particuliere est portee aux approches hybrides qui constituent l'originalite du present projet de maitrise.
Une etude experimental est conduite au Chapitre 4 pour un probleme de vibration structurale sans et avec rayonnement acoustique dans une cavite. Cette etude de cas servira de base de comparaison pour les differentes approches de modelisation qui sont explorees au chapitre suivant.
Le Chapitre 5 est un chapitre d'application numerique ou les differentes approches de modelisations sont appliquees pour realiser un modele du cas experimental etudie au Chapitre 4. Les modeles developpes grace aux differentes strategies sont presentes et compares a la fois en terme de temps de calcul requis ainsi que par leur capacite a representer adequatement le cas experimental.
Le Chapitre 6 se veut un sommaire des remarques ressorties concernant chaque strategie et discute de la validite et de la pertinence des approches hybrides developpees avec une attention particuliere portee au probleme de la propagation du bruit solidien dans les structures aeronautiques telles qu'une cabine d'helicoptere.
Remerciements
Je tiens d'abord a remercier mon directeur, M. Noureddine Atalla, pour avoir cru en moi et pour
l'ensemble de sa contribution a superviser mes travaux de maitrise. Ses conseils judicieux, son haut niveau de connaissances et son gout du travail bien fait, tous sans egaux, m'ont permis de mener a terme ce projet. Je me considere privilegie d'avoir eu la chance d'acquerir des competences en simulations numeriques aupres d'une personne qui est une reference dans le domaine.
Mes remerciements s'adressent egalement au personnel du GAUS sans qui le projet ne serait certainement pas aussi avance. Notamment, je ne pourrais passer sous silence la contribution de Remy Oddo et Maxime Bolduc qui ont bien voulu partager avec moi leurs experiences et
connaissances qui m'ont ete d'une aide incroyable lors de la portion experimental du projet. Je
tiens egalement a remercier Celse Kami Amedin pour la qualite de son support lors de la phase d'implementation numerique de ce projet.
A ma famille, particulierement mon grand-pere Denis, mes parents, ma sceur Anne-Marie ainsi que ma compagne Maggy, je veux vous remercier pour votre encouragement a croire en moi et en mes reves, tant dans les moments de prosperite que dans les moments plus penibles ou la motivation venait a me manquer. Sans votre soutien, mener a terme ce projet aurait ete un defi tout a fait different, cet accomplissement n'est done pas uniquement le mien, mais egalement le votre, vous etes precieux pour moi et je vous en serai toujours reconnaissant.
A tous mes amis, un merci sincere pour la qualite de votre amitie et votre presence dans ma vie. Merci egalement d'avoir ete comprehensifs et d'avoir continue a etre la, malgre mes obligations scolaires qui me forcaient parfois a vous fausser compagnie. Je profite done de ce moment pour vous signifier 1'importance que vous ave2 a mes yeux.
Table of Contents
/ Introduction 1 1.1 Technological problematic 2
1.2 The relevance for modeling the main gearbox structure-borne noise 3
1.3 Scientific problematic 6
1.4 Objectives 8 2 Numerical approaches : a review 9
2.1 Deterministic approaches 9
2.1.1 Finite Elements Method (FEM) and its limitations 9
2.2 Stochastic approaches 10
2.2.1 Classical Statistical Energy Analysis (SEA) and its limitations 10
2.3 Hybrid FEM-SEA approaches 15
2.3.1 Classical Statistical Energy Analysis enhanced by virtual experimental data 15
2.3.2 Hybrid coupled FEM-SEA 16 2.3.3 Modeling the power excitation from the main gearbox: SEA enhanced by the
Component Mobility modeling Technique 18
3 Theoretical background 20 3.1 Experimental SEA 20
3.1.1 Determination of the loss and coupling factors by SEA matrix inversion 20
3.1.2 Determination of the D L F by decay and CLF by power balance 22
3.2 Virtual experimental SEA 25
3.2.1 Determination of the coupling loss factor 25
3.2.2 Calculation of the input power 27
3.3 Hybrid approach for structure borne sound 28
3.3.2 The concept of plate direct field dynamic stiffness 28 3.3.3 The set of generalized coordinates for the deterministic subsystem 30
3.3.4 Governing equations of the hybrid approach and the numerical implementation ....31
3.3.5 The equations of motion of the model and dynamic stiffness matrices 31
3.3.6 The energy balance in SEA subsystems 32 3.3.7 The response of the deterministic subsystems 34 3.3.8 A summary of the steps of the hybrid approach 35
3.4 A wave approach for plate dynamic stiffness 36
3.4.1 Justifications for the wave approach for plate dynamic stiffness 36
3.4.2 The approach for plate dynamic stiffness 36 3.4.3 The equations of the wave approach for plate dynamic stiffness 38
3.5 Classical Statistical Energy Analysis enhanced by component mobility techniques ....42
3.5.1 The relevance of a component mobility technique 42 3.5.2 A hybrid FEM-SEA method based on component mobility techniques 43
3.5.3 The equations for hybrid FEM-SEA method based on component mobility
techniques 43
4 Case study: Experimental measurement of the response of the structure to a point
force excitation 46 4.1 Purpose of the measurement 46
4.2 Description of the test bench 46
4.2.1 Description of the cavity 47 4.2.2 Attachment of the structure to the cavity 47
4.4.2 Mean quadratic velocities 51 4.4.3 Mean quadratic pressure 55
5 Case study: numerical application 57
5.1 Application to a structural problem 57 5.1.1 Full FEM solution of problem 58
5.1.2 Experimental SEA 64 5.1.3 SEA model enhanced with the CMT 68
5.1.4 Hybrid FE-SEA junctions approach 72
5.1.5 Comparison of the methods 77 5.2 Application to a coupled fluid-structure problem 81
5.2.1 Full FEM solution of problem 82
5.2.2 Experimental SEA 87 5.2.3 SEA model enhanced with the CMT 93
5.2.4 Hybrid FE-SEA junctions approach 96 5.2.5 Comparison of the methods 100
6 Perspectives regarding application to the structure-borne noise in helicopter cabins 104
7 Conclusion 107
7.1 Review of the thesis 107 7.2 Prospective work 108 7.3 Additional opportunities 108
Appendix A Design of the simplified structure for the development of the method. 114
A.l Overview of the experimental structure 114
A.2 Review of the components 114
A.2.1 Lower plate 115 A.2.2 Upper plate 118 A.2.3 Rods 119 A.2.4 Pan head cap screw 119
Appendix B Validation of the Nastran to NovaFEM conversion and NovaFEM models 120
B.l Simply supported plate with point load 120 B.2 Simply supported plate with point load and point stiffness 122
B.3 Simply supported plate coupled by four springs to a plate with point load 123
B.4 Simply supported plate coupled to a cavity 126
Appendix C Measurement of the cavity acoustic absorption 130
C.l Purpose of the measurement 130
C.2 Methodology 130 C.3 Data analysis 132
Appendix D Experimental validation for the modeling of the upper plate on rods. 137
D.l Purpose of the measurement 137 D.2 Description of the test bench 137
D.3 Methodology 138 D.3.1 Hardware and software requirement 138
Appendix E Experimental validation for the clamped boundary conditions of the lower
plate attached to the cavity 142
E.l Purpose of the measurement 142 E.2 Description of the test bench 142
E.2.1 Attachment of the plate to the cavity 143
E.3 Methodology 144 E.3.1 Hardware and software requirement 145
E.3.2 Inputs and outputs to the system 145
E.4 Data analysis 146 E.5 Numerical simulation 146
Appendix F Measurement of the loss factors of the structure for experimental SEA.... 148
F.l Purpose of the measurement 148 F.2 Description of the test bench 148 F.2.1 Description of the cavity 148 F.2.2 Attachment of the structure to the cavity 148
F.3 Methodology 148 F.3.1 Hardware and software requirement 150
F.3.2 Inputs and outputs to the system 150
F.4 Data analysis 151 Appendix G Hybrid FEM-SEA applied to double wall transmission problems 155
G.l Experimental setup 155 G.2 Modeling strategy 156
G.2.1 SEA subsystems 156 G.2.2 SEA Connections 157 G.3 Comparison of the hybrid FEM-SEA with experimental results 160
Table of figures
Figure 1.1: Noise source ranking for the Sikorsky S-76. Figure from [YORKIE et ah, 1983] 3
Figure 1.2 : Sikorsky bare cabin SPL. Figure from [YORKIE etal, 1983] 4 Figure 1.3 : Comparison of flight test and predicted SPL results inside the Bell 222 (left) and
ACAP (right) helicopters (average cabin noise levels). Figure from [MATHUR & et ah, 1988 a,b].5
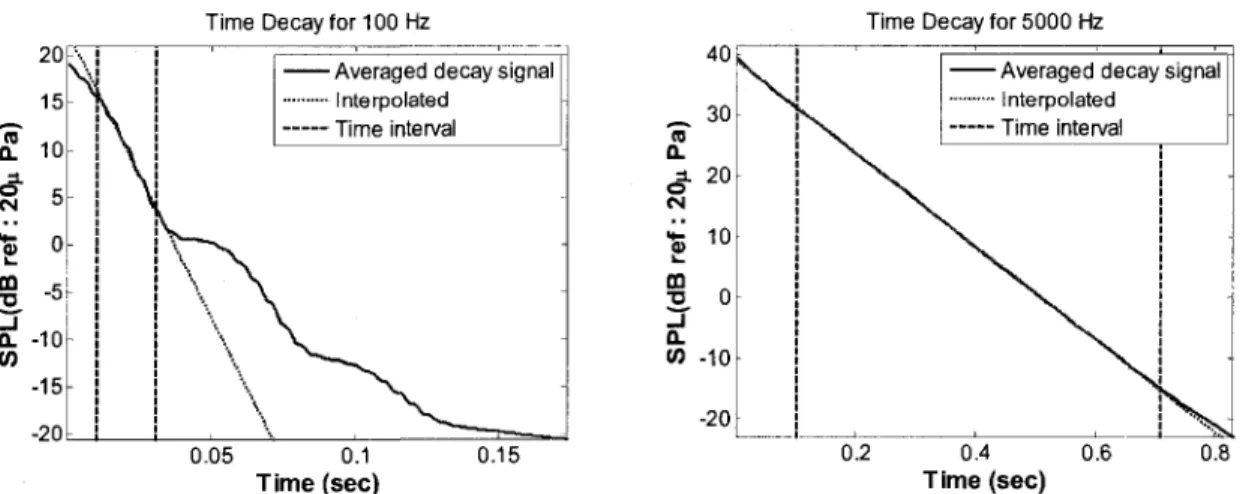
Figure 3.1: Typical time traces of decay 23 Figure 3.2: Typical mean Schroeder decay function at 100 Hz and 5000 Hz with recursive T O B
filtering 24 Figure 3.3: Flux diagram representing the steps of hybrid FEM-SEA modeling 35
Figure 3.4 : Rigid massless disc of radius a embedded in plate 36 Figure 3.5 : Comparison between point impedance found using the approach of [LANGLEY &
al. 2003] and [Cremer 1988]for a 10 mm radius disc in a 1 mm thick steel plate. Solid line: result
from the wave approach; dashed line: standard expression (3.44) of [Cremer 1988] 38
Figure 3.6: Schematical representation of the CMT coupled problem 43 Figure 4.1 : Geometry of the simplified roof-main gearbox struts- main gearbox representative
structure. 1 - Roof representative aluminum plate, 2- Upper aluminum plate and 3- rods attached
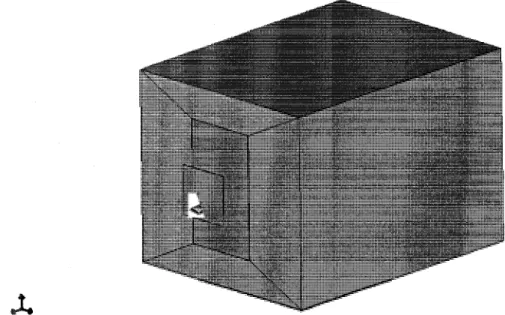
with 4- machine screws 47 Figure 4.2 : Geometry of the simplified roof-main gearbox struts- main gearbox representative
structure clamped to the acoustic cavity 47 Figure 4.3: Structure mounted to the cavity 48 Figure 4.4: Structure mounted to the cavity and vibration measurement on the plates 48
Figure 4.5: Structure response measurement diagram 49 Figure 4.6 : Third octave band of the average power input to the upper plate normalized to the
force. Case of the in-vacuo response 50 Figure 4.7 : Third octave band of the average power input to the upper plate normalized to the
Figure 4.8: Average mean quadratic velocity for the upper plate normalized to the force. Case of
the in vacuo response 52 Figure 4.9: Average mean quadratic velocity for the lower plate plate normalized to the force.
Case of the in-vacuo response 52 Figure 4.10 : Third octave band average mean quadratic velocity for the upper plate normalized to
the force. Case of the in vacuo response 52 Figure 4.11 : Third octave band average mean quadratic velocity for the lower plate plate
normalized to the force. Case of the in-vacuo response 53 Figure 4.12: Average mean quadratic velocity for the upper plate normalized to the force. Case of
the lower plate coupled to the cavity 53 Figure 4.13: Average mean quadratic velocity for the lower plate plate normalized to the force.
Case of the lower plate coupled to the cavity 53 Figure 4.14 : Third octave band average mean quadratic velocity for the upper plate normalized to
the force. Case of the lower plate coupled to the cavity 54 Figure 4.15 : Third octave band average mean quadratic velocity for the lower plate plate
normalized to the force. Case of the lower plate coupled to the cavity 54 Figure 4.16: Average mean quadratic pressure in the cavity normalized to the force 56
Figure 4.17 : Third octave band average mean quadratic pressure in the cavity normalized to the
force 56 Figure 5.1 : Structural F E M model 59
Figure 5.2: Mode (9,2) of the lower plate at 4942 Hz extracted from the refined FEM model 60 Figure 5.3: Mode (2,15) of the lower plate at 4875 Hz extracted from the refined FEM model. ..60
Figure 5.4: Mode of the upper plate at 4950 Hz extracted from the refined FEM model 60 Figure 5.5 : Comparison between FEM and experimental results for the mean quadratic velocity
of the upper plate. Average response from the three excitation cases 62 Figure 5.6 : Comparison between FEM and experimental results for the mean quadratic velocity
Figure 5.7 : Comparison between FEM and experimental results for the third octave band averaged mean quadratic velocity of the upper plate. Average response from the three excitation
cases 63 Figure 5.8 : Comparison between F E M and experimental results for the third octave band
averaged mean quadratic velocity of the lower plate. Average response from the three excitation
cases 63 Figure 5.9: Structural VA One model with user defined junction 64
Figure 5.10: User defined junction in VA One 64 Figure 5.11: Power spectrum applied to the upper plate 65
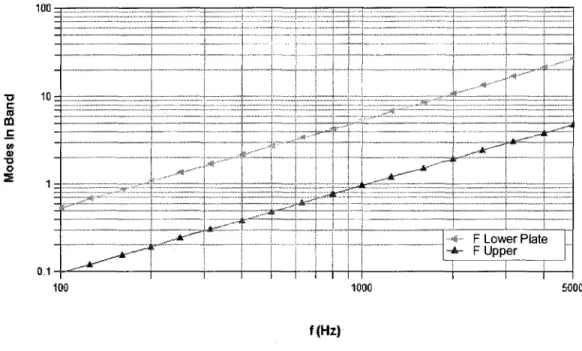
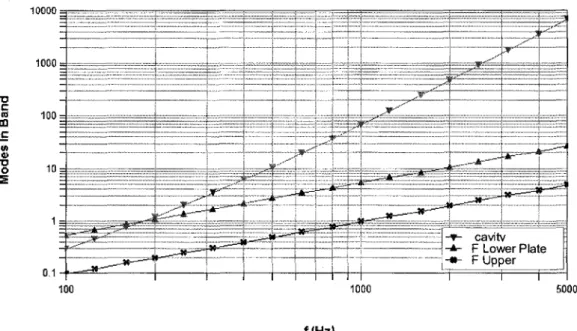
Figure 5.12: Number of modes in band for upper and lower plate 67 Figure 5.13 : Comparison between SEA and experimental results for the third octave band
averaged mean quadratic velocity of the upper plate. Average response from the three excitation
cases 67 Figure 5.14: Comparison between SEA and experimental results for the third octave band
averaged mean quadratic velocity of the lower plate. Average response from the three excitation
cases 68 Figure 5.15 : Comparison between SEA enhanced by CMT and experimental results for the third
octave band averaged mean quadratic velocity of the lower plate. Average response from the
three excitation cases 71 Figure 5.16 : Mean quadratic velocity of the statistical plate per unit input force in the
deterministic plate. Gray lines, computed using a Monte Carlo approach for 250 realisations of ensemble; white line, ensemble average of F E results; black line, ensemble average computed
using the hybrid approach 75 Figure 5.17 : Comparison between hybrid FEM-SEA and experimental results for the third octave
band averaged mean quadratic velocity of the lower plate. Average response from the three
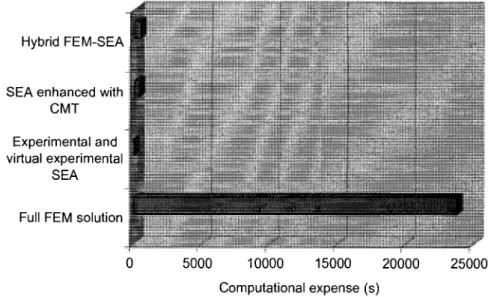
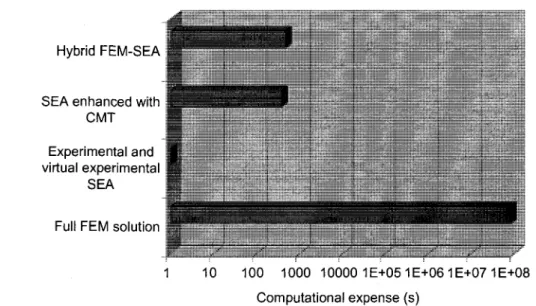
Figure 5.19 : Computational expense associated to each approach for the structural problem 78 Figure 5.20 : Comparison between the bending wavelength and the connection spacing in the lower plate. Notice that the bending wavelength becomes shorter than the connection spacing at
frequencies greater than 620 Hz 79 Figure 5.21 : Coupled fluid-structure FEM model. Notice the cavity mesh is refined adjacent to
the plate to allow compatible mesh for NovaFEM calculations 82 Figure 5.22 : Comparison between FEM and experimental results for the mean quadratic velocity
of the upper plate in the coupled fluid-structure application. Average response from the three
excitation cases 85 Figure 5.23 : Comparison between FEM and experimental results for the mean quadratic velocity
of the lower plate in the coupled fluid-structure application. Average response from the three
excitation cases 85 Figure 5.24 : Comparison between FEM and experimental results for the third octave band
averaged mean quadratic velocity of the upper plate in the coupled fluid-structure application.
Average response from the three excitation cases 85 Figure 5.25 : Comparison between FEM and experimental results for the third octave band
averaged mean quadratic velocity of the lower plate in the coupled fluid-structure application.
Average response from the three excitation cases 85 Figure 5.26 : Comparison between FEM and experimental results for mean quadratic pressure in
the cavity. Average response from the three excitation cases 86 Figure 5.27 : Comparison between FEM and experimental results for the third octave band
averaged mean quadratic pressure in the cavity. Average response from the three excitation cases. 86 Figure 5.28: Coupled fluid-structural VA O n e model with user defined junction between both
plates 87 Figure 5.29 : Acoustic area junction between the lower plate and cavity 88
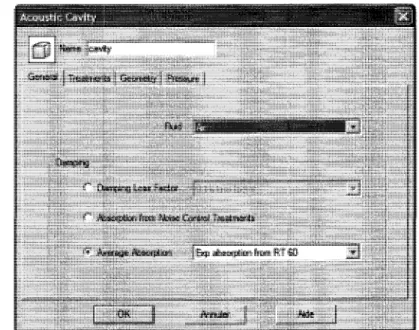
Figure 5.30 : Application of the average internal absorption to the cavity 88 Figure 5.31: Number of modes in band for the SEA subsystems of the fluid-structural model....91
Figure 5.32 : Comparison between SEA and experimental results for the third octave band averaged mean quadratic velocity of the upper plate. Average response from the three excitation
cases of the fluid-structural problem , 91 Figure 5.33 : Comparison between SEA and experimental results for the third octave band
averaged mean quadratic velocity of the lower plate. Average response from the three excitation
cases of the fluid-structural problem 92 Figure 5.34 : Comparison between SEA and experimental results for the third octave band
averaged mean quadratic pressure inside the cavity. Average response from the three excitation
cases cases of the fluid-structural problem 92 Figure 5.35 : Comparison between SEA enhanced by CMT and experimental results for the third
octave band averaged mean quadratic velocity of the lower plate. Average response from the
three excitation cases of the fluid-structural problem 95 Figure 5.36 : Comparison between SEA enhanced by CMT and experimental results for the third
octave band averaged mean quadratic pressure inside the cavity. Average response from the three
excitation cases of the fluid-structural problem 95 Figure 5.37 : Comparison between hybrid FEM-SEA and experimental results for the third octave
band averaged mean quadratic velocity of the lower plate. Average response from the three
excitation cases of the fluid-structural problem 99 Figure 5.38 : Comparison between hybrid FEM-SEA and experimental results for the third octave
band averaged mean quadratic pressure inside the cavity. Average response from the three
excitation cases of the fluid-structural problem 99 Figure 5.39 : Comparison of the mean quadratic velocity of the lower plate computed from each
studied techniques with the experimental results in third octave bands. Average response from
the three excitation cases of the fluid-structural problem 100 Figure 5.40 : Comparison of the mean quadratic pressure inside the cavity computed from each
studied techniques with the experimental results in third octave bands. Average response from
Figure A.l : Geometry of the simplified roof-main gearbox struts- main gearbox representative structure. 1 - Roof representative aluminium plate, 2- Upper aluminium plate and 3- rods attached
with 4- machine screws 114 Figure A.2: Roof representative aluminium plate 115
Figure A.3: Modal overlap vs frequency for the lower plate 117
Figure A.4: Upper plate 118 Figure A.5: Modal overlap vs frequency for the upper plate 119
Figure A.6: Support rods 119 Figure B.l : Simply supported plate with 10 N point force 120
Figure B.2 : Mean quadratic velocity on simply supported plate with I O N point force. Frequency
linear step of 2 Hz 121 Figure B.3 : Simply supported plate with 10 N point force and 1x10 N / m point stiffness 122
Figure B.4 : Mean quadratic velocity on simply supported plate with I O N point force and lxlO7
N / m point stiffness. Frequency linear step of 2 Hz 123 Figure B.5 : Simply supported plate coupled with another plate by four springs with I O N point
force and 26786 N / m springs stiffness 124 Figure B.6 : Mean quadratic velocity on the upper plate with 10 N point force and 26786 N / m
springs. Frequency linear step of 2 Hz 125 Figure B.7 : Mean quadratic velocity on the lower plate with I O N point force on the upper plate
and 26786 N / m springs. Frequency linear step of 2 Hz 126 Figure B.8 : Simply supported plate with 10 N point force 126 Figure B.9 : Mean quadratic velocity on simply supported plate with I O N point force. Frequency
linear step of 10 Hz 129 Figure B.10 : Mean quadratic pressure in the cavity coupled to the simply supported plate.
Frequency linear step of 10 Hz 129 Figure C.l: Microphones distribution inside the cavity 131
Figure C.3: Microphone time traces of decay for reverberation time determination 133 Figure C.4: Mean Schroeder decay function at 100 Hz and 5000 Hz with recursive T O B filtering
134
Figure C.5: RT60 and absorption spectra for the cavity with recursive T O B filtering 134
Figure C.6: Mean Schroeder decay function at 100 Hz and 5000 Hz with reversed filtering 135
Figure C.7: RT60 and absorption spectra for the cavity with reversed T O B filtering 136
Figure C.8: Comparison of absorption spectra for the cavity with recursive and reversed T O B
filtering 136 Figure D.l : Upper plate on rods attached to a rigid mass for measurement of input mobility.. 137
Figure D.2: Clamped boundary conditions measurement diagram 139 Figure D.3 : Comparison of the measured input mobility for the upper plate vs numerical results
for the case of the rods modeled as bar elements 141 Figure D.4 : Comparison of the measured input mobility for the upper plate vs numerical results
for the case of the rods modeled as beam elements 141 Figure E.l : Test box with test plate during modal testing (the cavity is open and treated with
absorbent materials) 143 Figure E.2 : Absorbent material inside of the cavity and opened access opening to avoid fluid
structure interaction 143 Figure E.3: Principle of the clamping frame 144
Figure E.4: Plate attached to the cavity 144 Figure E.5: Clamped boundary conditions measurement diagram 145
Figure E.6 : Comparison of the measured input mobility for the clamped lower plate vs numerical
results 147 Figure F.l: Structure mounted to the cavity and vibration measurement on the plates 149
Figure F.4: Mean Schroeder decay function at 100 Hz and 5000 Hz with recursive T O B filtering 152 Figure F.5 : Damping loss factor for the upper plate. Comparison between values obtained from SEA matrix inversion and decay versus experimental modal damping adjusted by FEM
simulations. Notice that negative D L F values have no physical signification 153 Figure F.6 : Damping loss factor for the lower plate. Comparison between values obtained from
SEA matrix inversion and decay versus experimental modal damping adjusted by FEM simulations. Notice that higher D L F values for the SEA inversion method occur at coincident
frequencies with negative D L F values for the upper plate 154 Figure F.7 : Coupling loss factors obtained from both SEA matrix inversion method and decay
followed by power balance compared to the coupling loss factor obtained from FEM simulations. Coupling loss factor r\n is related to the energy flow from the upper plate to the lower plate.... 154 Figure G.l : Experimental setup for the double wall layer. Left: Aluminium plate with 4 studs; center: light glass wool noise control treatment; right: second aluminium plate added to close the
double wall 155 Figure G.2 : SEA model of a double wall structure including structural connections 156
Figure G.3 : Hybrid-SEA vs experimental results for the double wall transmission problem.
Table of tables
Table 3.1 : Point connection properties for the validation case of the plate dynamic stiffness 37
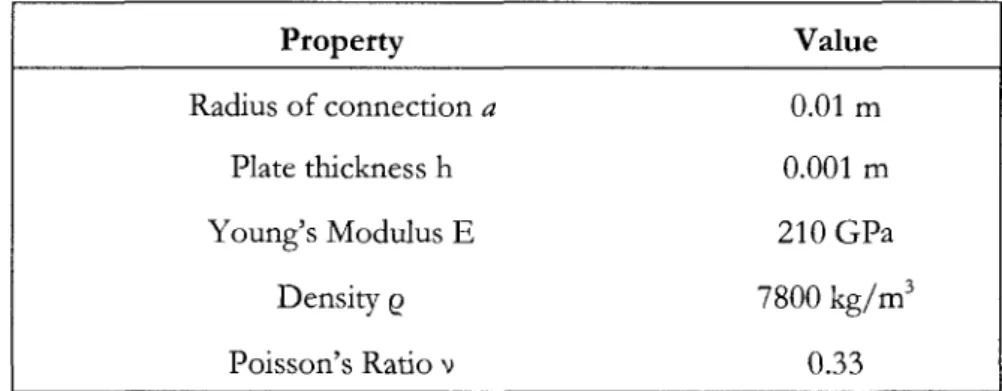
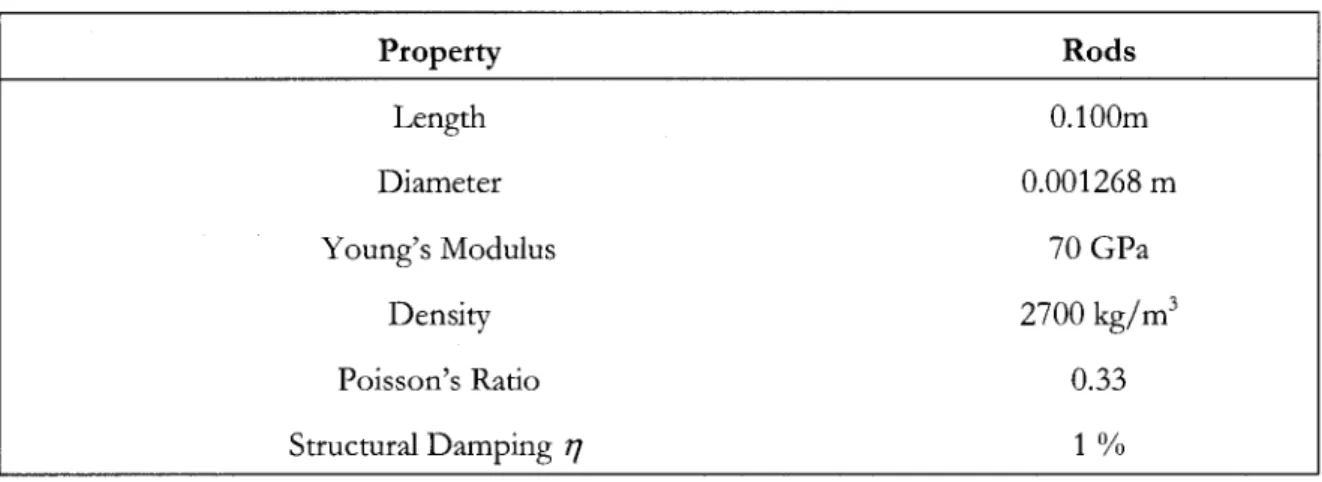
Table 5.1: Plate properties 57 Table 5.2 : Rods properties 58 Table 5.3 : Cavity properties 81 Table A.l : Estimated properties of the lower plate 116
Table A.2 : Estimated properties of the upper plate 118 Table B.l Properties of the plate used for NovaFEM validation 121
Table B.2 Properties of the coupled plates for NovaFEM validation 124 Table B.3 Properties of the plate for NovaFEM fluid-structure validation 127 Table B.4 Cavity properties for NovaFEM fluid-structure validation 127 Table G.l : Rods properties for the double wall transmission problem 158 Table G.2: Plate properties for the double wall transmission problem 159
Glossary
This glossary is intended to facilitate the understanding of the abbreviations used in the current thesis for a matter of conciseness.
BEM: Boundary Element Method BHTC : Bell Helicopter-Textron Canada
CMT: Component Mobility modeling Technique CLF: Coupling Loss Factor
DLF: Damping Loss Factor D O F : Degree of freedom
ECU : Environmental Control Units FEM: Finite Elements Method
GAUS : Groupe d'Acoustique de l'Universite de Sherbrooke IRC: Industrial Research Chair
MGB: Main Gearbox
NCT: Noise Control Treatment
NSERC: Natural Sciences and Engineering Research Council of Canada OSHA : U.S. Occupational Safety and Health Administration
SBN: Structure-Borne Noise SEA: Statistical Energy Analysis TOB: Third Octave Band
1 Introduction
Noise and vibration reduction in vehicles has become one of the major topics for research and development in aerospace, aeronautical and automotive industry for the last decades. Indeed, reducing noise pollutants and vibration will lead to both enhancements of the passengers and crew members' comfort and improvement of lifespan of the onboard equipment and vehicle structure itself.
It is to be pointed out that improving crew members effectiveness and passenger comfort by reducing noise and vibration is already and will become a more and more important issue since European and American authorities have established regulations to limit the exposure times of crew member to noise and vibration in turboprop and helicopter aircrafts cabins; current regulations which are expected to become more rigid within the next decade.
For instance, the U.S. Occupational Safety and Health Administration (OSHA) has determined that exposure to sustained sound levels above 90 dB can cause irreversible hearing damage. Consequently, OSHA has limited workers exposure to 90 dB sound levels to 8 hours a day. In addition, as a result to the logarithmic nature of the dB scale, exposure to 95 dB sound levels should be limited to 4 hours or less. It is then evident that reducing these exposure levels is of a major concern for aircraft manufacturers in order to remain at the top of a highly competitive market.
In response to this context, this Master's Degree takes place in a thematic of research in the fields of modeling, validation and optimization of noise and vibration inside aeronautical vehicles, as defined in a Natural Sciences and Engineering Research Council of Canada (NSERC) Industrial Research Chair (IRC) program held by Professors Berry and Atalla. Conducted in collaboration with Bell Helicopter-Textron Canada (BHTC), this project focuses on prediction of structure-borne noise propagation in helicopter aircrafts.
1.1 Technological problematic
The interior noise levels in rotorcrafts is a major problem for helicopter designers and manufacturers, reaching levels from 20 up to 30 dB superior to those measured in fixed wings aircrafts. Both passengers and crew members in current commercial helicopters are exposed to high noise levels which cause speech interference and the need for increased vocal output for communication. The internal noise level of helicopters then becomes a very important comfort criterion from a commercial viewpoint.
Another important criterion from a commercial point of view is speed and payload. Increases in engine powers and speed, coupled with advances in lighter and stiffer structures inevitably conducts to the need for extra soundproofing, so that the weight benefit achieved by higher horsepower density designs is often more than offset by the weight of added cabin treatment as discussed by p U S S A C et al., 1993] and [YORKIE et al., 1983].
As mentioned by [YORKIE et al., 1983], the architecture of present helicopters is generally responsible for a high level of noise inside the cabin since the propulsion system is in close proximity to the cabin and as previously discussed, massive addition of passive or active noise control in order to keep acceptable noise levels is always at odds with the objectives of increasing payload and aircraft performance with minimum added weight.
Such limitations have motivated the use of numerical simulation of the vibroacoustic response of actual helicopters in order to be able to predict the effect of virtual modifications on the aircraft with a proper level of confidence in the results at a design stage of the future generations of helicopters, allowing increased efficiency in terms of time and costs of research and development. With an aim of reducing cabin noise levels in their civil helicopters, BHTC, in partnership with the Groupe d'Acoustique de FUniversite de Sherbrooke (GAUS), is investigating better active and passive noise reduction means. An initial Master's Degree project has been realized by Guillaume Cousineau-Bouffard [COUSINEAU-BOUFFARD 2005] on developing a Statistical Energy Analysis (SEA) model of the M430 helicopter in green configuration to perform predictive studies for airborne noise. Another Master Degree's project from Claire Balouet continued the latter work, applying passive noise control treatments (NCT) to the SEA model. Two other Master's Degree projects tackled active control application to helicopters, firstly with Julien Monet Descombey [MONET DESCOMBEY 2005] and then with Pierre Belanger
[BELANGER 2006]. The present work will concentrate on developing a robust method for modeling structure-borne noise (SBN) in the numerical helicopter model.
1.2 The relevance for modeling the main gearbox structure-borne noise
Adequate modeling of all the excitations in a vibroacoustic problem is of great importance in
order to have a good estimation of the response of the system. Adequate modeling implies in this case to identify the major sources of excitation and take them into account with a sufficient level of details.
It has been shown in the studies of input characterizations by [YORKIE et a/., 1983] that helicopter cabin noise sources are both vibratory and acoustic/aerodynamic. A noise sources ranking shown in Figure 1.1 has been conducted for an untreated helicopter cabin (green configuration) and the primary source is the main rotor gearbox (MGB) while secondary sources include the hydraulic systems noise, due to pressure fluctuations, followed by airborne noise from the boundary layer external aerodynamic perturbation on the fuselage, the engine casing noise radiation, the engine exhaust noise and the main rotor rotation. Other sources are the tail rotor and the cabin environmental control units (ECU), generated by the air-cycle machine and conducted to the cabin via ducts.
io m TOTAl f l TRANSMISSION (MEASURED) HVDftAUUCS (MEASUREO) BOUNDARY LAYSR* ENGINE C t t l M C * ewaiNg E X H A U S T * MAIN mrm (MEASURED) •IPMTMt ESTIMATES
*•• tt i.awe it Figure 1.2 : Sikorsky bare cabin SPL. Figure from [YORK1E et al., 1983].
A typical noise spectrum of the Sikorsky S-76 helicopter cabin is displayed in Figure 1.2. It is noticeable that MGB noise is characterized by pure tones extending to high frequency. These discrete tones occur at gear mesh frequencies and their harmonics and are therefore an important source of both airborne noise and structure-borne noise (SBN) in the cabin.
Work has also been done on the Bell 222 and Bell ACAP (Advanced Composite Airframe Program) helicopters in green configuration by [MATHUR & et al, 1988 a,b] in order to obtain analytical predictions and in-flight evaluations of cabin noise levels. They relate that helicopter cabin noise in an untreated configuration is usually dominated by the engines and MGB and that the gearbox is a source of both acoustic and vibratory energy. In flight noise data showed that both Bell 222 and ACAP cabin noise are dominated by the MGB as shown in Figure 1.3.
The reasons why the M G B is the main noise source in the cabin are discussed by [MATHUR & etaL, 1988 a,b] as:
• Transmission noise is composed of discrete tones at gear mesh frequencies and their harmonics and is propagated as both structure-borne and airborne noise.
• The dynamic forces resulting from the gear teeth meshing process within the gearbox are of a high frequency nature and excite a multitude of structural and acoustic modes.
• The main transmission is situated in close proximity to the cabin and is coupled with the lighdy damped airframe which is an efficient radiator.
• Primary gear mesh frequencies often fall within the ear's range of peak sensitivity. • Discrete tones are more annoying than broadband noise of the same level.
LEVEL FLIGHT: 220 km/h Legend * * 121 SSS • » Lwrwl flight: 22» lan/hr IN iiiiiiiiiiiiin inn " " " g ^ ^ ' ^r **•**••«'#•«»** 1K SK *K MC * » *
1/3 OCTAVE Cmm FREQUENCY, I4z
12S 2S$ m® IK. 2K 4K 8K IB OCTAVE CENTER FREQUENCY, Ht Figure 1.3 : Comparison of flight test and predicted SPL results inside the Bell 222 (left) and ACAP (right) helicopters (average cabin noise levels). Figure from [MATHUR & et al., 1988 a,b].
Similar remarks were made by [DUSSAC et al., 1993] stating that it appears that the coherence function between the cabin acoustic pressure and the MGB acceleration reference is high for the meshing frequencies and the excitation from the M G B is predominant in the medium frequency range. This therefore introduces the relevance of taking proper account of the effect on noise in the cabin from the MGB, that is, need for modeling properly both airborne and structure-borne transmission.
1.3 Scientific problematic
In order to compare and optimize noise control in the Bell 430 Helicopter, it is of evident purpose to develop models to predict the vibroacoustic behaviour of the aircraft. With the increasing available computational power, many numerical techniques for modeling noise control engineering problems have emerged in the last two decades.
Deterministic methods such as Finite Element Method (FEM) and Boundary Element Method (BEM) have been commonly used over the 90's. The major advantage of these deterministic methods is the possibility of modeling the behaviour of complex geometries with a high level of detail. However, even though these methods are a powerful tool for low frequency analysis, a problem is encountered at high frequencies, involving short wavelengths and thus requiring highly refined meshes. In addition to the latter problem, aircraft structures are complex structures in nature and proper modeling with a highly refined mesh involves large number of degrees of freedom (DOF) and thus extremely large computational expense.
Stochastic approaches such as SEA appears a an appropriate approach for higher frequencies, reducing the calculation burden associated to the high number of D O F and reducing the level of details required for calculation. SEA is a statistical approach to model complex systems, for instance an aircraft, by dividing it into subsystems (groups of similar wave field). The vibroacoustic response of the system to external excitations is then obtained by computation of the average vibrational/acoustic energy levels in the different subsystems using the principle of power balances instead of calculating the displacements of tens of thousands of nodes. Determination of the response of the main subsystems representing the problem requires knowledge of the coupling loss factors (CLF) which represent energy flow between the subsystems, their respective damping loss factors (DLF) associated to energy dissipation in the subsystems, their modal density and finally the power inputs to the subsystems. The SEA parameters are time, frequency band, and spatially averaged to make the problem function of global rather than detailed properties. Energy levels are transposed into mean quadratic velocities and pressures, characterizing the unknowns of the vibroacoustic problem and making it possible to identify its main transmission paths. The basic theory and procedures for application of the SEA is discussed in detail by [LYON et aL, 1975, 1995] and [KEANE et al, 1993].
However, loss of information occurs with SEA since its information is time, frequency band, and spatially averaged. This is particularly true when the mode count is low, which occurs at low frequencies or in small structural elements which are not large in comparison with the wavelengths. Also of concern is the proper modeling of complex connections between
subsystems to determine the associated CLFs.
The idea of combining deterministic and statistical methods by developing Hybrid FEM-SEA has been explored in the last decade in order to overcome the so-called mid-frequency problem. A classical Hybrid FEM-SEA approach consists in modeling via FEM the response of junctions between SEA subsystems, then determining the CLFs to be added to the SEA model. Since hybrid models showed improved but not perfect agreement with experimental data, work still has to be done in improving the Hybrid FEM-SEA method.
In the current project, emphasis will be put on validating and extending the method proposed by [SHORTER et a/., 2004, 2005a,b,c,d] to typical aircraft structures, the method consisting of modeling a complex system with both deterministic (FEM) and random (SEA) domains coupled together. Coupling will apply by the fact that small or stiff components with low mode counts will be modeled deterministically while large ones which satisfy the SEA hypothesis will be modeled using SEA. This approach will be discussed in further details in section 3.3.
In addition a substitute hybrid FEM-SEA method will be presented and the different methods will be compared using a case study.
1.4 Objectives
The main objective of this Master's thesis is to review, develop and compare advanced and refined modeling strategies for structure-borne sound from main gearbox excitation in helicopter cabins. Different modeling strategies will be developed for a representative roof backed-cavity mechanically excited via a simplified helicopter gearbox-like structure. Numerical results will be compared to experimental data.
The specific objectives are to:
1. Conduct a literature review on helicopter cabin noise problematic
2. Review the different modeling techniques available for the problematic of structure borne noise in helicopter cabins
3. Illustrate the theoretical background required for the achievement of the project 4. Compare models developed models
a. using the different techniques for a structural in vacuo problem and b. extend the developed models to account for a coupled cavity
5. Discuss about the validity of the developed techniques with a specific attention to the case of modeling structure-borne noise (SBN) in helicopter cabins.
2 Numerical approaches : a review
With the increasing available computational power, many numerical techniques for modeling noise control engineering problems have emerged in the last two decades. An overview of two methods for modeling SBN has been briefly introduced in section 1.3: the Finite Element Method (FEM) and Statistical Energy Analysis (SEA).
2.1 D e t e r m i n i s t i c approaches
2.1.1 Finite Elements Method (FEM) and its limitations
As previously exposed, deterministic methods such as Finite Elements Method (FEM) and Boundary Elements Method (BEM) have been commonly used over the 90's. The major advantage of these deterministic methods is the possibility of modeling the behaviour of complex geometries with a high level of detail. However, even though it is a powerful tool for low frequency analysis, where the modal overlap factor is small, the latter being proportional to the modal density times the damping as discussed in [LYON et al., 1975, 1995], a problem is encountered at high frequencies with low damping, involving short wavelengths and thus requiring highly refined mesh, resulting in large numbers of D O F , thus unrealistic computational burden for complex structures such as an automotive or an aircraft fuselage with the present numerical facilities, given that these methods rely on dynamic equilibrium equations.
In addition to the latter problem, [GAGLIARDINI 2005] pointed out that the overall detailed FEM modeling seems hopeless not to say meaningless, regarding vehicle diversity due to manufacturing imperfections resulting in variable physical properties or boundary conditions. Undeniably, one of the features of a realistic model is that account is taken for real world uncertainties as stated by [LANGLEY et al, 2005]. However, limitations occur since the system properties uncertainties might be known in a limited -way, and even if these uncertainties 'were to be known, the analytical and computational task of converting this to a description of the
detailed nature of the system randomness. Stochastic approaches such as SEA then become relevant.
2 . 2 S t o c h a s t i c a p p r o a c h e s
2.2.1 Classical Statistical E n e r g y A n a l y s i s ( S E A ) a n d its l i m i t a t i o n s
SEA appears as an appropriate approach for higher frequencies, reducing the calculation burden associated to the high number of D O F and reducing the level of details required for calculation. SEA is a statistical approach to model complex systems, for instance an aircraft, by dividing it into subsystems (groups of similar wave field).
The basic theory and procedures for application of the SEA is discussed in detail by [LYON eta/., 1975, 1995] and [KEANE eta/., 1993]. The vibroacoustic response of the system to external excitations can be obtained by computation of the vibrational/acoustic energy levels in the different subsystems with the principle of power balances. Energy levels are transposed into mean quadratic velocities and pressures, characterizing the unknowns of the vibroacoustic problem and making it possible to identify its main transmission paths.
Given this principle, for a set of coupled subsystems j and k, with external excitation applied to the first, the equations are assembled into an SEA matrix and the system to solve can be expressed in conformity with [LYON eta/, 1975,1995] and [KEANE eta/, 1993]:
CO
_ {-Vjk)nj ( % + % , ) " *
Where 7]. is the damping loss factor (DLF) of subsystem j , f].k is the coupling loss factor (CLF) for the energy exchange from subsystem j to k, n. is the modal density of subsystem j , Y\in . is the external power input to subsystem j and co is the frequency of excitation. To determine the energy levels EL and Ek, the SEA approach comes down to the determination of the main subsystems representing the problem, the CLF values between the subsystems, their respective D L F and modal density and finally the power inputs to the subsystems. It is important to state at
n_
this point the equation of reciprocity for the flow between two SEA subsystems as presented by
\LYONetal, 1975, 1995],
TIjknj=TIisnk (2
which allows to express the power flow from subsystem^ to subsystem k (2.1) as
'E, E, („ - \ njk=ar}jknj J ^k
KnJ n*J
(2
[CLARKSON et al., 1981] presented an overview about experimental determination of values for D L F and CLF. It is discussed that the simplest way to measure the damping loss factor is to excite the modes in a given frequency range and measure the decay of vibration after the excitation is cut off. It is found that this method is limited to work properly only when all the modes in the frequency band have similar damping values.
An alternative energy approach suggested that knowing the average force and response, one will then be able to obtain the DLF. However, for obtaining proper results, it will be necessary to estimate the spatial average surface velocity from several accelerometers. It must be noted that the size of exciter and accelerometer mounts become important at high frequencies since its diameter can approach the wavelengths of the bending waves in the structure. Measured D L F with the suggested method were compared with those obtained from the decay method. Significant differences between both methods occurred, which were explained by [CLARKSON et al, 1981] from the fact that decay tests tend to be dominated by the mode in the band which has the lowest damping whereas the suggested energy method should give a value closer to the average of all modes in the band. Note that a recent comprehensive discussion on this subject is in Maxime Bolduc's P h D thesis [BOLDUC 2007].
Determination of coupling loss factors was discussed by [CLARKSON et al, 1981] and [FAHY 1993]. Energy transmission between adjacent subsystems can be modeled using 3 different approaches in SEA as presented by [FAHY 1993].
Traditionally, the modal approach has been applied to construct the theory of SEA. This approach relies on the principle of calculation of power flow between two connected subsystems.
in a subsystem equals the energy dissipated in this subsystem itself plus the transmitted energy to the connected subsystem.
[CLARKSON et al., 1981] also suggested that knowing a priori die D L F of the driven subsystem from separate measurements, the total loss factor of the coupled subsystems can be measured and equated to the CLF (unknown) plus the driven subsystem D L F (known). However, when low coupling exists between both subsystems i.e. natural frequencies of both subsystems are not close enough one to the other, this method will not be appropriate since damping loss factors will tend to be up to two orders of magnitude greater than the coupling loss factors. [FAHY 1993] also discussed that the modal approach was generally not well suited for structural engineering application but was more practical for vibroacoustic problems involving fluids coupled to structures. An apparent limitation to this method in structural applications is the difficulty to collect sufficient number of point measurements for spatial averaging,
A second approach introduced by [FAHY 1993] is the wave approach which relies on modeling the wave propagation at the interface between two connected subsystems and determine the CLF in terms of the wave transmission coefficient. Since propagating waves are mainly dependent on the dynamic properties of the wave-bearing medium, it is to notice that the CLF computed via this approach are not influenced by the damping in opposition to the modal approach. It is also to notice that this approach will be more effective if the modal overlap factor is greater than unity, since it is assumed in this method that transmitted waves returning to the connection after reflections in the subsystems are uncorrelated to the direcdy transmitted waves. As previously mentioned, the modal overlap factor is proportional to the modal density times the damping as discussed in [LYON et al, 1975,1995].
A third approach is the mobility approach to SEA presented by [FAHY 1993], [ C A C C I O L A T I e ^ Z , 1993] and [ M A N N I N G 1993]. CLFs can be expressed by the use of mobility functions of the junctions between subsystems. In fact, knowing the forces and velocities the power transmitted through the interface is obtained as the time-averaged product of its related forces and velocities. Hence, one can evaluate the wave power transmission coefficients in terms of the junction mobilities in analogy to the modal approach. This approach will be extended in a hybrid FEM-SEA approach based on the mobilities of both FEM and SEA subsystems in Chapter 3.
Hypotheses of SEA
As " S " in SEA stands for statistical, the SEA parameters are time, frequency band, and spatially averaged to make the problem function of global rather than detailed properties. Energy levels are transposed into mean quadratic velocities and pressures, characterizing the unknowns of the vibroacoustic problem and making it possible to identify its main transmission paths. The main assumptions that make SEA possible are:
• large but not infinite subsystems; • low damping;
• coupling loss factors r\-k between subsystems j and k is not influenced by coupling between other subsystems;
• high modal density thus • high modal overlap; • diffuse field conditions;
• equal repartition of energy between the modes; • low coupling between the modes and
• statistically independent forces acting on each modal subsystem.
The basic theory and procedures for application of the SEA are discussed in detail by [LYON etal, 1975, 1995] and [KEANE et al., 1993].
At the current point, it is pertinent to become aware of the fact that for a given frequency range, some components of the helicopter may satisfy the SEA assumptions while some other components may not. This introduces the limitations of SEA and will become the cornerstone for investigating numerical approaches that couple F E M and SEA.
Limitations of SEA
SEA appears to be a powerful tool in order to reduce the computational burden in modeling vibro-acoustic problems, however it must be kept in mind that this method has several
and spatially averaged. This is particularly true when the mode count is low, which occurs at low frequencies or in small structural elements which are not large in comparison with the wavelengths. It is also a concern that adequate evaluation of the inputs to the SEA model that are the DLF, CLF, modal densities and power inputs to the system is usually a complex problem. [SESTIERI et at, 1999] also highlight that the definition of the appropriate modal subsystems is generally not a simple task because they do not necessarily coincide with the structural components, so that their definition relies on the experience of the analyst.
It is also to keep in mind that the high mode count assumption might not be satisfied at low frequencies or in small structural elements which are not large in comparison with the wavelengths. As discussed by [CLARKSON et al., 1981], high impedance subsystems may also tend to fail satisfying the high modal density hypothesis of SEA since modal density is inverse proportional to impedance.
Indeed, [CLARKSON et al., 1981] discuss that the point impedance of a structure is directly related to the modal density: A structure with many modes will be easily excited and on the other hand a structure with few modes will require a much greater dynamic force to set up the same level of vibration. Then, the mobility, which is the inverse of the impedance, is directly proportional to the modal density. Knowing the mobility by experimental measurements, one will be able to determine the modal density for a frequency band from fx to f2 via equation (2.4)
1
n(f) * — — - f 4 M 4 R e ( 7 ) # (2.4)
Where M, A and Y are the mass per unit area, surface area and mobility respectively. Note that classical textbooks discuss the estimation of the modal densities for classical systems such as plates, shells, and cavities. On the other hand several papers have been published on the estimation of modal densities for complex systems (ribbed plates, composites, sandwich). The associated expressions and calculation methods can be found in [ATALLA 2005].
2.3 Hybrid FEM-SEA approaches
As the advantages and limitations of deterministic and stochastic approaches were previously stated, it appears attractive to attempt developing a hybrid FEM-SEA method in order to overcome the so-called mid-frequency problem that appears at the intersection of the fields of validity of both FEM and SEA modeling techniques.
The idea of combining deterministic and statistical methods by developing Hybrid FEM-SEA has been explored in the last decade in order to overcome the mid-frequency problem. The following section will thus present three approaches which could be referred to as hybrid FEM-SEA approaches, hence the Classical SEA enhanced by virtual experimental data; the hybrid coupled FEM-SEA and the SEA enhanced by the Component Mobility modeling Technique (CMT).
2.3.1 Classical Statistical E n e r g y Analysis e n h a n c e d b y virtual e x p e r i m e n t a l data
A classical Hybrid FEM-SEA approach consists in modeling via FEM the response of junctions between SEA subsystems, then determining the CLFs to be added to the SEA model.
This approach is in fact similar to the standard experimental SEA that employs CLF computed from experimental data, consequendy, since an experiment is somewhat simulated, it refers to virtual experimental data. It is to be highlighted that it is assumed that adjacent connected subsystems do not affect the coupling between two connected subsystems.
[SIMMONS 1989] stated that the average energy of a plate which can be derived from the squared and spatially averaged displacements in a given frequency band is easier to interpret and generally more accurate than the predicted displacements for given individual position and frequency. This statement will allow to use the mean quadratic velocities of the plates obtained from F E M simulations to determine SEA coupling loss factors instead of using wave transmission coefficients presented by [FAHY 1993] or junction mobilities.
2.3.2 Hybrid coupled FEM-SEA
In the current thesis, emphasis will be put on validating and extending the general hybrid FEM-SEA method proposed by [SHORTER et al, 2004, 2005a,b,c,d] to overcome the
mid-frequency problem. The latter method consists of modeling a complex system with both
deterministic (FEM) and random (SEA) domains coupled together. Coupling will apply by the fact that small or stiff components with low mode counts will be modeled deterministically while large ones which satisfy the SEA hypothesis will be modeled using SEA.
A deterministic FEM description of the short wavelength response requires a large number of D O F , consequently a large amount of computational expense while SEA provides a good description of subsystems that are two or three dimensional and large compared with a wavelength.
Consequently, the approach involves splitting the structure up into a deterministic part and a series of fuzzy parts. The deterministic part is modeled using F E and the fuzzy parts are modeled using SEA.
An example of application of the hybrid FE-SEA method in a structural vibration problem is proposed by [SHORTER et-A,. 2005b]. It is found that the ensemble average response predicted with the hybrid FEM-SEA approach is in good agreement with the FEM Monte Carlo simulations and thus the approach appears as a robust and computationally efficient way to model structural response of complex systems. Other examples are available in both [SHORTER ^al,. 2004] and [SHORTER tfal,. 2005d]. For a matter of conciseness, these validations are not presented in details in the present text but the main results are a significant reduction of the computational burden in all cases and good agreement between the hybrid method and Monte Carlo FEM simulations.
It is also noticeable that the hybrid method enables additional diagnosis to be performed on the system to provide insights into the way in which energy is transmitted through a complex system. It is possible to perform a contribution analysis to see how much each global basis function (eg. Mode) contributes to the transmission of energy between the SEA subsystems. Examination of the mode shape associated with a basis function then provides insights into how the system can be modified to reduce the ensemble average transmission of energy in the system (for instance by moving the connection locations).
It is therefore possible to believe that combining deterministic and stochastic approaches together is a field of studies to explore in trying to find a solution for the mid-frequency problem, frequency range for which a system considered as a whole is neither perfectly deterministic nor perfecdy statistical. The goal is to obtain a method that accounts for necessary deterministic detail level without requiring the system to be completely modeled deterministically.
As discussed by [SHORTER et al,. 2005a], determination of local energy flows in SEA between adjacent subsystems (the CLF calculation in SEA) often requires a detailed description of the local dynamic behaviour of the junction. The traditional wave approach to SEA as introduced in the section about Classical Statistical Energy Analysis (SEA) and its limitations typically provides good estimate for the CLF of junctions. However, if any of the subsystems connected to the junction are small compared with a wavelength, transmission of the energy through the junction is typically no longer governed by the local junction properties. It is hence often desirable to enhance local junctions detail using a local FEM model.
The FEM and SEA subsystems are thus coupled using various "hybrid" point, line and area junctions and a fully coupled analysis is performed. Typically, two- and three-dimensional subsystems that contain several wavelengths are modeled with SEA while stiff subsystems and local junction details are modeled with FEM. Thus, since FEM models are used only on stiff subsystems, they can be used up to a much higher frequency domain.
A detailed summary of the method is available in section 3.3 and in papers by [SHORTER «/al,. 2005d] and [COTONI & al. 2007].
2.3.3 M o d e l i n g t h e p o w e r e x c i t a t i o n from the m a i n g e a r b o x : S E A e n h a n c e d b y the C o m p o n e n t Mobility m o d e l i n g T e c h n i q u e
It is of prime importance to be able to characterize the mechanical excitations in order to predict the response of a vibroacoustic problem. Indeed, not only one has to model adequately the noise transmission but he must first know the inputs to the system. Relevant work has been conducted in the last 15 years in modeling the power inputs from mechanical sources attached to structures.
[DUSSAC et a/., 1993] discussed the fact that the power supplied by the mechanical excitations at gearbox attachment can be estimated using the mobility concept.
[OHLRICH 1995] presented a method for characterizing the input power defined by a set of terminal source powers from the gearbox to the structure of the helicopter. The source descriptor method is based upon the concept of equivalent sources, which assumes that a vibrating machine can be adequately represented by the complex vibratory power being produced by a set of uncorrelated, equivalent point forces. In such a practical application with a multipoint coupled gearbox, it was assumed that all cross coupling between transmission coordinates could be disregarded and for strut-type connections with simple support via ball and socket joints, it was judged acceptable to ignore transmission in the rotational coordinates, and thus retain only translational motions in the prediction. This assumption appears to be valid and has also been made successfully by [UNRUH et ai, 1999]. An approach for determining the power input to the airframe which consists in measuring free velocities of the gearbox and mobilities of both the gearbox and fuselage was developed. In the same way, [OHLRICH et a/., 1996] proposed a modified approach considering that the gearbox cannot always be removed from the aircraft. The approach then allowed determining the input powers by measuring the coupled mobilities of the gearbox and fuselage and the far field response of the fuselage and a calibration mobility measurement of the fuselage.
In both cases, it has been found that a good estimate of the source power is achieved by using a small number of equivalent forces and that no improvement is obtained by employing a very large number of equivalent forces. It has also been found that SBN transmission to the fuselage is only little affected by changes in the static load of ball-and-socket joints as long as the latter actually are in contact. The power transmitted to the fuselage appeared to be successfully determined but the predicted transmission based upon estimated terminal source powers (power estimated from
the excitation) has appeared to be somewhat lower than expected. A potential explanation for those discrepancies is that the input mobilities could not be measured in the free conditions and had to be calculated from the coupled mobilities measured on the assembled gearbox-airframe system.
Other works for characterizing input power have been done such as [MOORHOUSE 2001] for characterizing source power for components selection purposes in design. Suggested methods are still based on the measurement of free velocities of the source and mobilities of the source and receiver. It is stated that one of the major difficulties is that for SBN, the input powers depends not only on the source but on the mounting conditions and the receiver.
It can then be concluded that input power characterization via measurement of free velocities and mobilities is an attractive tool but no perfect method exists yet. However, these studies will be used as a starting point for developing a Hybrid FEM-SEA approach based on the input mobilities of both deterministic and stochastic subsystems for determining the forced response of the studied system.
3 T h e o r e t i c a l b a c k g r o u n d
3.1 Experimental SEA
As already exposed in section 2.2, it is of common practice to perform SEA modeling with CLF and D L F determined from experimental data. Determination of these factors is a major issue in modeling vibroacoustic problems via SEA. It is to be highlighted that it is assumed that adjacent connected subsystems do not affect the coupling between two connected subsystems.
[SIMMONS 1989] stated that the average energy of a plate which can be derived from the squared and spatially averaged displacements in a given frequency band is easier to interpret and generally more accurate than the predicted displacements for given individual position and frequency. This statement allows using the mean quadratic velocities of the plates obtained from measurements to determine SEA coupling loss factors instead of using wave transmission coefficients presented by [FAHY 1993] or junction mobilities.
[BIES et al. 1980] and [HOPKINS 2001] mentioned that it is suitable to perform measurements for several excitation points, allowing to obtain a satisfying modal statistical independence. [BIES et al. 1980] suggested that 3 or more excitation points per subsystem lead generally to a good approximation of modal statistical independence.
In this work, it was chosen to determine experimentally the SEA loss and coupling factors from two approaches, first by SEA matrix inversion as presented by [HOPKINS 2001] and second by estimating the damping loss factors using the decay rate technique and calculating the coupling loss factors using a power equation balance as suggested by [CLARKSON et al., 1981].
3.1.1 Determination of the loss and coupling factors by SEA matrix inversion
The vibroacoustic response of a system to external excitations can be obtained by computation of the vibration energy levels in the different subsystems with the principle of power balances. Given this principle, for a set of two coupled subsystems^' and k, with external excitation applied to the first, the equations are assembled into an SEA matrix and the system to solve can be expressed in conformity with [LYON et al, 1975, 1995] and [KEANE et al, 1993]
By exciting successively each of the subsystems, measuring the input power, the loss and coupling factors can be obtained by inverting the following system :
h][E]4[n]
(-rjJk) (%+%)
Where rj. is the damping loss factor (DLF) of subsystem j , ij.kis the coupling loss factor (CLF) for the energy exchange from subsystem^ to k, Ejk is the energy of subsystem_/when subsystem
k is excited, I I . . . is the external power input to subsystem^ and w is the angular frequency of the
considered frequency band.
Defining the energy and input power
Denning subsystem j as the flexural wavefield of the receiver structure and subsystem k as the flexural wavefield of the emitter structure, it is possible to write the plate energy level as
EJ=MJ(V2)J (3-3)
where M- is the mass of subsystem j . In our measurements, the frequency-band averaged mean quadratic velocity for each subsystem was averaged for three excitation locations prior to being used in (3.3) in order to satisfy the spatially averaged excitation hypothesis of SEA. These averaged mean quadratic velocities were computed using (3.4)
(V
2) =-Lf(v
2) (3.4)
The power input of to the excited subsystem can be written
ni