inflammatory cytokines during Plasmodium chabaudi adami infection and do not 2
contribute to immune evasion. 3
4
M. Cambos1, B. Bélanger1, A. Jacques 1, A. Roulet 2 and T. Scorza 1,3* 5
6 1
Department of Biological Sciences, Université du Québec à Montréal, Canada; 7
2
Institute of Parasitology, McGill University, Ste-Anne- de Bellevue, Canada; 8
3
FQRNT Centre for Host-Parasite Interactions. 9
10
Work was performed at: 11
The Department of Biological Sciences, Université du Québec à Montréal, Montréal, 12
Canada, H9X 3V9. 13
Running title: T reg cells control Plasmodium c. adami inflammatory responses. 14 15 16 17 Corresponding author: 18 Email: scorza.tatiana@uqam.ca. 19
Phone: 1-514-9873000, extension 1918. Fax : 1-514-9874647. 20
Mailing adresse: Department of Biological Sciences, Université du Québec à Montréal, 21
Case postale 8888, Succursale centre-ville, Montréal (Québec), H3C 3P8. 22
23
Research paper. 24
Abstract. 26
Different functions have been attributed to natural regulatory CD4+CD25+FOXP+ (Treg) cells 27
during malaria infection. Herein, we assessed the role for T reg cells during infections with 28
lethal (DS) and non-lethal (DK) Plasmodium chabaudi adami parasites, contrasting in the 29
levels of parasitemia, inflammation and anaemia. Independent of the parasite virulence, the 30
population of splenic Treg cells expanded during infection, and the absolute numbers of 31
activated CD69+Treg cells were higher in DS-infected mice. In vivo depletion of CD25+T cells,
32
which eliminated 80% of CD4+FOXP3+CD25+ T cells and 60-70% of CD4+FOXP3+ T cells,
33
significantly decreased the number of CD69+ Treg cells in mice with lethal malaria. As a result,
34
higher parasite burden and morbidity were measured in the latter, whereas the kinetics of 35
infection with non-lethal parasites remained unaffected. In absence of Treg cells, parasite 36
specific IFN-γ responses by CD4+ T cells significantly increased both in mice with lethal and
37
non lethal infection, whereas IL-2 production was only stimulated in mice with non-lethal 38
malaria. Following the depletion, the production of IL-10 by CD90- cells was also enhanced in
39
infected mice and interestingly, a potent induction of TNF-α and IFN-γ production by CD4+ 40
and CD90- lymphocytes was measured in DS-infected mice, which suffered earlier of severe 41
anaemia. Taken together, our data suggest that the expansion and activation of natural Treg 42
cells represents a counter-regulatory response to the overwhelming inflammation associated 43
with lethal P.c. adami DS infection which involves TH1 lymphocytes as well as cells from the 44
innate immune system. 45
46
Keywords: rodent malaria, Plasmodium virulence, natural regulatory T cells, inflammation. 47
48 49 50
1. Introduction 51
Natural Treg cells represent a population of CD4+CD45RBlow T cells constitutively 52
expressing the α chain of the IL-2 receptor (CD25) (Schwartz, 2005) and which in mice 53
comprise more than 85% of the cells expressing the Fork Head BOX P3 transcriptional factor 54
(FOXP3) (Khattri et al., 2003; Fontenot et al., 2005). These cells play determinant roles in the 55
preservation of self tolerance and in the control of graft and tumour rejection and inflammation, 56
and their abrogation leads to autoimmunity and inflammatory diseases in several experimental 57
models (Fontenot et al., 2005; Schwartz 2005). 58
In addition to their function in self-tolerance, Treg cells also participate in the control of 59
overwhelming responses to infectious agents such as viruses, bacteria and protozoan parasites 60
(Raghavan and Holmgrem, 2005; Belkaid et al., 2006; Demengeot et al., 2006; Suvas and 61
Rouse, 2006). In malaria, T reg cells expand during P. berghei ANKA infections (Nie et al., 62
2007; Vigario et al., 2007), and have been shown to inhibit the development of pathogenic TH1 63
cells, responsible for cerebral disease in resistant BALB/c mice (Nie et al., 2007). These results 64
contrast with the detrimental effects associated with T reg cells during P. berghei ANKA 65
infection in susceptible C57BL/6 mice (Amante et al., 2007). In this infection model, depletion 66
of T reg cells results in a significant increase in survival, a minor but significant reduction in 67
blood parasitemia and an important reduction in parasite load in the brain and vasculature. A 68
comparable delay in the onset of peak parasitemia has been reported during P. berghei NK65 69
infection in mice depleted of Treg cells (Long et al., 2003), and in the P. yoelii 17XL infection 70
model, elimination of Treg cells allows BALB/c mice to control otherwise lethal infections 71
(Hisaeda et al., 2004). Moreover, data provided by P. falciparum infections in humans 72
correlates the expansion of natural Treg cells and the production of TGF-β with higher parasite 73
multiplication rates (Walther et al., 2005). Altogether, these observations attribute contrasting 74
functions to natural Treg cells during Plasmodium infections. 75
Herein, the role of natural Treg cells in the lethality associated with P. c. adami 76
infection has been evaluated using two parasite strains with contrasting virulence, sustained by 77
distinct parasite multiplication rates, and by the severity of inflammation and anaemia 78
generated. Our results indicate that during P.c. adami infection, Treg cells contribute to the 79
control of overwhelming inflammatory responses, and do not impair protective immune 80
responses. 81
2. Materials and Methods. 82
2.1. Parasites, mice and infections. 83
The P. c. adami DS and DK strains derive from two different isolates (Congo-Brazaville, 84
1972). Female BALB/c mice, 4-6 weeks old (Charles River) were infected with 105 85
parasitized red blood cells (PRBC) by the intraperitoneal route. Parasitemia was measured 86
daily in methanol fixed tail blood smears stained with a 10% Giemsa solution in PBS. 87
2.2. Cell purification. 88
Single-cell suspensions of splenocytes from naive and P. c. adami infected mice (peak 89
parasitemia) were prepared. In experiments assessing the contribution of CD90- lymphocytes 90
in the inflammatory response, T cells were removed using MACS CD90 microbeads 91
(Miltenyi Biotec, USA), and levels of purity >95% were attained. CD4+ T cells were enriched 92
by negative selection using the EasySep® Mouse CD4+ T cell enrichment kit (STemCell 93
Technologies, Canada), and purity levels of 90-95% were obtained. Syngeneic adherent 94
peritoneal macrophages were used as accessory cells, and were shown to be >85% CD11b+ 95
cells following staining with anti-mouse CD11b monoclonal antibody (Mab) (clone 96
CL8941F, Cedarlane Laboratories). 97
2.3. Assessment of CD4+ T cell function. 98
Purified CD4+ T cells from naïve and infected mice (untreated or depleted of CD25+ T cells 99
in vivo) were co-cultured in 96 well plates (2x10⁵ cells /well) with naive peritoneal
macrophages (2 x 10⁴ cells/well), and were stimulated with low endotoxin azide-free anti-101
CD3 Mab (4µg/ml, clone C363.29B, Cedarlane Laboratories) or with 60,000 homologous 102
PRBC. Culture supernatants from stimulated CD4+ T cell were recovered 24h or 72h later for 103
IL-2 and IFN-γ measurements by ELISA, respectively. All samples were assessed in 104
triplicates. 105
2.4. Phenotypic characterization of natural Treg cells by flow cytometry. 106
Splenocytes from naive and infected mice (moderate and peak infection) were co-stained with 107
FITC-conjugated anti-mouse CD4/L3T4 (clone GK1.5, Southern Biotech), allophycocyanin 108
(APC)-conjugated anti-mouse CD25/IL-2 receptor alpha (IL-1Rα, clone 7D4, Southern 109
Biotech) and PE/Cy-7conjugated anti-mouse CD69 (clone HI-2F3, Biolegend) Mabs 110
following standard procedures. The cells were fixed and permeabilized in a 111
fixation/permeabilization solution and permeabilization buffer (eBioscience, USA) and were 112
incubated with anti-mouse FOXP3-PE Mab (clone FJK-16S, eBioscience, USA). The 113
percentages and absolute numbers of FOXP3+ T cells within the CD4+CD25+ population were 114
determined using a FSC/SSC gate on lymphocytes and a gate on CD4+ CD25+T cells. CD69
115
expression in FOXP3+ and FOXP3- CD4+ T cells and in CD4- lymphocytes was determined 116
by a multiparametric analysis using a FACScan (Becton Dickinson, USA). 117
2.5 In vivo depletion of CD4+CD25+ T cells. 118
Depletion of CD25+ T cells was carried out by intravenous administration of anti-mouse 119
CD25 Mab (clone PC61, rat IgG1). The antibody was purified from supernatants from 120
confluent cell cultures of the TIB-222 hybridoma (kindly provided by Dr. C. Piccirillo, 121
McGill University) on a Hi-Trap Protein G column according to the instructions provided by 122
the manufacturer. Mice received 500µg of the PC61 Mab by intra-peritoneal injection a day 123
prior to and a day after infection. Depletion efficiency, assessed by FACS analysis of 124
CD4+CD25+ cells, ranged from 85% to 95%, and the effect was shown to persist for more 125
than 10 days. 126
2.6 Quantification of IL-2, IL-10, IFN-γγγγ and TNF-ααα. α 127
Interleukin-2 (IL-2) was measured in 24h culture supernatants from CD4+ T cells harvested
128
from naïve and infected mice (untreated or depleted of CD25+ T cells), following stimulation 129
with homologous PRBC (60,000) or with anti-CD3 Mab (4µg/ml). The capture (Clone JES6-130
1A2) and detector (Clone JES6-5H4) anti-mouse IL-2 Mabs (Caltag laboratories, USA) were 131
used. Antigen-antibody complexes were detected with a streptavidin-horseradish peroxydase 132
conjugate (Amersham Biosciences, USA) and the reactions were developed by addition of a 133
TMB solution (3, 3’, 5, 5’-tetramethylbenzidine, Sigma). Absorbance at 450nm was measured 134
in a BioRad Model 550 microplate reader. IL-2 concentrations in samples were calculated 135
against a standard curve generated with recombinant mouse IL-2 (Cedarlane Laboratories 136
Ltd, CA). 137
Interleukin-10, IFN-γ and TNF-α were measured in 72h cultures of non-stimulated 138
splenocytes (4x10⁶ cells/ml), CD4+ T cells (4x10⁶ cells/ml) and CD90- lymphocytes (4x10⁶
139
cells/ml) from naive and infected mice (untreated or depleted of CD25+ T cells) using the BD 140
OptEIATM sets for mouse IL-10, IFN-γ and TNF-α (BD Biosciences, USA). IFN-γ was also 141
quantified in 72h cultures of CD4+ T cells from uninfected and infected mice, deprived or not 142
of CD25+ T cells, following stimulation with PRBC or with anti-CD3 Mab as described 143
previously. 144
2.7. Determination of hemoglobin in blood. 145
Hemoglobin concentrations were measured in control mice and in mice depleted of CD25+ T
146
cells (n=7 per group) immediately before and every two days following infection. Briefly, 2 147
µl tail-vein blood was diluted in 500µl Drabkin’s solution (Sigma) and hemoglobin was 148
assayed in 96-well microtiter plates (Costar, Cambrifge, MA) in a volume of 100 µl by 149
measuring the absorption at 540nm in a microplate reader. Values were converted to 150
milligrams per millilitre using a standard curve of human hemoglobin (Sigma) prepared in 151
Drabkin’s solution. All samples were assessed in duplicates. 152
153
2.8. Statistical analysis. 154
Statistical analysis was performed using a Mann Whitney test for the comparison of parasite 155
burden and blood hemoglobin content in control and anti-CD25 treated mice. A one way 156
ANOVA and Bartlett's tests for equal variances was used when comparing three or more 157
groups (≥6 individual mice per category) using the Prism Software. 158
159
3. Results 160
3.1. Pro-inflammatory cytokines responses are enhanced during lethal P.c. adami 161
infection. 162
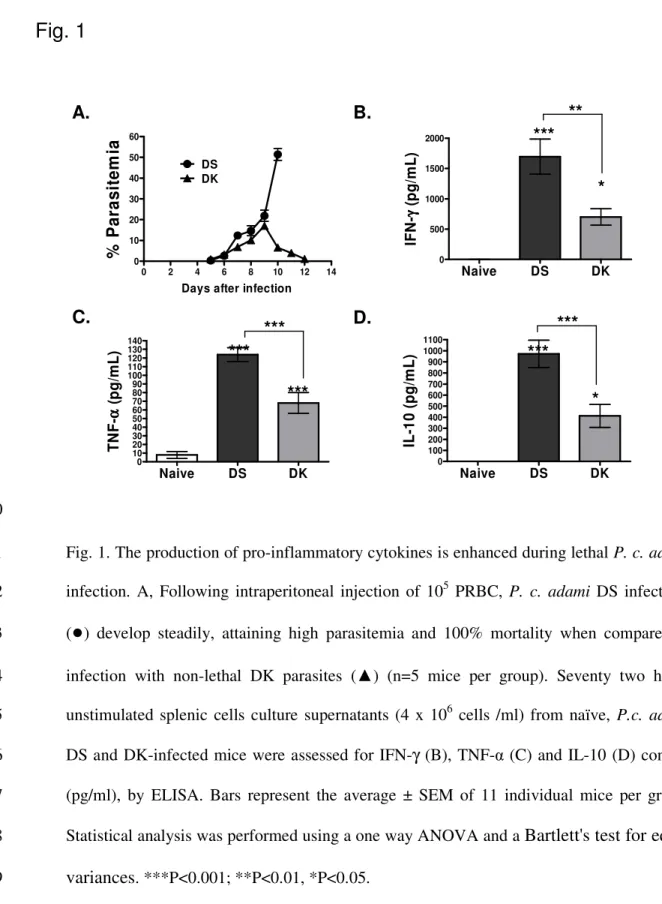
In BALB/c mice and in other inbred and outbred mouse strains, inoculation of P. c. adami 163
DS PRBC results in elevated parasitemia (45-65%) and 100% mortality (Scorza et al., 2005 164
and unpublished results) (Fig. 1A). In contrast, similar infective doses with DK parasites 165
result in moderate infection (13-20% parasitemia) that resolves 12 to 13 days later in 166
BALB/c mice (Fig. 1 A). 167
We compared the levels of TNF-α, IFN-γ, and IL-10 in 72h culture supernatants of splenic 168
cells from BALB/c mice with lethal and non-lethal infection, harvested at the moment of 169
peak parasitemia without further stimulation. Significantly higher concentrations of IFN-γ 170
(Fig. 1B), TNF-α (Fig. 1C) and IL-10 (Fig 1D) were measured in unstimulated splenic cell 171
cultures from mice with lethal infection. 172
3.2. Parasite-specific TH1 effector cells are activated during lethal and non-lethal 173
infection, but fail to produce IL-2 in response to anti-CD3 stimulation. 174
The functional state of purified CD4+ T cells from infected mice was assessed at the 175
moment of highest parasite burden, corresponding to peak parasitemia at day 9 and 10 176
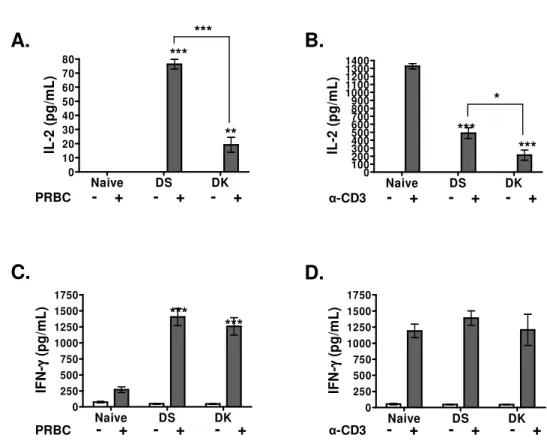
following infection with non-lethal DK or lethal DS parasites, respectively. Specific IL-2 177
production by CD4+ T cells in response to stimulation with homologous PRBC was 178
measured during the two infections, and was shown to be significantly higher in mice with 179
lethal malaria (Fig. 2A). Interestingly, in comparison with cells from uninfected mice, an 180
important reduction in IL-2 production in response to stimulation with anti-CD3 Mab was 181
measured in CD4+ T cells from infected mice. The impaired IL-2 response was more
182
pronounced during non-lethal malaria (86±8% compared to 64±7% inhibition during DS 183
infection) (Fig. 2B). Independent of the virulence, comparable specific IFN-γ responses 184
were detected when stimulating CD4+ T cells from infected mice with PRBC (Fig. 2C), as 185
well as following stimulation with anti-CD3 Mab (Fig 2D). 186
3.3. The absolute numbers of activated Treg cells significantly increase during lethal 187
infection but their depletion does not abrogate the lethality associated with DS 188
parasites. 189
Treg cells have been shown to control exacerbated inflammatory responses during 190
P.berghei ANKA infections (Nie al at., 2007). As the production of pro-inflammatory
TNF-191
α and IFN-γ was shown to be significantly up regulated during DS infection, we 192
investigated whether Treg cells preferentially expanded in mice with lethal malaria. A 193
lymphocyte gate was created to determine the percentages and absolute numbers of 194
FOXP3+ T cells within the splenic CD4+ T cell population in naive and infected mice (Fig.
195
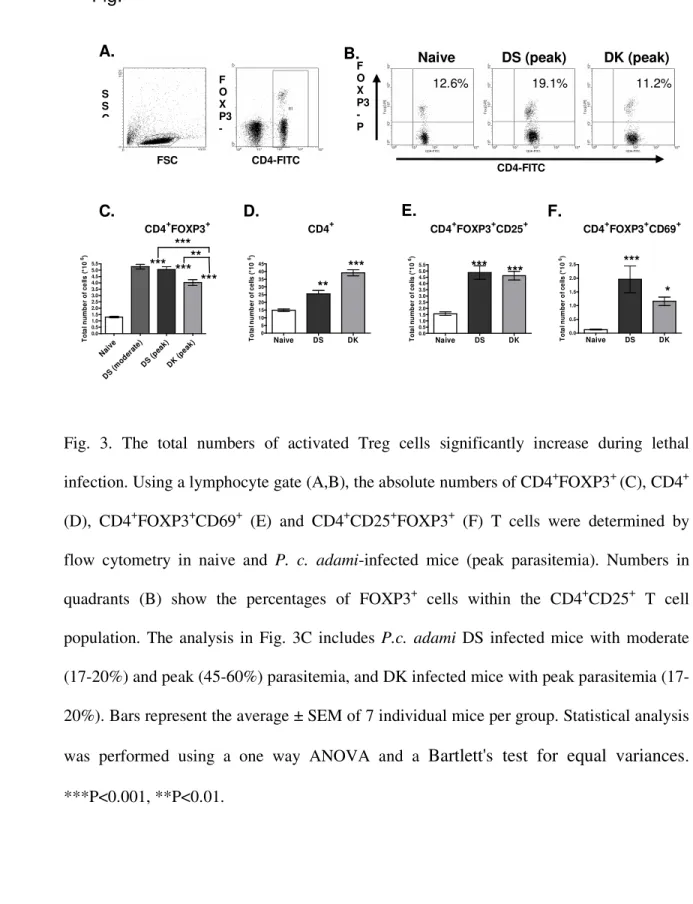
3 A, B). When compared to uninfected controls, higher absolute numbers of CD4+FOXP3+ 196
T cells were measured at peak infection with DS and DK parasites, and were shown to be in 197
particular enhanced during lethal infection at moderate parasitemia (17-21%) (Fig. 3 C). 198
The total number of CD4+T cells increased during infection and tend to be higher in DK-199
infected mice (Fig. 3D), in correlation with the enhanced splenomegaly observed during 200
non-lethal infection. A significant expansion of CD25+CD4+FOXP3+ T cells was measured 201
during lethal and non-lethal infection (Fig. 3E), and the total numbers of CD69+ 202
CD4+FOXP3+cells were significantly higher in mice infected with lethal DS parasites (Fig 203
3F). 204
We assessed the effect of the PC61 Mab on the kinetics of infection with the DS and DK 205
strains. Two doses of antibody, administered a day prior to and a day after infection, 206
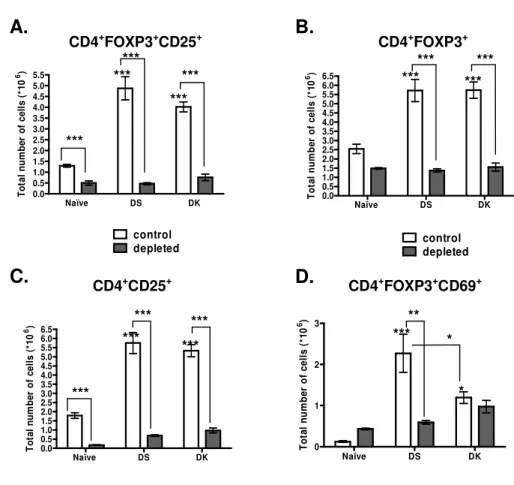
eliminated more than 80% of CD4+FOXP3+CD25+ cells in the infected mice and the effect
207
was shown to persist until resolution of non-lethal infection or until the attainment of peak 208
lethal infection (Fig. 4 A). Treatment with the depleting Mab led to a comparable and 209
significant decrease in the absolute numbers of CD4+FOXP3+ cells in infected mice (Fig. 210
4B). At the moment of peak infection (8 days following treatment), more than 70% of 211
CD4+FOXP3+ T cells were eliminated in infected mice, whereas a 30% reduction was 212
measured in uninfected animals. As expected, treatment with the anti-CD25 Mab resulted in 213
a significant drop in CD4+CD25+ T cell numbers in infected and naïve mice (Fig. 4C). A 214
significant drop (>79%) in the total numbers of CD69+ Treg cells was measured in mice 215
with lethal infection, whereas a marginal inhibitory effect was observed in DK-infected 216
mice (Fig 4D). 217
The depletion of CD25+ T cells did not abrogate the virulence associated with P. c. adami
218
DS infection. In a first experiment, higher parasite burden and enhanced distress (lethargy, 219
ruffled fur and hypothermia) became apparent from day 7 post-infection in the treated group 220
of mice. All the animals were sacrificed at day 8 post-infection due to severe morbidity, and 221
peak parasitemia was higher in the group of depleted mice the day of death (Fig. 5A). In a 222
second experiment, the parasite burden was higher in the group of depleted mice at day 7 223
post-infection when all these mice died, corresponding to a day earlier than the control 224
group (Fig. 5B). The differences in parasitemia at day 7 of infection with lethal DS parasites 225
were shown to be statistically significant between the treated and untreated groups (Fig. 226
5C). In contrast, infections with non-lethal DK parasites were characterized by a marginal 227
decrease in peak parasitemia in a first experiment (Fig. 5D) or remained unaffected by the 228
treatment in a second experiment (Fig 5E). 229
3.4 Pro-inflammatory responses are further enhanced in absence of Treg cells. 230
The expression of CD69, an early activation marker of T cells, NK cells, B cells and other 231
cells was compared in control and depleted infected mice. A significant increase in the 232
absolute numbers of CD4+FOXP3-CD69+ T cells was measured at peak infection with lethal
233
and non lethal parasites, and in absence of CD25+ T cells, this number further increased in 234
DK-infected mice, whereas a marginal drop occurred in DS-infected animals (Fig. 6A). As 235
expected, the treatment with the PC61 Mab led to a drop in the relatively low numbers of 236
CD4+ FOXP3-CD25+ T cells that increased during infection (Fig. 6B). The elimination of 237
CD25+T cells did not affect the absolute numbers of CD4-CD69+ lymphocytes, which 238
remained high and comparable at peak lethal and non-lethal infections (Fig. 6C). 239
As the PC61 Mab may deplete activated effector CD4+ T cells that transiently express the 240
CD25 receptor, CD4+ T cell effector responses (IL-2 and IFN-γ) to PRBC and anti-CD3 241
stimulation were compared in control and depleted mice at peak infection. In absence of 242
CD25+ T cells, parasite-specific IL-2 responses significantly increased in mice with non-243
lethal infection, whereas they remained unchanged in DS-infected mice (Fig 7A). Interleukin-244
2 production in response to stimulation with the anti-CD3 Mab marginally increased in mice 245
depleted of CD25+ cells, and this treatment did not restore the impaired IL-2 response in 246
infected mice (Fig. 7B). Interestingly, elimination of CD25+ cells resulted in a dramatic 247
increase in IFN-γ production by CD4+ T cells from mice with lethal infection (Fig 7C). In 248
general, IFN-γ responses to TCR stimulation with the anti-CD3 Mab were significantly 249
enhanced in all the experimental groups in absence of CD25+ cells (Fig. 7D). Theses results 250
contrasted with those measured when eliminating CD25+ cells within the population of 251
purified CD4+T cells by magnetic sorting, which resulted in a significant decrease of both IL-252
2 and IFN-γ responses (data not shown). 253
As pro-inflammatory cytokines are responsible for malaria disease (Clark et al, 2006), TNF-α, 254
IFN-γ as well as anti-inflammatory IL-10 responses were compared in control and CD25-255
depleted mice. CD90- lymphocytes and CD4+ T cells were purified from infected mice at peak 256
infection and were cultured for 72h without further stimulation. In mice with virulent 257
infection, the treatment with the PC61 antibody resulted in enhanced production of TNF-α 258
and IFN-γ by CD90- cells from DS-infected mice (Fig. 8 A, B), and a comparable effect was 259
observed for TNF-α in cells from naïve mice (Fig. 8A). Low levels of IL-10 were detected in 260
CD90- cell cultures from infected mice, and were significantly enhanced in infected mice by 261
the depletion (Fig 8C). IFN-γ production by CD4+ T cells significantly increased in naïve and 262
in infected mice (Fig. 8D), and surprisingly IL-10 responses by CD4+T cells were low (0-40 263
pg/ml) and remained comparable in treated and untreated mice (data not shown). 264
3.5. Severe anaemia is generated during lethal infection and is enhanced in absence of 265
Treg cells. 266
A final objective in our study concerned the characterization of anaemia in mice depleted of 267
Treg cells, as it is partially consequent to the inhibitory effects of inflammatory cytokines on 268
erythropoiesis (Clark et al., 2006). Indeed severe anaemia was a hallmark of infection with 269
lethal parasites and hemoglobin values in DS-infected mice drop below 80 mg/ml at days 7 270
and 8 post-infection (Fig. 9A), contrasting with the moderate anaemia during non-lethal DK 271
infection (Fig. 9B). The depletion of CD25+T cells accelerated the onset of severe anaemia
272
during lethal malaria, which became apparent at day 6 post-infection (Fig 9A). This treatment 273
also significantly reduced blood hemoglobin at peak infection with non-lethal DK parasites 274
(Fig. 9B), but the levels of anaemia remained moderate. 275
276
4.Discussion. 277
In the present study we show that the population of natural Treg cells significantly expands 278
during lethal P. c. adami DS infections and in this malaria infection model, T reg cells 279
contribute to the down-regulation of the severe inflammatory response, but fail to protect the 280
mice from the development of lethal anaemia and death. 281
Regulatory T cells participate in the attenuation of overwhelming inflammatory responses 282
during infections with Protozoa and Helminths (Belkaid et al., 2006). In BALB/c mice, 283
resistant to P. berghei ANKA cerebral disease, the expansion of Treg cells has been shown to 284
correlate with the control of pathogenic TH1 responses (Nie et al., 2007). In contrast, 285
detrimental effects have been associated with Treg cells in susceptible C57BL/6 mice, for 286
which the in vivo elimination of T reg cells prevents the development of cerebral disease and 287
leads to an important reduction of parasite load in the vasculature and brain. Interestingly, 288
although the inflammatory response (up regulation of vascular adhesion molecules, the 289
recruitment of leukocytes to the brain and the production of TNF-α and IL-6) is not modified 290
in C57BL/6 mice deprived of Treg cells prior to infection, a significant drop in the 291
recruitment of pathogenic CD8+ T cells to the brain is measured (Amante et al., 2007). 292
Our data indicates an enhanced inflammatory response during lethal P. c. adami DS infection 293
which is accompanied by a significant increase in the number of activated Treg cells, and 294
their elimination results in exacerbated inflammation, anaemia and blood parasite burden. Our 295
results with e P.c. adami infections, as well as those described during P. berghei ANKA and 296
P. yoelii infections reveal contrasting roles for T reg cells in different malaria models. Indeed,
297
the detrimental versus beneficial functions attributed to Treg cells during malaria may depend 298
on the pathology associated with the parasite species and strain (cerebral disease versus 299
anaemia), the MHC haplotype and genetic background of the host as well as on the timing 300
and magnitude of the counter-inflammatory responses induced. Malaria infections are 301
characterized by systemic inflammation which is responsible for disease in humans and in 302
experimental hosts (Clark et al., 2006; Schofield and Grau, 2005). As suggested by numerous 303
studies in mice, an early inflammatory response is essential for the control of parasite 304
multiplication (Stevenson et al., 1995; Mohan et al., 1997; Mitchell et al., 2005). However, 305
excessive inflammation is also a major contributor to the cerebral pathology and haemolytic 306
anaemia (Kurtzhals et al., 1998; Othoro et al., 1999), and thus, counter regulatory 307
mechanisms are required for its control. In this context, the ability to survive P. berghei K173 308
or P. c. chabaudi AS infection correlates with the timing and magnitude of TGF-β production 309
and its inhibitory effect on TNF-α release by immune cells (Omer et al., 1998; Omer et al., 310
2003). Interleukin-10 also plays a protective role in experimental models of cerebral malaria 311
(Kossodo et al., 1997), and has been shown to be essential for the control of inflammation 312
during P. chabaudi infection (Linke et al., 1996). 313
In contrast to the results described for the virulent P. yoelii 17XL infection model (Hisaeda et 314
al., 2004) we failed to detect inhibitory activities associated to Treg cells which could account 315
for P.c. adami DS virulence. Secretion of IL-2 by CD4+T cells in response to PRBC was in 316
particular enhanced during lethal DS infection and interestingly, independent of the infection, 317
IL-2 production in response to stimulation with anti-CD3 Mab was severely impaired in 318
CD4+T cells. This scenario remained unchanged in the absence of Treg cells, albeit the fact 319
that specific IL-2 responses to PRBC were significantly restored in CD4+ T cells from DK-320
infected mice. In contrast, robust parasite-specific IFN-γ responses were measured in by 321
CD4+ T cells DS and DK-infected animals, indicating comparable TH1 effector responses. It 322
is possible that the failure to produce IL-2 during infection may be consequent to a state of 323
exhaustion in T cells. A comparable phenomenon has been described in chronic HIV and SIV 324
infections, in which CD8+ T cells expressing the program cell death receptor PD-1 (a negative 325
regulator of activated T cells), exhibit an “exhausted” phenotype, failing to produce IL-2 and 326
to proliferate (Day et al., 2006, Petrova et al., 2007). 327
The depletion of Treg cells had a major positive impact on the production of pro-328
inflammatory cytokines during lethal DS infection. Significantly higher TNF-α and IFN-γ 329
responses were induced in cells other than T cells, and IFN-γ production by CD4+ T cells
330
was further stimulated in vivo and in vitro in absence of CD25+ T cells. Indeed, the 331
expansion and activation of Treg cells could represent a counter-regulatory response to the 332
exacerbated inflammation during lethal infection. Parasitemia becomes higher only at late 333
DS infection whereas the total numbers of Treg cells have significantly expanded when the 334
mice have moderate parasite burdens. Interleukin-10 production was significantly induced 335
during lethal infection, as measured in splenic cell culture supernatants. The levels of this 336
regulatory cytokine were relatively low in CD90- cell culture supernatants from infected 337
mice, and were greatly enhanced in absence of Treg cells during infection. It is tempting to 338
suggest that CD8+ T cells and not CD4+ T cells may represent an important source of IL-10 339
during P.c. adami DS infection, as moderate levels of this cytokine (300-500 pg/ml) were 340
detected in purified T cell cultures (data not shown). In early studies, CD8+ T cells have 341
been involved in the down regulation of lymphoproliferative responses to native or 342
recombinant malaria antigens (Riley et al., 1989; Mshana et al., 1990; Riley et al., 1993) 343
and these cells are an important source of TGF-β during blood stage infection (Omer et al., 344
2003). The discrepancies between our results with total splenic cells, CD90- and CD4+ cell 345
cultures suggests that other cells besides CD4+ T cells and CD90- lymphocytes are 346
responsible for the high IL-10 response measured during lethal infection. 347
An obvious detrimental effect consequent to the depletion of Treg cells was the 348
exacerbation of severe anaemia, which may explain the enhanced morbidity observed in 349
DS-infected mice prior to attainment of peak parasitemia. Our results also illustrate the 350
striking incapacity of the enhanced inflammatory response to control parasite 351
multiplication, which was further enhanced during lethal infection. In addition, our data 352
strongly suggests that the IL-10 response induced during lethal DS infection is not sufficient 353
to control the inflammation and pathology generated. 354
An alternative hypothesis for the contrasting effect of Treg cell depletion in P. yoelii 355
17XL and P. c. adami DS infections may rely on the nature of the protective responses 356
required to control parasite burden. During P. yoelii 17XNL infections Treg cells could 357
exert their detrimental effects by suppressing B cell-dependent antibody production, which 358
has been shown to be essential for the control of P. yoelii parasites (Roberts and Weidanz 359
1979). In a study developed by Lim et al (2005) a direct suppressive effect of natural Treg 360
cells on B cells was suggested. Eddahri et al. (2006) proposed an indirect mechanism of 361
action mediated by the suppression of the T helper cell activity required to generate 362
antibodies and blocked by TGF-β neutralizing antibodies. 363
That additional factors may participate in Plasmodium virulence has been underlined by 364
several studies such as the one developed by Fakey and Spitalny (1987) in which the lethality 365
of P. yoelii YM parasites was associated with rapid parasite growth and the consequent 366
failure of the immune system to cope in time with the infection. In line with this assumption, 367
independent studies by Falanga and da Silva (1989) and Yap and Stevenson (1994) have 368
demonstrated the rescue of P. chabaudi infected mice by blood transfusion, which allowed 369
the development of protective immunity. Indeed, a rapid parasite multiplication rate, the 370
anaemia resulting from the destruction of parasitized red blood cells by the parasite as well as 371
from the inhibitory effects that inflammatory cytokines have on erythropoiesis, may all 372
contribute to malaria lethality. 373
We remain cautious in respect to the nature of the population of FOXP3+ cells expanding 374
during P.c. adami infection, as in humans transient expression of FOXP3+ has been described 375
in activated T cells, which also adopt suppressive phenotypes (Walker et al., 2003; Pillai et 376
al., 2007). Indeed, significantly marked T cell activation, measured as increased numbers of 377
CD4+FOXP3-CD25+ T cells was observed during lethal infection, correlating with the
378
absolute numbers of CD4+FOXP3+CD69+ T cells. Thus, the possibility that activated mouse
379
effector T cells express FOXP3 to transiently down-regulate exacerbated effector responses 380
cannot be excluded. 381
Future work will focus on the identification of the parasite factors responsible for the 382
uncontrolled inflammation during lethal DS infections. A delicate balance is required to cope 383
with rapid parasite multiplication rates, which is initially under the control of the pro-384
inflammatory environment relying on phagocytes and NK cells (Urban et al., 2005). Indeed a 385
complex pattern of interactions participate in the pathology associated with Plasmodium 386
infections, and dissecting the factors and mechanisms involved remains an important and 387
challenging task for the scientific community addressing malaria. 388
389
Acknowledgements. 390
This work was supported by the Natural Sciences and Engineering Research Council of Canada 391
and Le Programme d’aide à la Recherche PAFARC. M. Cambos is recipient of a FARE 392
scholarship. The study was conducted in compliance with the regulations from the Animal 393
Committee of the University of Quebec in Montreal (protocol 0705-R1-508-0706). 394
References. 395
396
Amante, F.H., Stanley, A.C., Randall, L.M., Zhou, Y., Haque, A., McSweeney, K., Waters, 397
A.P., Janse, C.J., Good, M.F., Hill, G.R., Engwerda, C.R. 2007. A role for Natural Regulatory 398
T cells in the pathogenesis of experimental cerebral malaria. A. J. Pathol. 171. Uncorrected 399
version published on June 28, 2007 as DOI:10.2353/ajpath.2007.061033. 400
Belkaid, Y., Sun, C. M., Bouladoux, N. 2006. Parasites and immunoregulatory T cells. Curr. 401
Opin. Immunol. 18, 406-412. 402
Clark, I.A., Budd, A.C., Alleva L.M., Cowden W.B. 2006. Human malarial disease: a 403
consequence of inflammatory cytokine release. Malar. J. 5, 85 (online). 404
Day, C.L., Kaufmann, D.E., Kiepiela, P., Brown, J.A.,Moodley, E.S., Reddy, S., Mackey, 405
E.W., Miller, J.D., Leslie, A.J., DePierres, C., Mucube, Z., Duraiswamy, J., Zhu, B., 406
Eichbaum, Q., Altfeld, M., Wherry, E.J., Coovadia, HÉMÉ, Goulder, P.J., Klenerman, P., 407
Ahmed, R., Freeman, G.J., Walker, B.D. 2006. PD-1 expression on HIV-specific T cells is 408
associated with T-cell exhaustion and disease progression. Nature 443, 350-354. 409
Demengeot, J., Zelenay, S., Moraes-Fontes, M. F., Caramalho, I., Coutinho, A. 2006. 410
Regulatory T cells in microbial infection. Springer Semin. Immunopathol. 28, 41-50. 411
Eddahri, F., Oldenhove, G., Denanglaire, S., Urbain, J., Leo, O., Andris, F. 2006. CD4+ 412
CD25+ regulatory T cells control the magnitude of T-dependent humoral immune responses 413
to exogenous antigens. Eur. J. Immunol. 36, 855-863. 414
Fakey, J. R. and Spitalny, G. L. 1987. Rapid multiplication rate, rather than 415
immunosuppression, causes the death of mice infected with lethal Plasmodium yoelii. Infect. 416
Immun. 55, 490-493. 417
Falanga, P. B. and Pereira da Silva, L. 1989. Acute lethal infection with Plasmodium 418
chabaudi does not impair the generation of a protective immune response. Parasite Immunol. 419
11, 603-613. 420
Fontenot, J.D., Rasmussen, J.P., Williams, L.M., Dolley, J.L., Farr, A.G., Rudenski, A.Y. 421
2005. Regulatory T cell lineage specification by the forkhead transcription factor foxp3. 422
Immunity. 22, 329-341. 423
Hisaeda, H., Maekawa, Y., Iwakawa, D., Okada, H., Himeno, K., Kishihara, K., Tsukumo, S., 424
Yasutomo, K. 2004. Escape of malaria parasites from host immunity requires CD4+ CD25+ 425
regulatory T cells. Nat. Med. 10, 29-30. 426
Khattri, R., Cox, T., Yasayko, S. A., Ramsdell, F. 2003. An essential role for Scurfin in 427
CD4+CD25+ Tregulatory cells. Nat. Immunol. 4, 337-342. 428
Kossodo, S., Monso, C., Juillard, P., Velu, T., Goldman, M., Grau, G.E. 1997. 429
Interleukin-10 modulates susceptibility in experimental cerebral malaria. Immunology 91, 430
536-540. 431
Kurtzhals, J.A.L., Adabayari, V., Goka, B.Q., Akanmori, B.D., Commey, J.O., Nkrumah, 432
N.F., Behr, C., Hviid L. 1998. Low concentrations of Interleukin 10 in severe malarial 433
anaemia compared with cerebral and uncomplicated malaria. Lancet. 351, 1768-1772. 434
Lim, H. W., Hillsamer, P., Banham, A. H., Kim, C. H. 2005. Cutting edge: direct suppression 435
of B cells by CD4+ CD25+ regulatory T cells. J. Immunol.175, 4180-4183. 436
Linke, A., Kuhn, R., Muller, W., Honarvar, N., Li, C., Langhorne, J. 1996. Plasmodium 437
chabaudi chabaudi: differential susceptibility of gene-targeted mice deficient in IL-10 to an 438
erythrocytic-stage infection. Exp. Parasitol. 84, 253-263. 439
Long, T.T.A., Nakazawa, S., Onizuka, S., Huaman, M.C., Kanbara, H. 2003. Influence of 440
CD4+CD25+T cells on Plasmodium berghei NK65 infection in BALB/c mice. Int. J. 441
Parasitol. 33, 175-183. 442
Mitchell, A.J., Hansen, A.M., Hee, L., Ball, H.J., Potter, S.M., Walker, J.C., Hunt, N.H. 2005. 443
Early cytokine production is associated with protection from murine cerebral malaria. Infec. 444
Immun. 73, 5645-5653. 445
Mohan, K., Moulin, P., Stevenson, M.M. 1997. Natural killer cell cytokine production, not 446
cytotoxicity, contributes to resistance against blood-stage Plasmodium chabaudi AS infection. 447
J. Immunol. 159, 4990-4998. 448
Mshana, R.N., McLean, S., Boulandi, J. 1990. In vitro cell-mediated immune responses to 449
Plasmodium falciparum schizont antigens in adults from a malaria endemic area: CD8+ T 450
lymphocytes inhibit the response of low responder individuals. Int Immunol. 2, 1121-1132. 451
Nie, C.Q., Bernard, N.J., Schofield, L., Hansen, D.S. 2007. CD4+ CD25+ regulatory T cells 452
suppress CD4+ T-cell function and inhibit the development of Plasmodium berghei-specific 453
TH1 responses involved in cerebral malaria pathogenesis. Infec. Immun. 75, 2275-2288. 454
Omer, F.M. and Riley, E.M. 1998. Transforming growth factor beta production is inversely 455
correlated with severity of murine malaria infection J. Exp. Med. 188, 39-48. 456
Omer, F.M., de Souza, J.B., Riley E.M. 2003. Differential induction of TGF-beta regulates 457
proinflammatory cytokine production and determines the outcome of lethal and nonlethal 458
Plasmodium yoelii infections. J. Immunol. 171, 5430-5436. 459
Othoro, C., Lal, A., Nahlen, B., Koech, D., Orago, A., Udhayakumar V. 1999. A low 460
interleukin 10 tumor necrosis factor-a ratio is associated with malaria anemia in children 461
residing in a holoendemic malaria region in western Kenya. J. Infec. Dis. 179, 279-282. 462
Petrovas, C., Price, D.A., Mattapalli, J., Ambrozak, D.R., Geldmacher, C., Cecchinato, V., 463
Vaccari, M., Tryniszewska, E., Gostick, E., Roeder, M., Douek, D.C., Morgan, S.H., Davis, 464
S.J., Franchini, G. Koup, R.A. 2007. SIV-specific CD8+T-cells express high levels of PD1 465
and cytokines but have impaired proliferative capacity in acute and chronic SIVmac251 466
infection. Blood. [Epub ahead of print]. 467
Pillai V., Ortega S.B., Wang, C.K., Karandikar, N.J. 2007. Transient regulatory T cells: a 468
state attained by all activated human T cells. Clin. Immunol. 123, 18-29. 469
Raghavan S. and Holmgren J. 2005. CD4+CD25+ suppressor T cells regulate pathogen 470
induced inflammation and disease. FEMS Immunol. Med. Microbiol. 44, 121-127. 471
Riley, E.M., Jobe, O., Whittle, H.C. 1989. CD8+ T cells inhibit Plasmodium falciparum-472
induced lymphoproliferation and gamma interferon production in cell preparations from 473
some malaria-immune individuals. Infect Immun.; 57, 1281-1284. 474
Riley, E.M., Morris-Jones, S., Taylor-Robinson, A.W., Holder, A.A. 1993. 475
Lymphoproliferative responses to a merozoite surface antigen of Plasmodium falciparum: 476
preliminary evidence for seasonal activation of CD8+/HLA-DQ-restricted suppressor cells. 477
Clin Exp Immunol. 94, 64-67. 478
Roberts, D.W. and Weidanz, W.P.1979. T-cell immunity to malaria in the B-cell deficient 479
mouse. Am. J. Trop. Med. Hyg. 28, 1-3. 480
Schofield, L and Grau, G.E. 2005. Immunological processes in malaria pathogenesis. Nat. 481
Rev. Immun. 5, 722-735. 482
Schwartz, R. H. 2005. Natural regulatory T cells and self-tolerance. Nat. Immunol. 6, 483
327-330. 484
Scorza, T., Grubb, K., Smooker, P., Rainczuk, A., Proll, D., Spithill, T.W. Induction of 485
strain-transcending immunity against Plasmodium chabaudi adami malaria with a 486
multiepitope DNA vaccine. Infect. Immun. 73, 2974-85. 487
Stevenson, M.M., Tam, M.F., Wolf, S.F., Sher A.1995. IL-12 induced protection against 488
blood-stage Plasmodium chabaudi AS requires IFN-γ and TNF-α and occurs via a nitric 489
oxide-dependent mechanism. J. Immunol. 155, 2545-2556. 490
Suvas, S.C. and Rouse, V. T. 2006. Treg control of antimicrobial T cell responses. Curr 491
Opin Immunol. 28, 344-348. 492
Urban, B.C., Ing, R., Stevenson M.M. 2005. Early interactions between blood-stage 493
Plasmodium parasites and the immune system. Curr. Top. Microbiol. Immunol. 297, 25-70. 494
Vigario, A.M., Gorgette, O., Dujardin, H.C., Cruz, T., Cazenave, P.A., Six, A., Bandeira, 495
A., Pied, S. 2007. Regulatory CD4(+)CD25(+) Foxp3(+) T cells expand during 496
experimental Plasmodium infection but do not prevent cerebral malaria. Int. J. Parasitol. 497
[Epub ahead of print]. 498
Walker, M.R., Kasprowicz, D.J., Gersuk, V.H., Bernard, A., Van Landeghen, M., 499
Buckner, J.H., Ziegler, S.F. 2003. Induction of FoxP3 and acquisition of T regulatory 500
activity by stimulated human CD4+CD25- T cells.J. Clin. Invest. 112, 1437-1443. 501
Walther, M., Tongren, J. E., Andrews, L., Korbel, D., King, E., Fletcher, H., Andersen, R. 502
F., Bejob, P., Thompson, F., Dunachie, S.J., Edele, F., de Souza, J.B., Sinden, R.E., Gilbert, 503
S.C., Riley, E.M., Hill, A.V. 2005. Upregulation of TGF-beta, FOXP3, and CD4+CD25+ 504
regulatory T cells correlates with more rapid parasite growth in human malaria infection. 505
Immunity. 23, 287-296. 506
Yap, G. S. and Stevenson, M. M. 1994. Blood transfusion alters the course and outcome of 507
Plasmodium chabaudi AS infection in mice. Infect. Immun. 62, 3761-3765. 508
Legends to Figures. 509
510
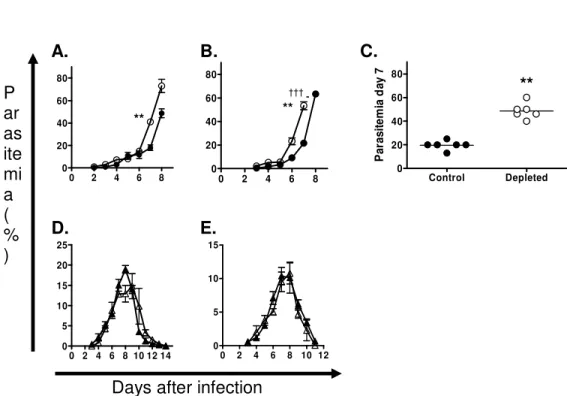
Fig. 1. The production of pro-inflammatory cytokines is enhanced during lethal P. c. adami 511
infection. A, Following intraperitoneal injection of 105 PRBC, P. c. adami DS infections 512
(
●
) develop steadily, attaining high parasitemia and 100% mortality when compared to513
infection with non-lethal DK parasites (▲) (n=5 mice per group). Seventy two hours 514
unstimulated splenic cells culture supernatants (4 x 10⁶ cells /ml) from naïve, P.c. adami 515
DS and DK-infected mice were assessed for IFN-γ (B), TNF-α (C) and IL-10 (D) content 516
(pg/ml), by ELISA. Bars represent the average ± SEM of 11 individual mice per group. 517
Statistical analysis was performed using a one way ANOVA and a
Bartlett's test for equal
518
variances
. ***P<0.001; **P<0.01, *P<0.05. 519 520***
*
**
***
***
***
***
***
*
A.
B.
D.
C.
Fig. 1
0 2 4 6 8 10 12 14 0 10 20 30 40 50 60 DS DKDays after infection
% P a ra s it e m ia Naive DS DK 0 500 1000 1500 2000 IF N -γγγγ ( p g /m L ) Naive DS DK 0 10 20 30 40 50 60 70 80 90 100 110 120 130 140 T N F -αααα ( p g /m L ) Naive DS DK 0 100 200 300 400 500 600 700 800 900 1000 1100 IL -1 0 ( p g /m L )
521
Fig. 2. Parasite-specific TH1 effector cells are activated during infection, but fail to produce 522
IL-2 in response to anti-CD3 stimulation. CD4+ T cells from naïve and infected mice (peak 523
infection) were purified by negative selection, and were stimulated (5 x10⁵ cells /well) for 524
24h (IL-2) or 72h (IFN-γ) with homologous PRBC (60,000) or with anti-CD3 Mab (4 525
µg/ml), in the presence of syngeneic naïve peritoneal macrophages (2x 10⁴ cells /well). 526
Interleukin-2 (A,B) and IFN-γ (C, D) levels were measured in 24 and 72h culture 527
supernatants from unstimulated and stimulated CD4+T cells. Bars represent the average ± 528
SEM of 6 individual mice per group. Statistical analysis was performed using a one way 529
ANOVA and a
Bartlett's test for equal variances
. ***P<0.001; **P<0.01, *P<0.05. 530 531 532 Naive DS DK 0 10 20 30 40 50 60 70 80 IL -2 ( p g /m L ) Naive DS DK 0 100 200 300 400 500 600 700 800 900 1000 1100 1200 1300 1400 IL -2 ( p g /m L ) Naive DS DK 0 250 500 750 1000 1250 1500 1750 IF N -γγγγ ( p g /m L ) Naive DS DK 0 250 500 750 1000 1250 1500 1750 IF N -γγγγ ( p g /m L ) PRBC - + - + - +PRBC - + - + - +
α-CD3 - + - + - +
α-CD3 - + - + - +
*** ** *** *** * *** ***
A.
B.
D.
C.
Fig.
2
***533
534
Fig. 3. The total numbers of activated Treg cells significantly increase during lethal 535
infection. Using a lymphocyte gate (A,B), the absolute numbers of CD4+FOXP3+ (C), CD4+ 536
(D), CD4+FOXP3+CD69+ (E) and CD4+CD25+FOXP3+ (F) T cells were determined by 537
flow cytometry in naive and P. c. adami-infected mice (peak parasitemia). Numbers in 538
quadrants (B) show the percentages of FOXP3+ cells within the CD4+CD25+ T cell 539
population. The analysis in Fig. 3C includes P.c. adami DS infected mice with moderate 540
20%) and peak (45-60%) parasitemia, and DK infected mice with peak parasitemia (17-541
20%). Bars represent the average ± SEM of 7 individual mice per group. Statistical analysis 542
was performed using a one way ANOVA and a
Bartlett's test for equal variances
. 543 ***P<0.001, **P<0.01. 544 545 546 Nai ve DS (mod erat e) DS (pea k) DK (pea k) 0.0 0.5 1.0 1.5 2.0 2.5 3.0 3.5 4.0 4.5 5.0 5.5 T o ta l n u m b e r o f c e ll s ( *1 0 6) Naive DS DK 0 5 10 15 20 25 30 35 40 45 T o ta l n u m b e r o f c e ll s ( *1 0 6) Naive DS DK 0.0 0.5 1.0 1.5 2.0 2.5 3.0 3.5 4.0 4.5 5.0 5.5 T o ta l n u m b e r o f c e ll s ( *1 0 6) Naive DS DK 0.0 0.5 1.0 1.5 2.0 2.5 T o ta l n u m b e r o f c e ll s ( *1 0 6) CD4+FOXP3+Naive DS (peak) DK (peak)
12.6% 19.1% 11.2% F O X P3 -P CD4-FITC B. S S C F O X P3 -CD4-FITC FSC A. C. D. E. F. *** *** *** ** ** *** CD4+ CD4+FOXP3+CD25+ *** *** * CD4+FOXP3+CD69+ ***
Fig.
3
***547
Fig. 4. Treatment with the PC61 Mab significantly eliminates the total numbers of activated 548
Treg cells in naïve and infected mice. Groups of 7 mice received 500µg of anti-mouse 549
CD25 monoclonal by intraperitoneal injection a day prior to and a day after infection. The 550
absolute numbers of CD4+FOXP3+CD25+ (A), CD4+FOXP3+ (B), CD4+CD25+ (C) and 551
CD4+FOXP3+CD69+ (D) cells were determined at peak infection by flow cytometry, using 552
a gate on lymphocytes. Bars represent the average ± SEM of 7 individual mice per group. 553
Statistical analysis was performed using a one way ANOVA and a
Bartlett's test for equal
554
variances
. ***P<0.001, **P<0.01. 555 556 557 558 Naïve DS DK 0.0 0.5 1.0 1.5 2.0 2.5 3.0 3.5 4.0 4.5 5.0 5.5 control depleted T o ta l n u m b e r o f c e ll s ( *1 0 6) Naïve DS DK 0.0 0.5 1.0 1.5 2.0 2.5 3.0 3.5 4.0 4.5 5.0 5.5 6.0 6.5 control depleted T o ta l n u m b e r o f c e ll s ( *1 0 6) Naïve DS DK 0.0 0.5 1.0 1.5 2.0 2.5 3.0 3.5 4.0 4.5 5.0 5.5 6.0 6.5 T o ta l n u m b e r o f c e ll s ( *1 0 6) Naïve DS DK 0 1 2 3 T o ta l n u m b e r o f c e ll s ( *1 0 6) *** *** *** *** *** *** CD4+FOXP3+CD25+ CD4+FOXP3+ CD4+CD25+ *** *** *** *** *** *** *** *** * ** CD4+FOXP3+CD69+ *A.
B.
D.
C.
***Fig.
4
559
Fig. 5. Depletion of Treg cells exacerbates the parasite burden in mice with P. c. adami DS 560
infection. Mice received 500µg of anti-mouse CD25 monoclonal by intraperitoneal 561
injection a day prior to and a day after infection. Parasitemia (% PRBC ±SEM) was 562
followed daily starting from day 3 post-infection until the moment of peak parasite burden 563
(DS), or until resolution of infection (DK). The progression of parasitemia in P. c. adami 564
DS (
●
; A, B) and DK (▲; D, E) infected control (closed symbols) and depleted (opened 565symbols) mice was compared. C. Peak parasitemia values at day 7 post-infection in mice 566
from experiments A and B were grouped for analysis using a non-parametric Mann 567
Whitney test. Three mice were included per group in all 4 experiments. **P<0.01. 568 0 2 4 6 8 0 20 40 60 80 0 2 4 6 8 0 20 40 60 80 Control Depleted 0 20 40 60 80 P a ra s it e m ia d a y 7 0 2 4 6 8 10 12 14 0 5 10 15 20 25 0 2 4 6 8 10 12 0 5 10 15
Days after infection P ar as ite mi a ( % ) A. B. E. D. C. ** ** ** †††
Fig.
5
569
Fig. 6. In vivo administration of the PC61 Mab decreases the total numbers of activated 570
CD4+FOXP3- T cells but does not affect the numbers of activated CD4- lymphocytes during 571
infection. Absolute numbers of CD4+FOXP3-CD69+ (A), CD4+FOXP3-CD25+ (B) and 572
CD4-CD69+ (C) lymphocytes in control mice and in mice depleted of Treg cells prior to 573
infection. Bars represent the average ± SEM of 10 individual mice per group. Statistical 574
analysis was performed using a one way ANOVA and a
Bartlett's test for equal
575
variances
. ***P<0.001, **P<0.01, *P<0.05. 576 577 578 579 580 Naïve DS DK 0 5 10 15 20 25 control depleted T o ta l n u m b e r o f c e ll s ( *1 0 6) Naïve DS DK 0.0 0.1 0.2 0.3 0.4 0.5 0.6 0.7 0.8 0.9 1.0 1.1 control depleted T o ta l n u m b e r o f c e ll s ( *1 0 6) Naïve DS DK 0 5 10 15 20 25 30 35 40 45 control depleted T o ta l n u m b e r o f c e ll s ( *1 0 6) CD4+FOXP3-CD69+ CD4+FOXP3-CD25+ CD4-CD69+ A. B. C. *** *** *** *** *** * *** *** *** *** Fig.6582
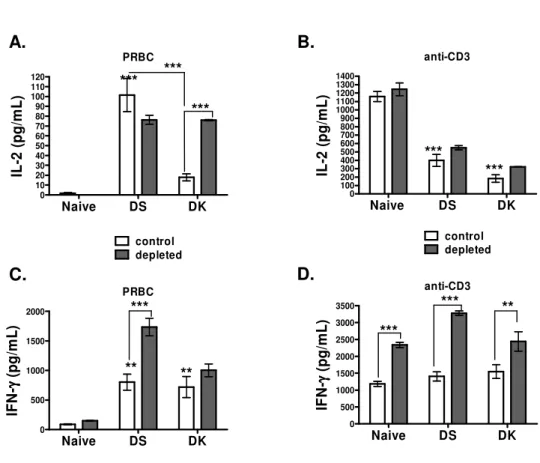
Fig. 7. Parasite specific IL-2 and IFN-γ responses by CD4+ T cells are restored in absence 583
of Treg cells. Seventy-two hours culture supernatants of CD4+ T cell from naïve, P.c. adami 584
DS and DK-infected mice (5 x10⁵ cells/well) and naïve syngeneic macrophages (2x10⁴ 585
cells/well) were assessed for IL-2 (A, B) and IFN-γ (C, D) content (pg/ml) following 586
stimulation with 60,000 homologous PRBC (A,C) or anti-CD3 Mab (4ug/ml) (B,D) by 587
ELISA. Bars represent the average ± SEM of 6 individual mice per group. Statistical 588
analysis was performed using a one way ANOVA and a
Bartlett's test for equal
589
variances
. ***P<0.001, **P<0.01. 590 591 592 593 PRBC Naive DS DK 0 10 20 30 40 50 60 70 80 90 100 110 120 control depleted IL -2 ( p g /m L ) anti-CD3 Naive DS DK 0 100 200 300 400 500 600 700 800 900 1000 1100 1200 1300 1400 control depleted IL -2 ( p g /m L ) PRBC Naive DS DK 0 500 1000 1500 2000 IF N -γγγγ ( p g /m L ) anti-CD3 Naive DS DK 0 500 1000 1500 2000 2500 3000 3500 IF N -γγγγ ( p g /m L ) *** *** *** *** ** ** *** *** *** ** A. B. D. C.Fig.
7
***594
Fig. 8. The production of pro-inflammatory TNF-α and IFN-γ is enhanced in absence of 595
Treg cells. Concentrations of TNF-α (A), IFN-γ (B,D) and IL-10 (C) in 72h cultures of 596
CD90- lymphocytes (A-C) or CD4+ T cells (D) from untreated (open bars) and Treg cell 597
depleted (closed bars) naive and P. c. adami infected mice (peak infection). Similar 598
concentrations of cells (4x10⁶ cells/ml) were assessed for the CD90- and CD4+ populations. 599
Bars represent the average ± SEM of 7 individual mice per group. Statistical analysis was 600
performed using a one way ANOVA and a
Bartlett's test for equal variances
. 601 *** P<0.001; **P<0.01; *P<0.05. 602 603 604 CD90 -Naive DS DK 0 100 200 300 400 500 600 700 800 control depleted T N F -αααα ( p g /m L ) CD90 -Naive DS DK 0 100 200 300 400 500 600 700 800 900 1000 1100 1200 1300 1400 control depleted IF N -γγγγ ( p g /m L ) CD90 -Naive DS DK 0 250 500 750 1000 IL -1 0 ( p g /m L ) CD4+ Naive DS DK 0 50 100 150 200 250 300 350 400 450 500 550 IF N -γγγγ ( p g /m L ) *** * *** *** * *** *** ** *** * *** **A.
B.
D.
C.
Fig. 8
*606
Fig.9. Anaemia is exacerbated in absence of Treg cells. The concentration of hemoglobin in 607
blood (mg/ml) was compared in control (closed symbols) and CD25-depleted (opened 608
symbols) mice during P.c. adami DS (
●
, A) and DK (▲, B) infection. Hemoglobin609
measurements with the Drabkin’s reagent were taken immediately before administration of 610
105 PRBC, and every 2 days until attainment of peak parasite burden. Seven mice were 611
included per group. Concentrations of hemoglobin inferior to 80 mg/ml (dotted lines) were 612
considered indicatives of severe anaemia. Statistical analysis was performed using a one 613
way ANOVA and a