Pépite | Influence de la microstructure sur les propriétés mécaniques et les mécanismes d’endommagement d’alliages Al-Si-Cu étudiés via des analyses in-situ 2D et 3D
202
0
0
Texte intégral
(2) Thèse de Zaidao Li, Lille 1, 2016. © 2016 Tous droits réservés.. lilliad.univ-lille.fr.
(3) Thèse de Zaidao Li, Lille 1, 2016. REMERCIEMENTS Cette thèse a été réalisée aux Laboratoire de Mécanique de Lille (LML) ER3 et Unité Matériaux et Transformations (UMET), j'aimerais donc remercier leurs directeurs respectifs, Eric Charkaluk et Alexandre Legris, de m'avoir accueilli dans leur laboratoire. J'aimerais également remercier le financement de China Scholarship Council (CSC) et le support de projet INDiANA qui m'ont permis de bénéficier d'excellentes conditions de travail et d'une liberté très appréciable dans mes travaux. Je voudrais remercier les membres du Jury de m’avoir accordé de leur temps à la lecture, à la critique et à l'amélioration de mon travail. Je tiens à exprimer toute ma gratitude à Henri Nguyen Thi pour l'honneur qu'il m'a fait de présider mon jury, ainsi qu'à Jean-Yves Buffière et Luc Salvo d'avoir accepté de rapporter ce travail et d’avoir eu leurs regards d'experts sur mes travaux. Je tiens aussi à remercier Pierre Osmond pour avoir examiné et suivi ce travail, le tout avec beaucoup de gentillesse. Je tiens à remercier chaleureusement mon directeur de thèse David Balloy, Professeur à l’Université Lille 1, pour la confiance qu’il m’a accordée en acceptant d'encadrer ce travail doctoral, sa disponibilité, ses précieux conseils et son soutien. Durant ces 38 mois de thèse, son aide a été précieuse pour mes recherches, mes études et ma vie en France. Je remercie mon encadrante Nathalie Limodin, chargée de recherche au CNRS, pour ses précieux conseils tout au long de ce projet, et tout particulièrement pour son soutien et sa disponibilité durant la rédaction de cette thèse. Mes plus sincères remerciements vont également à mes encadrants Amina Tandjaoui et Philippe Quaegebeur, Maître de Conférences à l’Ecole Centrale de Lille, pour m'avoir fait confiance en m'attribuant ce travail de recherche et pour m'avoir laissé suffisamment de liberté lors de ces travaux tout en me donnant des conseils très enrichissants. Je tiens à remercier plus spécialement Nora Dahdah, pour son accompagnement et son aide pendant ces trois années en France. Sans sa gentillesse, ma thèse aurait été différente et ma vie en France n’aurait pas été si agréable. Je remercie vivement tous les membres du LML et UMET, plus particulièrement : Ahmed El Bartali (essai de traction), Katia Biotteau (MEB), Olivier Lagache (OM), Jean-Francois Witz (corrélations 2D et 3D), François Lesaffre (usinage des éprouvettes), Franck Béclin (MEB), Fabienne Delepaut, Brigitte Warocquier, Valerie Sulis (secrétariat), Gregory Hauss (ISIS4D), Long Wang, Jerome Hosdez, Zhifan Jiang, ainsi que tous mes collègues et amis pour les divers services qu’ils m’ont rendu dans les domaines scientifiques, techniques et administratifs. Cela m’a ainsi permis l’aboutissement de ce projet et ce dans un environnement de travail des plus agréables. J’en profite également pour remercier l’ensemble des thésards pour leur aide et leur contribution à cette bonne ambiance dans le laboratoire. Enfin, ces dernières lignes sont destinées à mes parents, à toute ma famille et à mes amis que je voudrais remercier pour m’avoir soutenu et encouragé. Je vous suis très reconnaissant d’avoir toujours été là pour moi.. © 2016 Tous droits réservés.. lilliad.univ-lille.fr.
(4) Thèse de Zaidao Li, Lille 1, 2016. © 2016 Tous droits réservés.. lilliad.univ-lille.fr.
(5) Thèse de Zaidao Li, Lille 1, 2016. Contents. Contents................................................................................................................................................... II List of Figures ...................................................................................................................................... VII List of Tables........................................................................................................................................ XV Introduction ......................................................................................................................................... 1 1. Chapter 1 Literature review ......................................................................................................... 5 1.1. Aluminium-silicon alloys .................................................................................................... 5. 1.1.1. Al-Si-Cu alloy system ................................................................................................. 6. 1.1.2. Recycled aluminium alloy ........................................................................................... 7. 1.2. Solidification of Al-Si-Cu alloy .......................................................................................... 7. 1.2.1. Reactions during the solidification of Al-Si alloy ....................................................... 7. 1.2.2. Effect of solidification rate .......................................................................................... 8. 1.2.3. Die Casting and Lost-Foam Casting.......................................................................... 11. 1.3. Modification of the eutectic silicon ................................................................................... 13. 1.3.1. Effect of strontium (Sr) modification ........................................................................ 14. 1.3.2. Effect of Cooling Rate on Modification .................................................................... 15. 1.3.3. Effect of solution heat treatment on modification ..................................................... 15. 1.4. Intermetallics ..................................................................................................................... 17. 1.4.1. The -Al2Cu Phase .................................................................................................... 17. 1.4.2. The β-Al5FeSi Iron Intermetallics ............................................................................. 19. 1.4.3. The α-Al15(Fe,Mn)3Si2 Iron Intermetallics ................................................................ 21. 1.5. Porosity.............................................................................................................................. 22. 1.6. Mechanical properties and damage mechanisms of Al-Si alloy........................................ 25. 1.6.1. Mechanical properties ............................................................................................... 25. 1.6.2. Damage mechanisms of Al-Si alloy .......................................................................... 28. 1.7. 1.6.2.1. Influence of porosity.............................................................................................. 29. 1.6.2.2. Influence of hard inclusions .................................................................................. 30. Summary of literature review ............................................................................................ 33 I. © 2016 Tous droits réservés.. lilliad.univ-lille.fr.
(6) Thèse de Zaidao Li, Lille 1, 2016. 2. Chapter 2 experimental part ...................................................................................................... 38 2.1. Introduction ....................................................................................................................... 39. 2.2. Alloy preparation and heat treatment test .......................................................................... 41. 2.2.1. DC alloy .................................................................................................................... 41. 2.2.2. LFC alloy................................................................................................................... 42. 2.3. Thermal analysis................................................................................................................ 43. 2.4. Specimens preparation and selection................................................................................. 44. 2.4.1. DC alloy .................................................................................................................... 44. 2.4.1.1. Preparation of specimens for 2D/3D characterization ........................................... 44. 2.4.1.2. Preparation of specimens for 2D in-situ tensile test .............................................. 45. 2.4.1.2.1 Extraction of specimens .................................................................................. 45 2.4.1.2.2 Polishing and OM observation ........................................................................ 46 2.4.1.2.3 Etching (Pattern making) ................................................................................. 46 2.4.2. LFC alloy................................................................................................................... 47. 2.4.2.1. Preparation of specimens for 2D/3D characterization ........................................... 47. 2.4.2.2. Preparation of specimens for 3D in-situ tensile test .............................................. 47. 2.4.2.2.1 Extraction of specimens .................................................................................. 48 2.4.2.2.2 X-ray tomography observation (low resolution) ............................................. 49 2.4.2.2.3 FEM simulation for selection ROI .................................................................. 49 2.4.2.2.4 Polishing .......................................................................................................... 50 2.5. Microstructure Characterization ........................................................................................ 50. 2.5.1. Characterization technologies ................................................................................... 50. 2.5.1.1. Optical microscope observation ............................................................................ 50. 2.5.1.2. Scanning electron microscopy – Energy Dispersive X-ray analysis ..................... 51. 2.5.1.3. X-ray tomography observation .............................................................................. 52. 2.5.1.3.1 X-ray tomography principle ............................................................................ 52 2.5.1.3.2 X-ray tomography experiments ....................................................................... 52 2.5.2 2.6. Image processing and analysis .................................................................................. 54. Mechanical testing ............................................................................................................. 55. 2.6.1. Vickers hardness Test ................................................................................................ 55. 2.6.2. Tensile test ................................................................................................................. 56. 2.6.2.1. Conventional tensile test........................................................................................ 56 II. © 2016 Tous droits réservés.. lilliad.univ-lille.fr.
(7) Thèse de Zaidao Li, Lille 1, 2016. 2.6.2.2. 2D in-situ tensile tests for DC alloy ...................................................................... 56. 2.6.2.3. 3D in-situ tensile tests for LFC alloy..................................................................... 57. 2.6.3 2.6.3.1. YaDICs software ................................................................................................... 59. 2.6.3.2. Measurement uncertainty ...................................................................................... 61. 2.6.4 3. Field measurements ................................................................................................... 59. Fractographic examination/ Postmortem analyses .................................................... 63. Chapter 3 The influence of Sr, Fe and Mn content and casting process on the microstructure. and solidification parameters of Al–Si based alloys ......................................................................... 64 3.1. Introduction ....................................................................................................................... 64. 3.2. Results ............................................................................................................................... 65. 3.2.1. Microstructure examination....................................................................................... 65. 3.2.1.1. Secondary Dendrite Arm Spacing (SDAS) analysis ............................................. 65. 3.2.1.2. Porosity characterization ....................................................................................... 66. 3.2.1.3. Eutectic Si characterization ................................................................................... 70. 3.2.1.3.1 The effect of Sr content ................................................................................... 70 3.2.1.3.2 The effect of cooling rate ................................................................................ 72 3.2.1.4. Intermetallic compounds ....................................................................................... 72. 3.2.1.5. Copper based phase ............................................................................................... 76. 3.2.2. 3.3. 3.2.2.1. Solidification Reaction and Sequence of the Al-Si-Cu alloy ................................ 77. 3.2.2.2. Effect of strontium on Al–Si eutectic reaction ...................................................... 80. 3.2.2.3. Effect of iron and manganese on the formation of intermetallic compounds ........ 81. Discussion ......................................................................................................................... 82. 3.3.1. Phase formation in Al–Si–Cu alloy ........................................................................... 82. 3.3.2. The effect of Sr addition ............................................................................................ 83. 3.3.3. The effect of Fe and Mn content ............................................................................... 84. 3.3.4. The effect of casting process ..................................................................................... 85. 3.4 4. Thermal analysis........................................................................................................ 77. Conclusions ....................................................................................................................... 87. Chapter 4 The influence of Sr, Fe and Mn content and casting process on the mechanical. properties and damage mechanisms of Al–Si based alloys ............................................................... 89 4.1. Introduction ....................................................................................................................... 89. 4.2. Mechanical properties ....................................................................................................... 90 III. © 2016 Tous droits réservés.. lilliad.univ-lille.fr.
(8) Thèse de Zaidao Li, Lille 1, 2016. 4.2.1. Hardness test.............................................................................................................. 90. 4.2.2. Conventional Tensile test .......................................................................................... 91. 4.3. The effect of Sr ...................................................................................................... 91. 4.1.1.2. The effect of Fe and Mn ........................................................................................ 91. 4.1.1.3. The effect of casting process ................................................................................. 92. Tensile damage mechanisms ............................................................................................. 93. 4.3.1. DIC measurements .................................................................................................... 94. 4.3.2. Fracture surface analysis ........................................................................................... 97. 4.3.3. Discussion ............................................................................................................... 102. 4.4. 5. 4.1.1.1. Conclusions ..................................................................................................................... 105. 4.4.1. Conventional mechanical properties ....................................................................... 105. 4.4.2. Experimental protocol of 2D in-situ tensile test with DIC ...................................... 105. 4.4.3. Damage mechanisms ............................................................................................... 106. Chapter 5 Effect of heat treatment on the microstructure and damage mechanisms in LFC Al-. Si-Cu alloy....................................................................................................................................... 107 5.1. Introduction ..................................................................................................................... 108. 5.2. Selection of ROI .............................................................................................................. 108. 5.3. Microstructure characterization ....................................................................................... 110. 5.3.1. Eutectic Si characterization ..................................................................................... 111. 5.3.2. Al2Cu phase ............................................................................................................. 112. 5.3.3. Iron-intermetallic ..................................................................................................... 117. 5.3.4. Porosity characterization in ROI ............................................................................. 118. 5.4. Tensile tests with 3D in-situ observation ........................................................................ 120. 5.4.1. Specimen HT1a ....................................................................................................... 121. 5.4.1.1. Crack 1 ................................................................................................................ 125. 5.4.1.2. Crack 2 ................................................................................................................ 127. 5.4.2. Specimen HT2 ......................................................................................................... 128. 5.4.2.1. Crack 1 ................................................................................................................ 131. 5.4.2.2. Crack 2 ................................................................................................................ 132. 5.4.2.3. Crack 3 ................................................................................................................ 133. 5.4.3. Specimen HT1b ....................................................................................................... 134 IV. © 2016 Tous droits réservés.. lilliad.univ-lille.fr.
(9) Thèse de Zaidao Li, Lille 1, 2016. 5.5. Quantitative analysis ....................................................................................................... 136. 5.6. Discussion ....................................................................................................................... 138. 5.6.1 5.6.1.1. Al2Cu ................................................................................................................... 138. 5.6.1.2. Fe-intermetallics .................................................................................................. 139. 5.6.1.3. Pores .................................................................................................................... 140. 5.6.1.4. Si particles ........................................................................................................... 140. 5.6.2. Damage mechanisms (3D tensile damage mechanisms) ......................................... 141. 5.6.2.1. Crack initiation .................................................................................................... 142. 5.6.2.2. Crack growth and final fracture ........................................................................... 144. 5.6.3 5.7. 6. The effect of heat treatment on the microstructure .................................................. 138. Strain measurements and crack formation............................................................... 147. Summary ......................................................................................................................... 147. 5.7.1. Experimental protocol ............................................................................................. 148. 5.7.2. Influence of heat treatment ...................................................................................... 148. 5.7.3. Damage mechanisms ............................................................................................... 149. Chapter 6 Elaboration for control the defects distributions in lost wax casting Al-Si-Cu alloy 150 6.1. Introduction ..................................................................................................................... 150. 6.2. Implementation of a furnace with temperature control system ....................................... 153. 6.3. Fabrication of plaster molds ............................................................................................ 154. 6.3.1. Realization of the Specimen in Wax ....................................................................... 154. 6.3.2. Realization of the Specimen in Resin ...................................................................... 156. 6.3.3. Realization of plaster mold ...................................................................................... 157. 6.4. Casting process (Experiment procedure) ......................................................................... 158. 6.4.1. Melt preparation ...................................................................................................... 158. 6.4.2. Mold and heating collar preheating ......................................................................... 160. 6.4.3. Pouring .................................................................................................................... 160. 6.4.4. Casting with controlled temperature........................................................................ 160. 6.5. Casting results and discussion ......................................................................................... 160. 6.5.1. The role of heating collar ........................................................................................ 161. V © 2016 Tous droits réservés.. lilliad.univ-lille.fr.
(10) Thèse de Zaidao Li, Lille 1, 2016. 6.5.2. Scenario A: Natural cooling .................................................................................... 161. 6.5.3. Scenario B: Gradient temperature cooling 1 (∆T=60°C) ........................................ 163. 6.5.4. Scenario C: Gradient temperature cooling 2 (∆T=100°C) ...................................... 164. 6.6. Summary ......................................................................................................................... 166. 6.7. Future development ......................................................................................................... 166. Conclusions and future work............................................................................................................... 167 References ........................................................................................................................................... 173. VI © 2016 Tous droits réservés.. lilliad.univ-lille.fr.
(11) Thèse de Zaidao Li, Lille 1, 2016. List of Figures. Figure 0-1: Cylinder head and temperature field in the fire deck (PSA data) ......................................... 1 Figure 1-1: Commercial cast aluminium-silicon alloys. (a) Al-Si equilibrium diagram. (b) Microstructure of hypoeutectic alloy. (c) Microstructure of eutectic alloy. (d) Microstructure of hypereutectic alloy (Warmuzek 2004) .................................................................................................... 6 Figure 1-2: Microstructure of AlSi7Cu2 alloy solidified with rate (a) 0.16 °Cs-1; (b) 0.46 °Cs-1; (c) 0.72 °Cs-1 (Dobrzański, Maniara et al. 2007) .......................................................................................... 9 Figure 1-3: SDAS as a function of cooling rate for A356 alloy (Shabani and Mazahery 2011) ............. 9 Figure 1-4: Illustration of the 10 g micro-Vickers hardness of the Al-dendrites at various cooling rates, i.e. SDAS, for Al–9%Si alloys (Seifeddine, Johansson et al. 2008) ..................................................... 10 Figure 1-5: The effect of cooling rate on the porosity levels of A356 alloys (Emadi and Gruzleski 1995) ............................................................................................................................................................... 11 Figure 1-6: Illustration of gravity die casting (Niane and Michalet 2011) ............................................ 12 Figure 1-7: Illustration of lost foam casting (Niane and Michalet 2011) .............................................. 12 Figure 1-8: Microstructure of A356 issued with (a) LFC process, DAS: 85μm; (b) traditional DC process, DAS: 35μm (Tabibian, Charkaluk et al. 2010)........................................................................ 13 Figure 1-9: Comparison of the silicon morphology in (a) unmodified, (b) Sr-modified (300 ppm Sr), hypoeutectic aluminium–silicon alloys (Dahle, Nogita et al. 2005) ..................................................... 15 Figure 1-10: The change in the silicon phase morphology with growth velocity. (a) Completely flake structure grown at 308 µm/s, (b) mixed form of flake and fibrous structure grown at 505 µm/s, (c) completely fibrous structure grown at 807 µm/s (Khan and Elliott 1996) ............................................ 15 Figure 1-11: Schematic representations of three stages of eutectic Si particle development during solution heat treatment in the case of (a) unmodified and (b) modified Al-Si alloy (Paray and Gruzleski 1994) ..................................................................................................................................... 16 Figure 1-12: Typical microstructures of Unmodified A356.2 alloy as a function of solution time (solution temperature = 540°C) (500X). (a) 50 min (b) 400 min (c) 1600 min (Shivkumar, Ricci et al. 1990)...................................................................................................................................................... 16 Figure 1-13: Optical micrographs showing (a) β-AI5FeSi, (b) α-Al15(Fe,Mn)3Si2, and (c) sludge iron intermetallics (arrowed) (Backerud, Chai et al. 1990) .......................................................................... 17 Figure 1-14: (a) Eutectic Al2Cu and (b) blocky Al2Cu (Li, Samuel et al. 2003) .................................. 18 Figure 1-15: 3-D perspective views of copper-bearing phase in the material shown as the Cu concentration contour (Toda, Nishimura et al. 2010) ............................................................................ 19 Figure 1-16: 3D networks of β-Al5FeSi platelets obtained from reconstructed serial sections and shown in three orientations (a, b and c) (Dinnis, Taylor et al. 2005) ............................................................... 20. VII © 2016 Tous droits réservés.. lilliad.univ-lille.fr.
(12) Thèse de Zaidao Li, Lille 1, 2016. Figure 1-17: Schematic illustration of the mechanism of β-Al5FeSi phase fragmentation and dissolution (Narayanan, Samuel et al. 1995) ......................................................................................... 21 Figure 1-18: Three-dimensional reconstruction of an α-Al15(Fe,Mn)3Si2 particle, shown in three orientations (a, b and c) (Dinnis, Taylor et al. 2005)............................................................................. 22 Figure 1-19: A shrinkage pore and a gas pore merged together to form a single pore in an AI-9 wt. % Si-3 wt. % Cu alloy (Roy, Samuel et al. 1996) ..................................................................................... 23 Figure 1-20: Evolution of the hydrogen content with different degassing time and techniques for an AlSi9Cu3 alloy (Puga, Barbosa et al.)................................................................................................... 24 Figure 1-21: Tensile properties of six Al-Si-Cu alloys (T5 condition) as a function of DAS: (a) UTS, (b) YS, (c) %El (Li, Samuel et al. 2004) ............................................................................................... 25 Figure 1-22: Tensile properties (UTS, YS and EI %) of an Al-Si alloy as function of iron content under different cooling conditions (Seifeddine and Svensson 2013) .................................................... 27 Figure 1-23: (a) Variation in YS and UTS, (b) variation in El%, as a function of copper concentration in the aluminium matrix (Samuel 1998) ................................................................................................ 27 Figure 1-24: Tensile strength, yield strength and elongation rate as a function of volumetric porosity for two 380 aluminium alloys (Mugica, Tovio et al. 2004) .................................................................. 28 Figure 1-25: The correlations between the tensile properties and maximum pore area for samples obtained from 319.2 alloys (Ma, Samuel et al. 2008) ........................................................................... 28 Figure 1-26: Stress distribution on surface of a pore (z-axis parallel to loading direction) (Wicke, Luetje et al. 2016).................................................................................................................................. 30 Figure 1-27: SEM fractograph of an as-cast Al-Si-Cu alloy fractured tensile specimen (Bacaicoa, Dwivedi et al. 2016) .............................................................................................................................. 32 Figure 1-28: Reconstructed 2D X-ray tomography slice showing the initiation area under the surface at the corner of a pore after 2 cycles (Dezecot, Buffiere et al. 2016) ........................................................ 33 Figure 2-1: Flow chart summarizing the experiments performed on the studied alloys ....................... 40 Figure 2-2: Schematic view showing the casting mold and the distribution of micro-porosity (PSA) . 41 Figure 2-3: A schematic view of the thermal analysis setup ................................................................. 44 Figure 2-4: Scheme of specimen preparation for DC alloy ................................................................... 45 Figure 2-5: (a) Extraction of specimens from the middle of the round bars, (b) Geometry of extracted specimens (in mm) for tensile tests with 2D in-situ observation .......................................................... 45 Figure 2-6: OM images of the specimen surface (a) before and (b) after etching................................. 47 Figure 2-7: Workflow of 3D in-situ tensile test for LFC alloy ............................................................. 48 Figure 2-8: (a) Extraction of specimens from prototype cylinder heads (b) Geometry of extracted specimens (in mm) for tensile tests with 3D in-situ observation .......................................................... 48 Figure 2-9: Principle of tomography (Limodin, Buffière et al. 2013) ................................................... 52 Figure 2-10: View of ISIS4D tomograph showing the X-ray source, the rotating stage and the detector ............................................................................................................................................................... 53 VIII © 2016 Tous droits réservés.. lilliad.univ-lille.fr.
(13) Thèse de Zaidao Li, Lille 1, 2016. Figure 2-11: Typical indentation in the surface of LFC A319 alloy ..................................................... 55 Figure 2-12: (a) Schematic drawing of a tensile specimen including dimensions, and (b) photograph of sample showing the hole in the center of specimen and the Region Of Interest (ROI) for the DIC analysis. All dimensions are in mm. ...................................................................................................... 56 Figure 2-13: Experimental set-up with Questar microscope ................................................................. 57 Figure 2-14: In-situ 3D tensile test set-up at LML ................................................................................ 57 Figure 2-15: Zoom of the Quartz pipe ................................................................................................... 58 Figure 2-16: The basic registration components of YaDICs (Seghir, Witz et al.) image correlation platform at LML .................................................................................................................................... 60 Figure 2-17: Measurements uncertainties (Uz) ..................................................................................... 62 Figure 3-1: Optical microstructures of Alloy C in (a) DC and (b) LFC ................................................ 65 Figure 3-2: Optical micrographs of Alloy (a) A, (b) B, (c) C, (d) D showing the different SDAS in Die Casting. .................................................................................................................................................. 66 Figure 3-3 Frequency distribution of shrinkage cavity level according to the ASTM E155 standard in 30 specimens for alloys B, C and D ...................................................................................................... 67 Figure 3-4 3D rendering of pores for alloys (a) A, (b) B, (c) C and (d) D in DC, and (e) alloy C in LFC. (Dimension: Ø3.7mm×Height 3mm) .................................................................................................... 68 Figure 3-5: Size distribution of pores in number for alloy A and B in Die casting............................... 69 Figure 3-6: The distribution of pores as function of Feret diameter for DC and LFC alloys ................ 70 Figure 3-7: Optical micrographs of alloy A (a) and alloy B (b) in Die Casting; eutectic Si is the dark phase ...................................................................................................................................................... 71 Figure 3-8: Distributions of Feret diameter (a) and sphericity (b) of eutectic Si particles in alloys A, B, C and D.................................................................................................................................................. 71 Figure 3-9: Optical micrographs showing eutectic Si microstructure in (a) Die casting, (b) Lost foam casting for alloy C ................................................................................................................................. 72 Figure 3-10: Distributions of iron-intermetallics as functions of Feret diameter (a) and sphericity (b) in alloy B, C and D .................................................................................................................................... 74 Figure 3-11: BSE SEM micrographs showing the distribution of α-phase Al15 (Fe,Mn)3Si2 (green arrow), β-phase Al5FeSi (yellow arrow) and Al2Cu phase (blue arrow) in the (a) alloy B, (b) C and (c) D. Points of EDX microanalysis are labeled, and the results are available in Table 3-4 ...................... 75 Figure 3-12: Optical micrographs showing iron-intermetallics in (a) DC, (b) LFC for alloy C ........... 76 Figure 3-13: Distributions of Al2Cu as functions of Feret diameter (a) and sphericity (b) in DC and LFC for alloy C ..................................................................................................................................... 77 Figure 3-14: Solidification curve and its first derivative of A319 alloy C and optical micrograph after interrupted quenching at different temperatures: (a) 560°C, (b) 554°C, (c) 547°C, (d) 520°C, (e) 502°C and (f) full solidification........................................................................................................................ 78. IX © 2016 Tous droits réservés.. lilliad.univ-lille.fr.
(14) Thèse de Zaidao Li, Lille 1, 2016. Figure 3-15: BSE micrograph of the sample quenched at temperature (a) before peak 4 and immediately after (b) peak 4 and (c) peak 5 .......................................................................................... 79 Figure 3-16: (a) Cooling curves of alloys with different Sr content (i.e. alloy A, B and C) with (b) the magnification of area related to Al–Si eutectic formation .................................................................... 81 Figure 3-17: Temperature derivatives measured from the melts with different Fe/Mn addition. Microstructures of samples quenched at 560°C for (b) alloy C and (c) alloy D ................................... 82 Figure 3-18 Eutectic solidification in unmodified chill cast Al–Si alloys (Makhlouf and Guthy 2001). ............................................................................................................................................................... 86 Figure 4-1: Effect of Fe content on the mechanical properties of the DC AlSi7Cu3 alloys (YS: yield strength; UTS: ultimate tensile strength; El: elongation) ...................................................................... 92 Figure 4-2: (a, c, e) Displacement and (b, d, f) strain fields (in pixels, 1pixel=0.22µm) in the Region Of Interest along the loading direction at global strain (a, b) Ɛ=0.56%, (c, d) Ɛ=0.88% and (e, f) Ɛ=1.06% for specimen A. Loading was along the vertical direction and OM images of the microstructure in the unloaded state are superimposed ........................................................................................................... 94 Figure 4-3: Questar image of analysis area at the strain (a) Ɛ=0.88% and (b) Ɛ=1.06% for specimen A ............................................................................................................................................................... 95 Figure 4-4: (a, c, e) Displacement field and (b, d, f) strain field displacement field (in pixels, 1pixel=0.22µm) in the Region Of Interest along the loading direction at global strain (a, b) Ɛ=0.21%, (c, d) Ɛ=0.33% and (e, f) Ɛ=0.51% for specimen D. Loading was along the vertical direction and OM images of the microstructure in the unloaded state are superimposed .................................................. 96 Figure 4-5: Questar image of ROI at the strain (a) Ɛ=0.33% and (b) Ɛ=0.51% for specimen D ........... 97 Figure 4-6: SEM image of polished flat surfaces of the specimen after tension test (a) overall view, (b) magnified view as enclosed by red box in (a), and (c) the corresponding strain field (Ɛ=0.88%) computed from DIC............................................................................................................................... 98 Figure 4-7: (a), (b) BSE images of the fracture surface of specimen A and (c), (d) corresponding X-ray mapping images showing the distribution of hard inclusions (eutectic Si, iron-intermetallics, Al2Cu phases), (e) SE image of the fracture surface of specimen A showing the analysis area ...................... 99 Figure 4-8: (a) OM image in ROI of specimen D, and (b) the corresponding strain field (Ɛ=0.51%) computed from DIC, (c) BSE image of the fracture surface of specimen D ....................................... 100 Figure 4-9: (a), (b) BSE images of the fracture surface of specimen D and (c), (d) corresponding X-ray mapping images showing the distribution of hard inclusions (eutectic Si, iron-intermetallics, Al2Cu phases) ................................................................................................................................................. 101 Figure 4-10: Comparison of hard inclusions surface fraction between fracture and flat surfaces for specimens (a) A and (b) D ................................................................................................................... 102 Figure 5-1: (a) 3D rendering of pores with Avizo software for Specimen HT1a, (b) 3D volume mesh, (c) FE calculation with Abaqus software showing Ɛzz ....................................................................... 109. X © 2016 Tous droits réservés.. lilliad.univ-lille.fr.
(15) Thèse de Zaidao Li, Lille 1, 2016. Figure 5-2: (a) 3D rendering of pores with Avizo software for Specimen HT1b, (b) 3D volume mesh, (c) FE calculation with Abaqus software showing Ɛzz ....................................................................... 110 Figure 5-3: (a) 3D rendering of pores with Avizo software for Specimen HT2, (b) 3D volume mesh, (c) FE calculation with Abaqus software showing Ɛzz ............................................................................. 110 Figure 5-4: Microstructure of Al-Si-Cu alloy showing the morphology of Al-Si eutectic; (a) as-cast condition, (b) after solution treatment at 495°C for 2h30 and (c) after solution treatment at 495°C for 50 h ...................................................................................................................................................... 111 Figure 5-5: Distributions of (a) Feret diameter and (b) sphericity of eutectic Si particles in studied AlSi-Cu alloy in as-cast condition and for different solution treatment durations .................................. 111 Figure 5-6: 3D rendering of the Al2Cu phase, from top to bottom: all the particles and the largest particle in the same 2.1×2.1×2.4 mm3 region, particles having a Feret diameter between 12 to 30μm in a sub-volume (1×1×1 mm3) at: (a, c and e) as-cast condition and (b, d and f) after 2h30 at 495 °C for specimen HT1a .................................................................................................................................... 113 Figure 5-7: 3D rendering of the Al2Cu phase, from top to bottom: all the particles and the largest particle in the same 2.1×2.1×2.4 mm3 region, particles having a Feret diameter between 12 to 30μm in a sub-volume (1×1×1 mm3) at: (a, c and e) as-cast condition and (b, d and f) after 2h30 at 495 °C for specimen HT1b.................................................................................................................................... 114 Figure 5-8: 3D rendering of the Al2Cu phase, from top to bottom: all the particles and the largest particle in the same 2.1×2.1×2.4 mm3 region, particles having a Feret diameter between 12 to 30μm in a sub-volume (1×1×1 mm3) at: (a, c and e) as-cast condition and (b, d and f) after 50h at 495 °C for specimen HT2...................................................................................................................................... 115 Figure 5-9: Al2Cu phase dissolution in the studied specimens during solution heat treatment at 495°C as a function of solution treatment time .............................................................................................. 116 Figure 5-10: Distributions of Al2Cu phase as functions of Feret diameter and granulometry in as-cast and solution heat treated conditions for specimen HT1a, HT1b (solution heat treatment of 2h30) and HT2 (solution heat treatment of 50h) .................................................................................................. 117 Figure 5-11: 3D rendering of pores in the ROI for specimen (a) HT1a, (b) HT1b and (c) HT2. (Dimension: 2.1× 2.1×2.4 mm3) .......................................................................................................... 118 Figure 5-12: Size distributions of pores in the ROI of specimen HT1a, HT1b and HT2 .................... 119 Figure 5-13: Stress-strain curves deduced from DVC measurements for Specimens A and B and from a standard test performed on LFC A319 alloy .................................................................................... 121 Figure 5-14: 3D rendering of pores and fracture surface of specimen HT1a: the εzz strain calculated by DVC for different loading steps are superimposed on the fracture surface at: (a) 145MPa, (b) 158MPa and (c) 165MPa ................................................................................................................................... 122 Figure 5-15: (a), (b) BSE images of the fracture surface of specimen HT1a and (c), (d) corresponding X-ray mapping images showing the distribution of hard inclusions (eutectic Si, iron-intermetallics, Al2Cu phases); zone 1 and 2 are representative of the two main cracks initiation and growth zone .. 123 XI © 2016 Tous droits réservés.. lilliad.univ-lille.fr.
(16) Thèse de Zaidao Li, Lille 1, 2016. Figure 5-16: 3D rendering of pores and cracks (in black) with the fracture surface of Specimen HT1a; the εzz strain calculated by DVC at the step before final fracture (165MPa) is superimposed on the pores .................................................................................................................................................... 125 Figure 5-17: (a), (b) 3D rendering of pores (in translucent purple) and iron-intermetallics on which is superimposed the εzz strain calculated by DVC during the tensile test; 3D rendering of cracks (red) shown with (c) one slice of tomographic image and (d) 3D rendering of iron-intermetallics at the step before final fracture (165MPa) ............................................................................................................ 126 Figure 5-18: εzz strain superimposed on the (a) pores and (b) iron-intermetallics at 145MPa, and 3D rendering of cracks with (c) one slice and (d) microstructures in transparent..................................... 127 Figure 5-19: 3D rendering of pores on the fracture surface of specimen HT2, the ε zz strain calculated by DVC for different loading step, (a) 160MPa, (b) 177MPa, (c) 184MPa and (c) 187MPa, are superimposed on the fracture surface .................................................................................................. 128 Figure 5-20: (a), (b) BSE images of the fracture surface of specimen HT2 and (c), (d) corresponding X-ray mapping images showing the distribution of hard inclusions (eutectic Si, iron-intermetallics, Al2Cu phases); zone 1, 2 and 3 are representative of the three main cracks initiation and growth zone ............................................................................................................................................................. 129 Figure 5-21: 3D rendering of pores and cracks (in black) with the fracture surface of Specimen HT2, the εzz strain calculated by DVC at the step before final fracture (187MPa) is superimposed on the pores .................................................................................................................................................... 130 Figure 5-22: 3D rendering of the pore A and nearby Al2Cu phases on which are superimposed the εzz strain calculated by DVC at the different maximum applied stresses, (a) 145 MPa, (b) 177 MPa; 3D crack (in black) at the step before final fracture (187MPa) through the Al 2Cu phase, (c) with strain field, (d) in transparent ........................................................................................................................ 131 Figure 5-23: 3D cracks ( in black) and 3D rendering of the Al 2Cu phases on which are superimposed the εzz strain calculated by DVC at the different maximum applied stresses: (a) 160 MPa, (b) 177 MPa, (c) 184 MPa and (d) 187 MPa ............................................................................................................. 132 Figure 5-24: 3D rendering of (a) pore B close to (b) an iron-intermetallic on which was superimposed the εzz strain calculated by DVC at an applied stress of 150MPa. (c) 3D rendering of crack 3 (in red) with the pore B on which is superimposed the strain field before the final fracture. (d) One tomographic slice shows the location of iron-intermetallic................................................................. 133 Figure 5-25: 3D rendering of pores and fracture surface of specimen HT1b: the εzz strain calculated by DVC for last loading step before failure (186MPa) is superimposed on the (a) pores and (b) fracture surface ................................................................................................................................................. 134 Figure 5-26: (a) BSE images of the fracture surface of specimen HT1b and (b) corresponding X-ray mapping images showing the distribution of hard inclusions (eutectic Si, iron-intermetallics, Al2Cu phases); zone 1, 2 and 3 are representative of the three main cracks initiation and growth zone ....... 136. XII © 2016 Tous droits réservés.. lilliad.univ-lille.fr.
(17) Thèse de Zaidao Li, Lille 1, 2016. Figure 5-27: Comparison of DVC element size in the zz strain field with the size of the selected particles ............................................................................................................................................... 137 Figure 5-28: Evolution of the Von Mises’ equivalent strain value in the Al 2Cu particles before the fracture during the tensile test ............................................................................................................. 137 Figure 5-29: Evolution of the Von Mises’ equivalent strain value in the iron-intermetallic particles before the fracture during the tensile test ............................................................................................ 138 Figure 5-30: Tomographic images showing the effect of heat treatment at 495°C on the microstructures of specimen HT2: (a) 0 h, (b) 50 h ............................................................................ 140 Figure 5-31: (a) One slice (about 850 μm below the flat surface) shown with a 3D rendering of cracks (at last loading step before failure) and fracture surface of Specimen HT2, (b) strain field of this slice in the last loading step before failure .................................................................................................. 145 Figure 5-32: BSE image showing the micro-cracks in the failure zone of specimen HT1a................ 147 Figure 6-1: Schematic diagram of the casting system ......................................................................... 152 Figure 6-2: Simulation of the cooling curves for the top, bottom and middle resistances that should allow obtaining defects in the middle of the specimen ....................................................................... 152 Figure 6-3: Location of defects in VisualCast using the temperature gradient shown in Figure 6-2 .. 153 Figure 6-4: Experimental setup ........................................................................................................... 153 Figure 6-5: LabVIEW display for the temperature control ................................................................. 154 Figure 6-6: (a) Catia design and (b) dimensions of the wax model .................................................... 155 Figure 6-7: (a) Sample from 3D printing, (b) silicone mold and (c) Wax model ................................ 155 Figure 6-8: (a) Catia design and (b) dimensions of the resin model ................................................... 156 Figure 6-9: Stalactite 102 HD 3D printer ............................................................................................ 156 Figure 6-10: A photograph of the printed resin model ........................................................................ 157 Figure 6-11: Thermal cycle of mold in the furnace ............................................................................. 157 Figure 6-12: Schematic diagram of the alloy melting ......................................................................... 158 Figure 6-13: Porosity in the specimens at various degassing times with 1L/min argon (a) 0min; (b) 20min; (c) 35min ................................................................................................................................. 159 Figure 6-14: Ball float flowmeter ........................................................................................................ 159 Figure 6-15: The cast parts (a) without and (b) with heating collar ................................................... 161 Figure 6-16: Cooling curve of the three part of sample A................................................................... 162 Figure 6-17: (a) Casting sample A, (b) 3D rendering of pores in sample A and (b) tomographic image slice showing the pore distribution ...................................................................................................... 162 Figure 6-18: Comparison of (a) simulated and (b) measured temperature-time profile for sample B 163 Figure 6-19: (a) Casting sample B, (b) 3D rendering of pores in sample B and (b) tomographic image slice showing the pores distribution .................................................................................................... 164 Figure 6-20: Optical microscope image of the center of sample B ..................................................... 164 Figure 6-21: Comparison of (a) simulated and (b) measured temperature-time profile for sample C 165 XIII © 2016 Tous droits réservés.. lilliad.univ-lille.fr.
(18) Thèse de Zaidao Li, Lille 1, 2016. Figure 6-22: (a) Casting sample C, (b) 3D rendering of pores in sample C and (b) tomographic image slice showing the pores distribution .................................................................................................... 165. XIV © 2016 Tous droits réservés.. lilliad.univ-lille.fr.
(19) Thèse de Zaidao Li, Lille 1, 2016. List of Tables Table 0-1: LFC and DC casting process....................................................... Erreur ! Signet non défini. Table 1-1: Reactions occurring during solidification of some 319 alloys (Valtierra and Lacaze 2005) according to Backerud et al. (Backerud, Chai et al. 1990) and to Samuel et al. (Samuel, Samuel et al. 1996)............................................................................................................. Erreur ! Signet non défini. Table 1-2: Chemical composition of the alloys mentioned in Table 2-1 (wt. %)Erreur ! Signet non défini. Table 1-3: Some parameters affecting the microstructures of Al-Si alloy ... Erreur ! Signet non défini. Table 1-4: Effect of microstructures on the mechanical properties and damage mechanisms of Al-Si alloy .............................................................................................................. Erreur ! Signet non défini. Table 2-1: Chemical compositions of the experimental alloys (wt. %) ....... Erreur ! Signet non défini. Table 2-2: The heat treatment conditions used for the suitable specimens (wt. %)Erreur ! Signet non défini. Table 2-3: Microstructural constituents characterizations............................ Erreur ! Signet non défini. Table 2-4: Parameters used for image analysis by OM ................................ Erreur ! Signet non défini. Table 2-5: Parameter settings of Lab-CT ..................................................... Erreur ! Signet non défini. Table 2-6: Parameter settings for 3D in-situ tensile test .............................. Erreur ! Signet non défini. Table 2-7: The parameters for DIC/DVC analysis using YaDICs ............... Erreur ! Signet non défini. Table 3-1: SDAS values measured in the four alloys ................................... Erreur ! Signet non défini. Table 3-2: Porosity characteristics as a function of alloy composition and casting method ....... Erreur ! Signet non défini. Table 3-3: Maximum length and surface area fraction of iron-intermetallics for alloys B to D . Erreur ! Signet non défini. Table 3-4: EDX analysis of the intermetallic compounds in Figure 3-11 .... Erreur ! Signet non défini. Table 3-5: Parameters of Al2Cu phase in four alloys ................................... Erreur ! Signet non défini. Table 3-6: EDX analysis of the phases in Figure 3-15 ................................. Erreur ! Signet non défini. Table 3-7: Reactions occurring during solidification of studied Al-Si-Cu alloysErreur ! Signet non défini. Table 4-1: Vickers hardness, area fraction of iron-intermetallic and DAS measured from investigated alloys ............................................................................................................ Erreur ! Signet non défini. Table 4-2: Tensile properties of studied alloys ............................................ Erreur ! Signet non défini. Table 5-1: Silicon particle characteristics following different solution treatment conditions ..... Erreur ! Signet non défini.. XV © 2016 Tous droits réservés.. lilliad.univ-lille.fr.
(20) Thèse de Zaidao Li, Lille 1, 2016. Table 5-2: Volume fraction of Iron-intermetallic as a function of heat treatment timeErreur !. Signet. non défini. Table 5-3: Porosity characteristics as a function of heat treatment conditions.Erreur !. Signet. non. défini. Table 5-4: Results of in-situ tensile test ....................................................... Erreur ! Signet non défini. Table 5-5: Parameters of the pores on the fracture surface of specimen HT1aErreur !. Signet. non. Signet. non. Signet. non. défini. Table 5-6: Parameters of the pores on the fracture surface of specimen HT2Erreur ! défini. Table 5-7: Parameters of the pores in the analysis volume of specimen HT1bErreur ! défini. Table 5-8: Basic information on tensile tests ............................................... Erreur ! Signet non défini. Table 5-9: Quantitative analysis of Al2Cu phase in the studied specimens . Erreur ! Signet non défini. Table 5-10: Ratios of phase’s fraction on fracture surface and on sub-section/flat surface ........ Erreur ! Signet non défini.. XVI © 2016 Tous droits réservés.. lilliad.univ-lille.fr.
(21) Thèse de Zaidao Li, Lille 1, 2016. XVII © 2016 Tous droits réservés.. lilliad.univ-lille.fr.
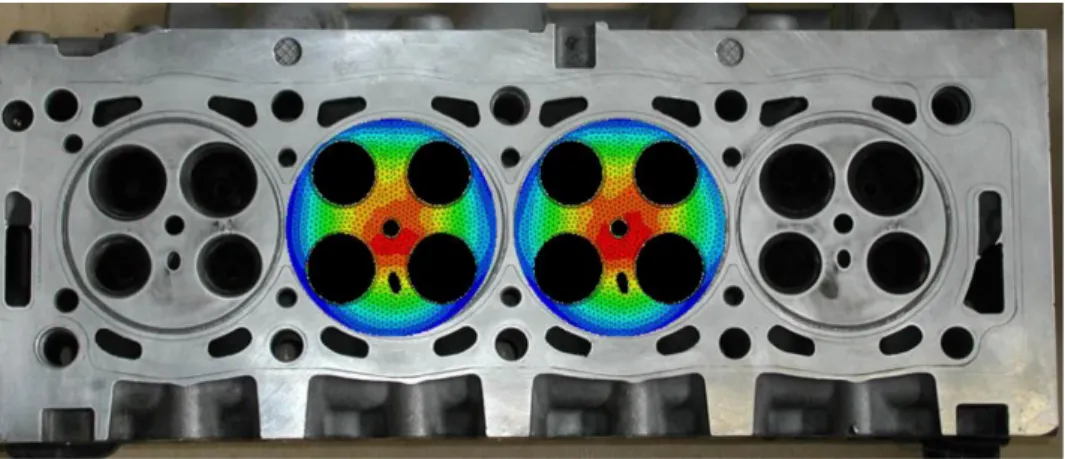
(22) Thèse de Zaidao Li, Lille 1, 2016. Introduction Contents Background ............................................................................................................................................. 1 Objectives ................................................................................................................................................ 3 Thesis structure ....................................................................................................................................... 4. Background Due to economic and environmental requirements, it is becoming increasingly important to reduce vehicle weight. For such an objective, aluminium casting alloys, particularly those belonging to the aluminium-silicon (Al-Si) system, are now extensively used in various automotive components such as wheels and cylinder heads because of their light weight in addition to a range of desirable engineering properties. These properties include high strength to weight ratio, good corrosion resistance, high electrical and thermal conductivity (Cobden and Banbury 1994), good machinability and excellent surface finishing (Gruzleski and Closset 1990). The cylinder head (Figure 0-1) which is made of an aluminium-silicon alloy (in this case an A319 alloy) locally experiences temperature cycles ranging from 20 to 300 °C (Thomas, Verger et al. 2004). In particular, the inter-valve zone in fire deck is the most critical area where temperature can reach the value of 300 °C during the engine operation. Therefore a high requirement for the mechanical properties of the material used for cylinder head had to be met in order to adapt to these working conditions.. Figure 0-1: Cylinder head and temperature field in the fire deck (PSA data). 1 © 2016 Tous droits réservés.. lilliad.univ-lille.fr.
(23) Thèse de Zaidao Li, Lille 1, 2016. Introduction The microstructure of Al-Si-Cu alloys can widely affect the mechanical properties, damage mechanisms and the fatigue failure. The various microstructural parameters to consider are the Secondary Dendrite Arm Spacing (SDAS), the eutectic Si particle size and morphology. Moreover, the amount and morphology of iron-intermetallics and Al2Cu phase observed in the microstructure are also to be considered. Microstructures of Al-Si-Cu alloys are largely influenced by the alloy composition, casting process and heat treatment condition. Some studies (Seifeddine and Svensson 2013) (Fabrizi, Ferraro et al. 2013) have already been performed in order to research the influence of alloying elements addition (i.e. Sr, Fe and Mn) on the microstructure and mechanical properties of these alloys. Silicon improves castability and reduces hot shortness in Al-Si-Cu alloy (Kaufman and Rooy 2004), it forms eutectic silicon phase with aluminium in Al-Si alloys. Mechanical properties of Al–Si alloys are influenced by the size and morphology of eutectic silicon particles (Sui, Wang et al. 2015). Hence, modification of the normally acicular, flake-like morphology of the eutectic Si to a fibrous form is usually carried out through the addition of certain elements (Na, K, Rb, Ce, Ca, Sr, Ba, La, Yb etc.) or with a rapid cooling rate (Hegde and Prabhu 2008). Iron is probably the most detrimental element and exists as a common impurity element in Al–Si alloys, especially in recycled aluminium alloy (Moustafa 2009). During solidification process, iron, together with other alloying elements (Cu, Mg, Zn, Mn, Ti, etc.) partly goes into solid solution in the matrix and partly forms Fe-rich intermetallic particles (Narayanan, Samuel et al. 1994). In Al-Si-Cu alloy, the most common iron-intermetallic is the platelet-like β-Al5FeSi. Due to its brittle nature, this phase can be quite deleterious to the alloy properties. Under conditions of high stress intensity factor, the β-platelets fracture or separate from the matrix, providing preferential crack paths ahead of the advancing crack, thereby lowering the impact properties of alloys (Ma, Samuel et al. 2014). In addition, high iron content was shown to have a significant effect on the formation of porosity in AlSi-Cu–based foundry alloys (Dinnis, Taylor et al. 2006). Mn additions are used to reduce the detrimental effects of the β phase by replacing it with the less-detrimental Chinese script αAl15(Fe,Mn)3Si2 phase (Narayanan, Samuel et al. 1994). Copper, as the main alloying element (~3.5 wt. %) in A319 casting alloy, forms an intermetallic phase with aluminium that precipitates during solidification either as block like Al 2Cu or in eutectic form as (Al+Al2Cu) (Li, Samuel et al. 2003), and can also affect the mechanical properties of A319 casting alloy (Li 2003). The casting process also can affect the microstructure and then the properties of alloys (Okayasu, Ohkura et al. 2012). For the purpose of geometry optimization, cost reduction and consumption control of automotive cylinder head, Gravity Die Casting (DC) process, as the conventional casting process, is progressively being replaced by the Lost Foam Casting (LFC) process. However, a major disadvantage of Lost Foam Casting is that a coarser microstructure is produced comparatively to Die 2 © 2016 Tous droits réservés.. lilliad.univ-lille.fr.
(24) Thèse de Zaidao Li, Lille 1, 2016. Introduction Casting processes at faster cooling rates (Table 0-1) (Tabibian 2011). This coarse microstructure, which consists of hard second phase particles (eutectic Si, Al2Cu phase, and iron-intermetallics), large pores and microshrinkage cavities, has a major influence on the fatigue properties (Tabibian, Charkaluk et al. 2010). In addition, heat treatment is usually performed to achieve an increase in strength through precipitation hardening for Al-Si-Cu alloys, and the effect of heat treatment on the mechanical properties in terms of hardness and tensile strengths is well studied, while the influence on plastic deformation behaviour and elongation to fracture is less studied (Mohamed and Samuel 2012). Mechanical properties and tensile behaviour are strongly influenced by microstructure. Thus the effect of various alloying elements additions, different casting methods and heat treatment conditions on microstructural changes and on the mechanical properties and damage mechanisms of Al-Si-Cu casting alloys should be further studied. Table 0-1: LFC and DC casting process Die casting. Lost foam casting. Equipment. Dies, metallic and sand molds. Polystyrene assembly. Geometry. -. Complex. Weight. -. - 1Kg. Price. -. - 15%. Solidification rate (°C/s). 30. 0.15-0.8. SDAS (µm). 35. 85. Objectives The aim of the present work was to study the influence of the microstructure on mechanical properties and damage mechanisms in Al-Si-Cu alloys by using 2D and 3D in-situ analysis. Firstly, metallurgical parameters controlling the microstructure of Al-Si-Cu alloy were studied. In order to achieve this, four alloys with different Sr, Fe, and Mn content were used. A full metallographic 2D and 3D characterization of the microstructure through optical- and Scanning Electron Microscopy (SEM) and laboratory X-ray tomography was performed in order to study the influence of variation in Sr, Fe, and Mn content within the composition tolerance of the AlSi7Cu3 alloy and of the casting process (i.e. DC and LFC) on the microstructure and solidification parameters. Then, mechanical tests (tensile test and hardness test) were performed on these four alloys to study the relationship between microstructure and mechanical properties. Secondly, 2D in-situ tensile test observations with Digital Image Correlation (DIC) were performed on two DC A319 alloys with different Fe/Mn content in order to study the effect of Fe-rich intermetallic on tensile damage 3 © 2016 Tous droits réservés.. lilliad.univ-lille.fr.
(25) Thèse de Zaidao Li, Lille 1, 2016. Introduction mechanisms in the A319 alloy. This method allows identifying the relation between damage mechanisms and casting microstructure on surface. Thirdly, the influence of heat treatment on the microstructure and damage mechanisms of Lost Foam Casting A319 alloy was studied. Two different heat treatments were carried out for the LFC A319 alloy which was extracted from one cylinder head. The evolution of microstructures was analysed using optical- and Scanning Electron Microscopy (SEM) and laboratory X-ray tomography. Then, 3D in-situ tensile observations with Digital Volume Correlation (DVC) were performed on the two alloys with different heat treatment. This method allows following the evolution of the cracks in volume and analysing the relation between the measured fields and damage behaviour. In addition, post-mortem analysis using Scanning Electron Microscopy (SEM) and Energy Dispersive X-ray (EDX) analysis was performed on these failed 2D/3D tensile specimens to give more details about the damage mechanisms. Besides, in order to study the relationship between the microstructure and damage mechanisms of as cast Al-Si-Cu alloy by in-situ fatigue test, a temperature gradient casting set-up will be implemented to realize normalized specimens with an equivalent microstructure as in fire deck area of cylinder heads while controlling the defects in the centre of specimen.. Thesis structure This thesis contains seven chapters. Chapter 1 is literature review, and Chapter 2 is experimental part. Chapter 3 is divided into two sections. First, the influence of different Sr, Fe, and Mn content and casting process on the microstructure of Al-Si-Cu alloys is presented. The second section studies the solidification sequences of Al-Si-Cu alloys by thermal analysis, and discusses the effect of Sr, Fe and Mn on the solidification parameters. The relationship between the different microstructures and the mechanical properties are first presented in Chapter 4. Then the effect of Fe-rich intermetallics on damage mechanisms on a micro scale level is discussed for two DC Al-Si-Cu alloys with different Fe contents. In Chapter 5, two heat treatment conditions were performed on specimens that were extracted from an A319 LFC cylinder head. A comparative study of 2D and 3D microstructural characteristics is performed on these alloys before and after the heat treatment. Lab-CT tomography was used to monitor in situ tensile tests on specimens in order to study the damage mechanisms of alloys in 3D, while the field measurements and post-mortem analysis are performed to give more information about the damage mechanisms. Chapter 6 introduces the experimental methods and the set-up for temperature gradient casting. Then, some results and prospects are given for future work. Finally, the principal conclusions of this study along with some suggestions for further investigation are presented in chapter 7. 4 © 2016 Tous droits réservés.. lilliad.univ-lille.fr.
(26) Thèse de Zaidao Li, Lille 1, 2016. 1 Chapter 1 Literature review Contents 1. Chapter 1 Literature review ............................................................................................................. 5 1.1. Aluminium-silicon alloys ........................................................................................................ 5. 1.1.1. Al-Si-Cu alloy system ..................................................................................................... 6. 1.1.2. Recycled aluminium alloy ............................................................................................... 7. 1.2. Solidification of Al-Si-Cu alloy .............................................................................................. 7. 1.2.1. Reactions during the solidification of Al-Si alloy ........................................................... 7. 1.2.2. Effect of solidification rate .............................................................................................. 8. 1.2.3. Die Casting and Lost-Foam Casting.............................................................................. 11. 1.3. Modification of the eutectic silicon ....................................................................................... 13. 1.3.1. Effect of strontium (Sr) modification ............................................................................ 14. 1.3.2. Effect of Cooling Rate on Modification ........................................................................ 15. 1.3.3. Effect of solution heat treatment on modification ......................................................... 15. 1.4. Intermetallics ......................................................................................................................... 17. 1.4.1. The -Al2Cu Phase ........................................................................................................ 17. 1.4.2. The β-Al5FeSi Iron Intermetallics ................................................................................. 19. 1.4.3. The α-Al15(Fe,Mn)3Si2 Iron Intermetallics .................................................................... 21. 1.5. Porosity.................................................................................................................................. 22. 1.6. Mechanical properties and damage mechanisms of Al-Si alloy............................................ 25. 1.6.1. Mechanical properties ................................................................................................... 25. 1.6.2. Damage mechanisms of Al-Si alloy .............................................................................. 28. 1.7. 1.1. Summary of literature review ................................................................................................ 33. Aluminium-silicon alloys. Aluminium-silicon alloys containing silicon as the major alloying element are the popular choice for the majority of aluminium castings because of their excellent castability, good corrosion resistance and machinability (Hielscher, Sternau et al. 2002). They constitute 85-90% of the total aluminium cast parts produced (Wang and Lu 2012). In standardized commercial cast aluminium-silicon alloys, the silicon content is usually in the range of 5 to 23 wt. % (Warmuzek 2004). Small amounts of Cu, Mg, Mn and Ni, etc. are usually being added to achieve strengthening of Al-Si alloys (Wang and Lu 2012). 5 © 2016 Tous droits réservés.. lilliad.univ-lille.fr.
Figure


+7


Documents relatifs