O
pen
A
rchive
T
oulouse
A
rchive
O
uverte (
OATAO
)
OATAO is an open access repository that collects the work of Toulouse researchers and makes it freely available over the web where possible.
This is an author-deposited version published in: http://oatao.univ-toulouse.fr/ Eprints ID: 5061
To link to this article:
http://dx.doi.org/10.1016/j.biortech.2011.03.111
To cite this version : Richard, Romain and Li, Ying and Dubreuil, Brigitte and Thiebaud-Roux, Sophie and Prat, Laurent E. On-line monitoring of the
transesterification reaction between triglycerides and ethanol using near infrared spectroscopy combined with gas chromatography (2011)
Bioresource Technology, vol. 102 (n° 12). pp. 6702-6709 . ISSN 0960-8524
On-line monitoring of the transesterification reaction between
triglycerides and ethanol using near infrared spectroscopy combined
with gas chromatography
Romain Richarda,b,c, Ying Lia,b, Brigitte Dubreuila,b, Sophie Thiebaud-Rouxa,b,*, Laurent
Pratc
a
Université de Toulouse; INPT; LCA (Laboratoire de Chimie Agro-Industrielle); ENSIACET, 4 allée Emile Monso, F-31030 Toulouse, France
b
INRA; LCA (Laboratoire de Chimie Agro-Industrielle); F-31030 Toulouse, France
c
Université de Toulouse; INPT ; CNRS; Laboratoire de Génie Chimique; UMR 5503; 4, allée Emile Monso, BP 44362, 31030 Toulouse cedex 4, France
* Corresponding author: Sophie Thiebaud-Roux
INPT-ENSIACET, Laboratoire de Chimie
Agro-industrielle, 4 allée Emile Monso, BP 44362, 31030 Toulouse cedex 4, France
E-mail: sophie.thiebaudroux@ensiacet.fr
Abstract
Many analytical procedures have been developed to determine the composition of reaction mixtures during transesterification of vegetable oils with alcohols. However, despite their accuracy, these methods are time consuming and cannot be easily used for on-line monitoring. In this work, a fast analytical method was developed to on-line monitor the transesterification reaction of high oleic sunflower oil with ethanol using Near InfraRed spectroscopy and a multivariate approach. The reactions were monitored through sequential scans of the reaction medium with a probe in a one-liter batch reactor without collecting and preparing samples. To calibrate the NIR analytical method, gas chromatography-flame ionization detection was used as a reference method. The method was validated by studying the kinetics of the EtONa-catalyzed transesterification reaction. Activation energy (51.0 kJ/mol) was also determined by considering a pseudo second order kinetics model.
Key words
1. Introduction
Due to the related increasing price and depletion of fossil fuels and the worldwide environmental concern about green house effect, alternative fuels for diesel engines have been widely studied during the last decades. Biodiesel, as a renewable alternative diesel fuel, can be derived from vegetable oils, animal fats, and waste cooking oils which contain triglycerides (Demirbas and Karslioglu, 2007; Encinar et al., 2007). It has the following advantages: technically feasible, environmentally acceptable, economically competitive and constantly available (Srivastava and Prasad, 2000). The most common method used to produce biodiesel is the transesterification, which refers to a chemical reaction between vegetable oil (triglycerides) and a short chain alcohol with a catalyst to produce fatty acid alkyl esters (biodiesel) and glycerol as a by-product. The overall process is normally a sequence of three consecutive steps, which are reversible reactions. In the first step, from triglycerides (TG), diglycerides (DG) are obtained; monoglycerides (MG) are then produced from diglycerides and in the last step, from monoglycerides, glycerol (GL) is obtained. In all these reactions, esters are produced. Many works have used methanol (Darnoko and Cheryan, 2000; Fukuda et al., 2001) as alcohol reactant which mainly results from oxidation processes of methane, a natural gas component, hence a non-renewable energy. Ethanol and particularly bioethanol from sugar cane, sugar beet or corn is preferable to methanol due to its superior dissolving power for vegetable oils, low toxicity and its renewable origin.
(Pinzi et al., 2011a; Pinzi et al., 2011b), free fatty acid (FFA) content, moisture in oil or alcohol, type and amount of catalyst, molar ratio of oil to ethanol, type and speed of stirring, pressure and temperature (Freedman et al., 1984; Darnoko and Cheryan, 2000; Meher et al., 2006; Demirbas and Karslioglu, 2007) should be considered in the transesterification process. Among alkali (non-ionic (Gerhard et al., 1978) or ionic (Arzamendi et al., 2007; Sharma and Singh, 2008)), acid (Al-Widyan and Al-Shyoukh, 2002), enzyme (Iso et al., 2001) or heterogeneous (Dossin et al., 2006; Li and Xie, 2006) catalysts used in transesterification of triglycerides, alkali ionic bases such as NaOH or KOH are effective homogeneous catalysts (Ma and Hanna, 1999; Dorado et al., 2004). Alkoxides, which have been rarely studied, are even more efficient.
In previous studies, different analytical procedures (gas chromatography (Mittelbach, 1993; Knothe, 2001), high performance liquid chromatography (Holcapek et al., 1999), Fourier transform infrared spectroscopy (Zagonel et al., 2004; Mahamuni and Adewuyi, 2009) have been developed to off-line monitor the composition of reaction mixtures obtained during or after transesterification of vegetable oils with ethanol containing also FFA, ethyl esters, monoglycerides, diglycerides, triglycerides and glycerol. Up to now, only a few techniques such as ultrasonication-assisted spray ionization mass spectroscopy (Chen et al., 2010) or mid-infrared spectroscopy (Trevisan et al., 2008) can on-line monitor organic reactions. In each on-line method development, an off-line reference method has to be used for analysis of transesterification reaction.
fast, reliable, inexpensive and non-destructive analytical technique, and does not require complex pre-treatment (Knothe, 1999; Balabin et al., 2010). In the NIR region from 780 to 2500 nm (12800-4000 cm-1), all components typically absorb at more than one
wavelength. This kind of method has already been used to determine off-line the biodiesel quality obtained from transesterification of soybean oil with methanol (Baptista et al., 2008) or to predict methanol and water content in biodiesel (Felizardo et al., 2007). Calibration models for the prediction of methyl ester content in biodiesel were developed in a wide range with prediction errors comparable to the references method ones.
The aim of this work is to develop, validate and optimize a fast, reliable and inexpensive analytical method to monitor the transesterification reaction of high oleic sunflower oil with ethanol homogeneously catalyzed by sodium ethoxide in a one-liter batch reactor by using NIR spectroscopy on-line. This method was associated with off-line Gas Chromatography-Flame Ionisation Detection (GC-FID) as a reference method to determine the composition of the medium during the reaction. This technique could avoid using GC-FID analysis which is precise but shows several drawbacks. Indeed, it cannot be used as an on-line technique because the reaction needs to be quenched (neutralizing catalyst with acid) to follow the reaction kinetics, samples have to be pretreated (several dilutions, addition of an internal standard…), analysis is long (approximately 1 h per sample) and finally, it generates a disturbance of the medium (a few mL are taken for each analysis, the samples being not surely homogeneous). For
this, several significant parameters of the reaction such as water content in ethanol, ethanol to oil molar ratio and temperature will be studied in this work. Hence kinetics parameters, in particular activation energy, will be determined precisely.
2. Material and methods
2.1. Material and reagent
High oleic sunflower oil was obtained from ITERG (Pessac, France). Its fatty acid composition is as follows: palmitic acid of 3.5%, stearic acid of 3.0%, oleic acid of 87.6%, linoleic acid of 4.9% and other acids of 1.2% (by weight). Hydrochloric acid (analytically pure, 37% solution in water) and sodium ethoxide EtONa (analytically pure, 21wt% in ethanol) were purchased from Acros Organics; absolute ethanol (99.95%), grade ethanol (96%) and cyclohexane were supplied by Scharlau. N-methyl-N-trimethylsilyl-heptafluorobutyramide (MSHFBA) and methylimidazole (MI) were purchasedrespectively from Macherey Nagel and Sigma-Aldrich.
2.2. Transesterification reaction
The transesterification reaction was carried out in a one-liter batch reactor with a double-jacket and counter-blades. Water from a temperature-controlled bath flows inside the double-jacket to maintain the targeted reactor temperature. This reactor was equipped with a condenser, a thermocouple, a probe linked to the NIR spectra analytical system with optic fibers and a mechanical stirrer as it has been demonstrated that
mechanical stirrers are more efficient than magnetic stirrers (Sharma and Singh, 2008). Moreover, all the processes were led under atmospheric pressure. Transesterification of high oleic sunflower oil was carried out by using the following procedure: 600 g of high oleic sunflower oil were introduced into the dried reactor and the mechanical stirring was turned on at 750 rpm. The sunflower oil was heated until the desired temperature was reached. At this point, a mixture of ethanol and EtONa (1wt% compared to oil mass) was added to the oil. EtONa/EtOH addition was considered as time zero of the reaction. All different conditions applied for the batch reaction are listed in Table 1. Different oil to alcohol molar ratios were tested (1:3, 1:6, 1:9). A series of ethanol with different water content were used (5.54, 3.26, 1.59, 0.16 and 0.08wt%). The moisture analysis was performed by Karl-Fisher titration (Karl-Fisher titrator DL38 from METTLER TOLEDO, Switzerland). Besides, the temperature range was tested from 30°C to 80°C (close to boiling point of the alcohol).
Concerning the off-line analysis, 1mL of sample was collected from reactor at different reaction times (3, 6, 10, 15, 20, 30, 40, 50 and 60 min), immediately quenched by adding a required amount of HCl (3.7%) in order to neutralize the alkali catalyst (96 µL for 1wt% of catalyst). These samples were analyzed by GC-FID. In the meanwhile, NIR spectroscopy was performed at moments corresponding to the time of sample collection in order to on-line monitor the transesterification reaction. At the end of the conversion of the sunflower oil (1 h), the reaction medium was neutralized by HCl addition, and then was allowed to stand for decantation. For all these experiments, each phase was analyzed separately by GC-FID. The majority of the ester was contained in the upper layer where as glycerol formed the lower layer in a two-phase system. The non-reacted ethanol was distributed between the two phases, monoglycerides and
diglycerides remaining in the ester phase.
2.3. Gas chromatography analysis
The collected samples were analyzed by gas chromatography using a Perkin Elmer Instrument (Perkin Elmer, USA) coupled to a flame ionization detector (FID). Separation was carried out with a silica capillary column (CP-Sil 8 CB lowbleed/MS, 5% phenyl + 95% dimethylpolysiloxane, 15m, 0.32 mm, 0.25 µm) from Varian (USA). The chromatograph was equipped with an automatic injector and the injections (1 µL) were performed with an “on-column” mode.
The carrier gas was helium (Air Liquide, France) at a pressure of 15 psi at the head of the column. Injector temperature was 55°C during 0.5 min and ramped to 340°C at 200°C.min-1 (held 43 min). Temperature in the oven was held 0.5 min at 55°C, then
ramped to 80°C at 45°C.min-1 and finally increased to 360°C at 10°C.min-1 (held 16
min). The total running time was 45 min. The temperature of the detector (FID) was 360°C.
All the samples (180 µL) were previously silylated with 20 µL of a mixture of MSHFBA (1 mL) and MI (50 µL). This hydroxyl group silylation is intended to increase volatility and stability of the hydroxy compounds injected, and therefore to improve their detection. Cyclohexane was used as solvent to prepare standard solutions and heptadecane was used as the internal standard (1 mg/mL).
This analytical procedure allows to determine the molar concentrations of ethyl ester, oleic acid, monoglycerides, diglycerides and triglycerides in the different phases resulting from the reaction. These gas chromatography data was used to calculate the
total ethyl ester (more precisely ethyl oleate) content in oleic chains mixture: t t t t t t TG DG MG C EE EE Content Ester Ethyl ] [ 3 ] [ 2 ] [ ] [ ] [ ] [ (%) 1 : 18 + + × + × + =
where [EE]t, [C18:1]t, [MG]t, [DG]t and [TG]t represent respectively the molar
concentrations (µmol/ml) of ethyl oleate, oleic acid and oleic monoglycerides, diglycerides and triglycerides at a given time.
Ethyl ester yields (YEE) and triglycerides conversion (χTG) can also be calculated with
the following formula:
0 ] [ 3 ] [ TG EE Y t EE × = and 0 0 ] [ ] [ ] [ TG TG TG t TG − = χ
where [TG]0 is the triglycerides concentration at initial time.
2.4. NIR spectroscopy analysis
The NIR spectra of the transesterification reaction mixture samples were recorded by averaging 32 scans (approximately 1s/scan) in the wavelength range of 10000-4000 cm-1 using a NIR spectrometer (Antaris MX FT-NIR Process Analyzer from Thermo
Fisher Scientific, USA). This apparatus was equipped with a fiber-optic probe working by transflectance, which means that the beam passes through the solution, reflects on a mirror, before passing again through the solution. The optical beam path was 1.5 mm and the spectral resolution was 2 cm-1. The spectrometer was operated by Omnic
(Thermo Fisher Scientific, USA) software.
Unscrambler 9.5 (Camo, Process AS, Norway) and TQ Analyst (Thermo Fisher Scientific, USA) software were used to import and analyze the data. Principal Component Analysis (PCA), which is a qualitative method, was performed on NIR data in order to show the influences of water content in ethanol and temperature on NIR spectroscopic data. Each NIR spectrum corresponds to a reaction aliquot which was collected and analyzed by GC-FID. PCA was not led on the total wavelength range of NIR spectra (10000-4000 cm-1) because several regions were not useful for data
treatment. Thus, to improve the results of the statistical treatment, two different spectral regions were suggested to work with by Unscrambler software: from 7456 to 6907 cm-1
and from 6102 to 4563 cm-1.
A series of ethanol with different water content (from 0.08wt% to 5.54wt% of water in ethanol) were tested in the transesterification reaction at 70°C, with ethanol to oil molar ratio of 6:1 and 1wt% of catalyst (batch 5, 7, 8, 9 and 10 in Table 2). This PCA was performed on a total of 45 samples corresponding to 9 different reaction times for each experiment.
PCA was also used to perform the qualitative analysis of the spectra at different temperatures from 30°C to 80°C with the other parameters fixed: ethanol to oil molar ratio of 6:1, 1wt% of catalyst and a water content in ethanol of 0.16wt% (batch 1 to 6 in Table 1). 52 samples were used to lead this PCA (9 different reaction times for each experiment but 2 samples have been removed because of a too important noise).
Partial Least Squares (PLS) regression was also used to develop calibration models between spectral and analytical GC data. This method is quantitative unlike PCA. The values of ethyl oleate and monoglycerides contents were used to establish a multivariate model with the NIR spectra. In order to remove small inter-batch differences due to
uncontrolled sources of variation, data pre-processing methods were applied to the spectra, such as baseline correction, Savitzky–Golay smoothing, derivative, mean centering, variable scaling, multiplicative signal correction (MSC), standard normal variate (SNV) and also variables selection. Performance index was used to evaluate the performance of the method. It indicates how well the calibrated method can classify the validation standards. As the performance index algorithm is set to “RMSE”, the root mean square error is reported. The closer the RMSE value is to zero, the smaller are the differences between the calculated concentrations values and the actual values. Root Mean Square Error on Calibration (RMSEC) and Root Mean Square Error on Prediction (RMSEP) have been calculated.
From PLS regression, two calibration models have been developed. The first model is able to predict variations of the ethyl ester and oleic monoglycerides contents in the reaction mixtures with varying temperatures from 30°C to 80°C. We used the same 52 samples (34 for calibration and 18 for validation) as those used for the PCA to establish this model. Besides, an other calibration model was developed from the spectra of the set of 27 samples (21 for the calibration and 6 for the external validation) all measured at 70°C (batches 10, 11 and 12) to predict the contents of the two main chemical components: ethyl ester and oleic monoglycerides.
3. Results and discussion
3.1. Validation of NIR spectroscopic analytical method for on-line monitoring of the ethanolysis of high oleic sunflower oil
All NIR spectra have been carried out without quenching the reaction because neither collection nor sample preparation are needed. Fig.1(a) shows the 3D-spectral variations observed in the batch reaction (batch 10 of Table 1: 70°C, ethanol to oil molar ratio 6:1, 1wt% of catalyst, water content in ethanol 0.08wt% for all reaction times) as a function of the wavelengths and reaction time. It can be noticed that the total amount of triglycerides and diglycerides have been converted even after 3min reaction time (only ethyl oleate and monoglycerides are remaining). Under the experimental conditions employed, above 9000 cm-1 absorption signals are practically inexistent, whereas below
4500 cm-1 significant variation of the instrumental noise appears. Significant spectral
variations are observed between the wavelengths 6000 and 5200 cm−1 and 5100 and
4500 cm−1 depending on the reaction time. The peaks of ethyl esters are localized in the
first region between 6000 cm-1 and 5200 cm-1. The formation of ethyl ester could also
be distinguished by the evolution of peaks intensities shown in e-supplement Figure (2D-representation of Fig.1 (a)) at 6998 cm-1, 5160 cm-1 and 4582 cm-1. Each spectrum
at different reaction time of this batch reaction as well as the ethanol and oil mixture exhibits different intensities at these wavelengths. Indeed, these peaks intensities are definitely less important for the ethanol and oil mixture than those for the reaction mixtures. Moreover, two shoulders may be distinguished at 5941 cm-1 and 5901 cm-1 for
the reaction mixtures as the focus on e-supplement Figure shows. These both shoulders do not appear for the mixture of oil and ethanol. According to changes in the NIR spectra of the reaction mixture during sunflower oil ethanolysis, a multivariate method
was developed to allow the in-situ evaluation of ethyl ester and monoglycerides contents. Therefore, the two regions were used for the following data treatment of this work: one region covering wavelengths from 7456 to 6907 cm-1 and another region
between 6102 and 4563 cm-1. It has been checked that the results on performance index
were improved while using these two regions rather than the whole wavelength range.
The effect of temperature on NIR spectra of oil and ethanol mixtures is shown in Fig.1(b). Significant and similar spectral variations were observed in the same regions of the variations observed with reaction time. The absorbance of the mixture increases when temperature increases from ambient temperature to 80°C.
The results of the PCA (Fig.2(a)) on data from batch 1 to 6 in Table 1 show that three principal components (PC) are sufficient to predict 100% of the total variance: 95% for PC1, 4% for PC2 and 1% for PC3. The presence of clusters demonstrated a significant effect of temperature on the spectral data according to the gradual variation of ethyl ester composition. Moreover, inside those clusters, it can be observed that reaction time has an influence on the reaction media composition as long as the reaction occurs.
The Fig.2(b) shows the graph of scores obtained for the Principal Component Analysis (PCA) of the spectral data from the batchs 5, 7, 8, 9 and 11 (see Table 1). In each cluster corresponding to a specific water content, the reaction kinetics follow a continuous order although this 3D-graph only allows us to well represent the kinetics for water contents of 0.08wt% and 0.16wt%. It demonstrates that initial water content in ethanol has a significant effect on the triglycerides conversion to ethyl ester in the
Concerning the PLS regressions, only ethyl ester and monoglycerides contents have been predicted because they are the main compounds of the medium as soon as the reaction starts. Diglycerides and triglycerides contents were not determined because their amounts were too low to establish a valuable predicting model. The comparison of the obtained results with different methods led to apply all the pre-processing methods described in 2.5 (Table 2) for prediction of ethyl ester and of monoglycerides contents. Ten latent variables for ethyl ester and eight latent variables for monoglycerides have been used to build the PLS model for predicting both ethyl ester and monoglycerides contents. Indeed, by increasing the number of latent variables, PLS can capture both the variation introduced by temperature differences and compounds percentage into the new score matrix (Hageman et al., 2005). The predicted contents of ethyl ester obtained during transesterification show no significant differences with the chromatographic results as shown in Fig.3(a) using the method d of pre-processing (Table 2) because the correlation coefficients (R²) was 0.99361 whereas the RMSEC and RMSEP were respectively 1.26 and 1.74. The model used is then able to predict composition of batches with temperature varying from 30°C to 80°C.
Using experiments in the same conditions (batches 10, 11 and 12), the calibration plot for ethyl ester content (Fig.3(b)) shows a good correlation from 93% to 100% with a R² of 0.98244 using four latent variables. Less latent variables are used here because temperature was fixed for all samples at 70°C. The RMSEC and RMSEP were respectively 0.378 and 0.433. Concerning the calibration plot for monoglycerides content, Fig.3(c) shows a good correlation for oleic monoglycerides contents between
0% and 7% with a R² of 0.98610 using four latent variables. The RMSEC and RMSEP were respectively 0.338 and 0.338. By comparison with the previous PLS model, the quality of prediction is better for the samples analyzed in the same temperature conditions.
3.2 Kinetics of high oleic sunflower oil transesterification to ethyl esters
Before determining the kinetics parameters of this reaction, classical influence of parameters were verified. First of all, a high water content limits the efficiency of transesterification even under optimal conditions (ethanol to oil molar ratio 6:1, 1 wt% EtONa, 70°C). So, ethanol containing the less water was used (0.08 wt%), in accordance with previous studies with methanol (Romano, 1982; Kusdiana and Saka, 2004; Srivastava and Verma, 2008). Otherwise, according to previous works (Noureddini and Zhu, 1997), the use of high ethanol to oil molar ratio results in greater ester formation in a shorter time. Indeed, the maximum ethyl esters content was obtained when the molar ratio was increased to a value of 6:1 (even if the stoichiometric ratio for transesterification requires three moles of alcohol for one mole of triglycerides). Finally, we showed that all reactions at different temperatures (from 30°C to 80°C) were very rapid, the highest reaction rate being at 70°C-80°C.
Concerning the kinetic model to describe sunflower oil transesterification, limited studies have been reported. The only one referring to the transesterification with ethanol was studied in the presence of NaOH catalyst (Marjanovic et al., 2010). Generally, second order reaction for all three reversible reactions provided a satisfactory
mechanism (Noureddini et al., 1998; Darnoko and Cheryan, 2000). The ethanolysis of triglycerides was considered as an irreversible pseudo second-order reaction in the early period of the reaction due to the excess of ethanol, followed by first order or zero order kinetics (Marjanovic et al., 2010). Therefore, two models based on the kinetics of triglycerides transesterification were developed in this work to verify this hypothesis. The irreversible pseudo second-order reaction rate in the early period of the reaction for triglycerides in Fig.4(a) would be written as follows:
[ ] [ ]
2 2TG k dt TG d rTG =− = − (1)where k2 is the reaction rate constant for the irreversible pseudo second-order reaction.
Integration of equation (1) gives:
[ ] [ ]
0 2 1 1 TG TG t k = − (2)Equation (1) can also be transformed to equation (4) by substitution of [TG] (3):
[ ] [ ] (
TG =TG 0 1−χTG)
(3)[ ]
[ ]
2(
)
2 0 2 0 1 TG TG TG k dt d TG χ = −χ (4)where χTG is the conversion degree of triglycerides, [TG]0 is the initial concentration
of triglycerides.
Integration of equation (4) gives:
[ ]
TG k t TG TG 2 0 1−χ = χ (5)Similarly, the same procedure applied to first-order reaction would result in following equations (6)-(8):
[ ]
k[ ]
TG dt TG d rTG=− = 1 − (6)[ ] [ ]
TG lnTG 0 k1t ln − =− (7)(
1 TG)
k1t ln − = − χ (8)A plot of equation (5) and (8) will be linear with a slope equal respectively to the reaction rate constant [TG]0 k2 (for the second-order reaction) and k1 (for the fist-order
reaction). Graphs representing the irreversible pseudo second-order kinetics model (Fig.4(a)) and the first-order kinetics model (Fig.4(b))shows that a pseudo second-order reaction model is more compatible with the kinetics of the EtO-Na+ base-catalyzed
sunflower oil ethanolysis in a batch reactor than the first order reaction model. The R2
values for the second order reaction ranged between 0.8800 and 0.9901 for varying temperature, which are higher than values for the first order reaction (between 0.8975 and 0.9498). However, R2 value for the second order reaction at 30°C is lower than that
for the first order reaction at the same temperature.
Based on an irreversible pseudo second-order model in the early period of the reaction, reaction rate constants at different temperatures and the Arrhenius law was used to determine the pre-exponential factor A and also the activation energy Ea of the
reaction plotting equation (10) obtained from Arrhenius law (9):
− = RT E A k exp a 2 (9)
Equation (9) can also be written as ln k2 in function of 1/T:
T R E A k a 1 ln ln 2= − × (10)
where Ea is the activation energy, R is the gas constant (≈8.314 J.K-1.mol-1), and T is
kJ/mol) was calculated. The value of Ea is in the same order of magnitude as previous
work mentioned for NaOH-catalyzed sunflower oil ethanolysis (Marjanovic et al., 2010).
4. Conclusions
Two calibration models of NIR spectroscopy were developed to on-line evaluate the main components during the high oleic sunflower oil transesterification reaction with ethanol catalyzed by EtONa. Results demonstrate that NIR spectroscopy is a fast and reliable technique to on-line determine the composition of a reaction mixture during transesterification without collecting and preparing samples. This method elaborated at laboratory-scale could also be used at industrial-scale, either in batch systems or continuous systems. Regarding to the kinetics, a pseudo second-order reaction model is the most compatible and activation energy (51.0 kJ/mol) was calculated.
Acknowledgments
We gratefully acknowledge the co-financial support from INRA (Institut National de la Recherche Agronomique) and the Région Midi-Pyrénées in France which enabled us to lead this research work in the Laboratoire de Chimie Agro-industrielle (LCA).
References
Al-Widyan, M. I.,Al-Shyoukh, A. O., 2002. Experimental evaluation of the transesterification of waste palm oil into biodiesel. Bioresour. Technol. 85, 253-256.
Arzamendi, G., Campo, I., Arguiñarena, E., Sánchez, M., Montes, M.,Gandía, L. M., 2007. Synthesis of biodiesel with heterogeneous NaOH/alumina catalysts: Comparison with homogeneous NaOH. Chem. Eng. J. 134, 123-130.
Balabin, R. M., Safieva, R. Z.,Lomakina, E. I., 2010. Gasoline classification using near infrared (NIR) spectroscopy data: Comparison of multivariate techniques. Anal. Chim. Acta 671, 27-35.
Baptista, P., Felizardo, P., Menezes, J. C.,Correia, M. J. N., 2008. Multivariate near infrared spectroscopy models for predicting the methyl esters content in biodiesel. Anal. Chim. Acta 607, 153-159.
Chen, T.-Y., Chao, C.-S., Mong, K.-K. T.,Chen, Y.-C., 2010. Ultrasonication-assisted spray ionization mass spectrometry for on-line monitoring of organic reactions. Chem. Commun. 46, 8347-8349.
Darnoko, D.,Cheryan, M., 2000. Kinetics of palm oil transesterification in a batch reactor. J. Am. Oil Chem. Soc. 77, 1263-1267.
Demirbas, A.,Karslioglu, S., 2007. Biodiesel production facilities from vegetable oils and animal fats. Energy Sources Part A 29, 133-141.
Affecting the Alkali-Catalyzed Transesterification Process of Used Olive Oil. Energy Fuels 18, 1457-1462.
Dossin, T. F., Reyniers, M.-F., Berger, R. J.,Marin, G. B., 2006. Simulation of heterogeneously MgO-catalyzed transesterification for fine-chemical and biodiesel industrial production. Appl. Catal., B 67, 136-148.
Encinar, J. M., González, J. F.,Rodríguez-Reinares, A., 2007. Ethanolysis of used frying oil. Biodiesel preparation and characterization. Fuel Process. Technol. 88, 513-522.
Felizardo, P., Baptista, P., Menezes, J. C.,Correia, M. J. N., 2007. Multivariate near infrared spectroscopy models for predicting methanol and water content in biodiesel. Anal. Chim. Acta 595, 107-113.
Freedman, B., Pryde, E. H.,Mounts, T. L., 1984. Variables Affecting the Yields of Fatty Esters from Transesterified Vegetable-Oils. J. Am. Oil Chem. Soc. 61, 1638-1643.
Fukuda, H., Kondo, A.,Noda, H., 2001. Biodiesel Fuel Production by Transesterification of Oils. Soc. Biotechnol., Jpn. 92, 405-416.
Gerhard, H., Wolfgang, S.,Helmut, V., 1978. 4-Dialkylaminopyridines as Highly Active Acylation Catalysts. [New synthetic method (25)]. Angew. Chem., Int. Ed. 17, 569-583.
Hageman, J. A., Westerhuis, J. A.,Smilde, A. K., 2005. Temperature robust multivariate calibration: an overview of methods for dealing with temperature influences on
near infrared spectra. J. Near Infrared Spectrosc. 13, 53-62.
Holcapek, M., Jandera, P., Fischer, J.,Prokes, B., 1999. Analytical monitoring of the production of biodiesel by high-performance liquid chromatography with various detection methods. J. Chromatogr., A 858, 13-31.
Iso, M., Chen, B., Eguchi, M., Kudo, T.,Shrestha, S., 2001. Production of biodiesel fuel from triglycerides and alcohol using immobilized lipase. J. Mol. Catal. B: Enzym. 16, 53-58.
Knothe, G., 1999. Rapid monitoring of transesterification and assessing biodiesel fuel quality by near-infrared spectroscopy using a fiber-optic probe. J. Am. Oil Chem. Soc. 76, 795-800.
Knothe, G., 2001. Analytical methods used in the production and fuel quality assessment of biodiesel. Trans. ASAE 44, 193-200.
Kusdiana, D.,Saka, S., 2004. Effects of water on biodiesel fuel production by supercritical methanol treatment. Bioresour. Technol. 91, 289-295.
Li, H.,Xie, W., 2006. Transesterification of Soybean Oil to Biodiesel with Zn/I2 Catalyst. Catal. Lett. 107, 25-30.
Ma, F.,Hanna, M. A., 1999. Biodiesel production: a review. Bioresour. Technol. 70, 1-15.
Mahamuni, N. N.,Adewuyi, Y. G., 2009. Fourier Transform Infrared Spectroscopy (FTIR) Method To Monitor Soy Biodiesel and Soybean Oil in Transesterification Reactions, Petrodiesel - Biodiesel Blends, and Blend
Adulteration with Soy Oil. Energy Fuels 23, 3773-3782.
Marjanovic, A. V., Stamenkovic, O. S., Todorovic, Z. B., Lazic, M. L.,Veljkovic, V. B., 2010. Kinetics of the base-catalyzed sunflower oil ethanolysis. Fuel 89, 665-671.
Meher, L. C., Vidya Sagar, D.,Naik, S. N., 2006. Technical aspects of biodiesel production by transesterification--a review. Renew. Sust. Energy Rev. 10, 248-268.
Mittelbach, M., 1993. Diesel Fuel Derived from Vegetable-Oils, V [1] - Gas-Chromatographic Determination of Free Glycerol in Transesterified Vegetable-Oils. Chromatographia 37, 623-626.
Noureddini, H., Harkey, D.,Medikonduru, V., 1998. A continuous process for the conversion of vegetable oils into methyl esters of fatty acids. J. Am. Oil Chem. Soc. 75, 1775-1783.
Noureddini, H.,Zhu, D., 1997. Kinetics of transesterification of soybean oil. J. Am. Oil Chem. Soc. 74, 1457-1463.
Pinzi, S., Gandía, L. M., Arzamendi, G., Ruiz, J. J.,Dorado, M. P., 2011a. Influence of vegetable oils fatty acid composition on reaction temperature and glycerides conversion to biodiesel during transesterification. Bioresour. Technol. 102, 1044-1050.
Pinzi, S., Mata-Granados, J. M., Lopez-Gimenez, F. J., Luque de Castro, M. D.,Dorado, M. P., 2011b. Influence of vegetable oils fatty-acid composition on biodiesel
optimization. Bioresour. Technol. 102, 1059-1065.
Romano, S., 1982. Vegetable oils-a new alternative. In: Vegetable oil fuels-proceedings of the international conference on plant and vegetable oils as fuels. ASAE Pub. 82 101-116.
Sharma, Y. C.,Singh, B., 2008. Development of biodiesel from karanja, a tree found in rural India. Fuel 87, 1740-1742.
Srivastava, A.,Prasad, R., 2000. Triglycerides-based diesel fuels. Renew. Sust. Energy Rev. 4, 111-133.
Srivastava, P. K.,Verma, M., 2008. Methyl ester of karanja oil as an alternative renewable source energy. Fuel 87, 1673-1677.
Trevisan, M. G., Garcia, C. M., Schuchardt, U.,Poppi, R. J., 2008. Evolving factor analysis-based method for correcting monitoring delay in different batch runs for use with PLS: On-line monitoring of a transesterification reaction by ATR-FTIR. Talanta 74, 971-976.
Zagonel, G. F., Peralta-Zamora, P.,Ramos, L. P., 2004. Multivariate monitoring of soybean oil ethanolysis by FTIR. Talanta 63, 1021-1025.
Figure captions:
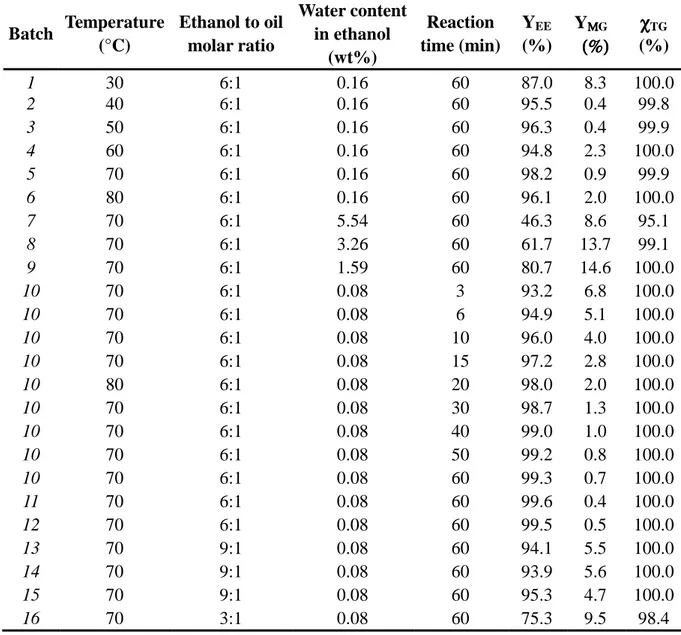
Table 1: Experimental conditions for each transesterification batch and results obtained by GC-FID (1wt% of EtONa was used in all experiments).
Table 2: External validation results (random selection of 18 standards) for the prediction of ethyl oleate and oleic monoglycerides contents (batches 1 to 6) using different pre-processing methods (a Obtained using as reference the region between the
wave lengths of 9000-10000 cm-1; b Savitzky-Golay smoothing obtained by a 3rd order
polynomial using 37 points window; c First derivative obtained by 37 points window; d
Mean centering calculates the average spectrum and subtracts it from each calibration spectrum. With variance scaling, the standard deviation of the intensity values of each X-axis location in the calibration spectra is obtained dividing each data point in each calibration spectrum by its estimated standard deviation).
Fig.1: (a) 3D-plot of FT-NIR spectra of the batch 5 reaction as a function of
wavelengths and reaction time. (b) FT-NIR spectra of mixture of ethanol and oil (molar ratio 6:1) at different temperatures.
Fig.2: 3D-scatter plot of the scores for principal component analysis of spectral data (a)
influence of temperature (data from batch 1 to 6); (b) influence of water content in ethanol (data from batch 5, 7, 8, 9, 10).
Correlation between ethyl oleate contents (b) and monoglycerides (c) obtained by GC-FID and through the FT-NIR/PLS model for experiments at 70°C.
Fig.4: (a) Reverse pseudo second-order kinetics model: XTG/(1-XTG) versus time; (b)
First-order kinetics model: -ln(1-XTG) versus time at different temperatures (30°C, 40°C,
50°C, 60°C); (c) Arrhenius plot of the reaction rate vs. temperature for the reverse
pseudo second-order reaction (Patm; ethanol to oil molar ratio 6:1; catalyst amount 1wt%;
water content in ethanol 0.08wt%).
E-supplement Figure: FT-NIR spectra for the different reaction times and for oil and ethanol mixture in the same conditions – Focus on the wavelengths range between 6100 cm-1 et 5500 cm-1 (Patm; T = 70°C; ethanol to oil molar ration 6:1; catalyst amount 1wt%,
Table 1 Batch Temperature (°C) Ethanol to oil molar ratio Water content in ethanol (wt%) Reaction time (min) YEE (%) YΜΜΜΜG (%) (%)(%) (%) (%) χχχχTG 1 30 6:1 0.16 60 87.0 8.3 100.0 2 40 6:1 0.16 60 95.5 0.4 99.8 3 50 6:1 0.16 60 96.3 0.4 99.9 4 60 6:1 0.16 60 94.8 2.3 100.0 5 70 6:1 0.16 60 98.2 0.9 99.9 6 80 6:1 0.16 60 96.1 2.0 100.0 7 70 6:1 5.54 60 46.3 8.6 95.1 8 70 6:1 3.26 60 61.7 13.7 99.1 9 70 6:1 1.59 60 80.7 14.6 100.0 10 70 6:1 0.08 3 93.2 6.8 100.0 10 70 6:1 0.08 6 94.9 5.1 100.0 10 70 6:1 0.08 10 96.0 4.0 100.0 10 70 6:1 0.08 15 97.2 2.8 100.0 10 80 6:1 0.08 20 98.0 2.0 100.0 10 70 6:1 0.08 30 98.7 1.3 100.0 10 70 6:1 0.08 40 99.0 1.0 100.0 10 70 6:1 0.08 50 99.2 0.8 100.0 10 70 6:1 0.08 60 99.3 0.7 100.0 11 70 6:1 0.08 60 99.6 0.4 100.0 12 70 6:1 0.08 60 99.5 0.5 100.0 13 70 9:1 0.08 60 94.1 5.5 100.0 14 70 9:1 0.08 60 93.9 5.6 100.0 15 70 9:1 0.08 60 95.3 4.7 100.0 16 70 3:1 0.08 60 75.3 9.5 98.4
Table 2
Compounds Parameter Baseline
correction a a + SG smoothing b b + Derivative c c +Mean-centering + variance scaling d Latent variables 10 10 10 10 RMSEC 2.78 2.89 1.35 1.26 Ethyl ester RMSEP 5.45 5.64 2.13 1.74 Latent variables 8 8 8 8 RMSEC 1.22 1.23 1.00 0.90 Mono glycerides RMSEP 1.83 1.83 1.79 1.49