HAL Id: hal-01620457
https://hal.archives-ouvertes.fr/hal-01620457
Submitted on 20 Oct 2017
HAL is a multi-disciplinary open access
archive for the deposit and dissemination of
sci-entific research documents, whether they are
pub-lished or not. The documents may come from
teaching and research institutions in France or
abroad, or from public or private research centers.
L’archive ouverte pluridisciplinaire HAL, est
destinée au dépôt et à la diffusion de documents
scientifiques de niveau recherche, publiés ou non,
émanant des établissements d’enseignement et de
recherche français ou étrangers, des laboratoires
publics ou privés.
Thermo-mechanical recycling of rubber: Relationship
between material properties and specific mechanical
energy
Rodrigo Diaz, Gael Colomines, Edith Peuvrel-Disdier, Rémi Deterre
To cite this version:
Rodrigo Diaz, Gael Colomines, Edith Peuvrel-Disdier, Rémi Deterre. Thermo-mechanical recycling of
rubber: Relationship between material properties and specific mechanical energy. Journal of Materials
Processing Technology, Elsevier, 2018, 252, pp.454 - 468. �10.1016/j.jmatprotec.2017.10.014�.
�hal-01620457�
1
Thermo-mechanical recycling of rubber: Relationship between material
properties and specific mechanical energy
Rodrigo Diaz
1,2, Gaël Colomines
1, Edith Peuvrel-Disdier
3, Rémi Deterre
1*1
Université de Nantes, IUT de Nantes, CNRS, GEPEA, UMR 6144, 2 Avenue du professeur Jean Rouxel, BP 539, 44475 Carquefou, France
2
REP International, 15 rue du Dauphiné 69964 Corbas, France
3
MINES ParisTech, PSL Research University, CEMEF - Centre de Mise en Forme des Matériaux, UMR CNRS 7635, CS 10207, 06904 Sophia-Antipolis, France
*Corresponding author/ Phone: +33 228092060, E-mail address: remi.deterre@univ-nantes.fr
Abstract
The studied and optimized devulcanization process is known as “High Shear Mixing” (HSM) recycling process. In the process the rubber is sheared between two metallic cones with special geometries. One cone is static as the other one rotates simultaneously and applies pressure to the material.
Among the different parameters that are controlled and/or measured during the process two are highlighted for their importance: the temperature of the rubber, and the specific mechanical energy consumed during the process. It is shown that the energy consumed by the rotor can be correlated to the degree of devulcanization of the rubber which is measured by means of physicochemical
analyses. An optimal state of surface activation on the treated rubber is also described. A physical model of the rubber network evolution along the HSM treatment is proposed.
Keywords: Devulcanization; recycling; rubber; crosslink density; surface activation
1. Introduction
According to the International Rubber Study Group (IRSG), (2016) the world produced about 26,000 tons of rubber in 2015. At some point or another all of this rubber will become waste, either as production waste or as end of life waste. This waste poses an enormous challenge for its disposal or recycling. The waste can be disposed of by sending it to landfills to be buried, by incineration or by pyrolysis. The recycling of rubber is a more complicated matter as it will be shown. De et al., (2005) presented an excellent overview of recycling techniques that do not intend to devulcanize the rubber.
2 When rubber is vulcanized the polymer chains that compose the rubber are chemically
attached by a vulcanization agent (usually sulfur) at different points along the chains, as shown in Figure 1-B. These attachments are known as crosslinks and they form a 3D network of polymer chains when the vulcanization is completed. It is this crosslinking of the chains that gives the rubber its mechanical characteristics.
Figure 1. A) polymer chains before vulcanization, B) rubber network after vulcanization, C) possible results of a devulcanization process, C1) reclamation and C2) devulcanization.
Ideally the recycling of rubbers should be the devulcanization of the rubber, which consists of the breakage of all crosslinks so the polymer chains can be freed and subsequently vulcanized into another product. However, once they are created crosslinks are very difficult to break. This is an advantage during the useful life of a rubber product but it is also the main challenge for
devulcanization.
The subject of this work is the study of a thermomechanical devulcanization process, called High Shear Mixing (HSM).
3
Parameters
Symbol Units Found in equation(s)
Rotation speed 𝞨 rad 1
Power 𝑃 W 1, 2
Torque 𝑇𝑜𝑟𝑞𝑢𝑒 N.m 1
Energy 𝐸 J 2
Time 𝑡 s 2
Crosslink density 𝜐 mol/cm3 3
Polymer fraction of the swollen mass 𝑉𝑟0 3,4 Solvent molar volume
108 cm3/mol for cyclohexane (Brandrup et al., 2003) Vsol
cm3/mol 3 Crosslink functionality
f = 4 for a tetra functional network (Flory and Rehner, 1943)
𝑓 3
Flory-Huggins polymer-solvent interaction constant
f = 0.35 for the system EPDM-cyclohexane from Brandrup et al. (2003)
𝜒 3
Carbon black volume fraction in the dry sample Φ 4, 5 Apparent polymer fraction of the swollen mass 𝑉𝑟 4, 6 Correction parameter that depends only on the type of filler
c=1.17 Kraus (1963) 𝑐 4
Carbon black volume in the dry sample 𝑉𝑐 m3 5
Volume of the dry sample 𝑉𝑇 m3 5
Polymer volume in the swollen sample 𝑉𝑝𝑜𝑙 m3 6
Volume of the swollen sample 𝑉𝐺 m3 6
Carbon black mass in the dry sample 𝑚𝑐 kg 5, 6 Polymer mass in the dry sample 𝑚𝑝𝑜𝑙 kg 5,8
Mass of the dry sample 𝑚𝑑 kg 6
Mass of the swollen sample 𝑚𝑠 kg 6
Carbon black density, 1870 kg/m3 for the N550 𝜌𝑐 kg/m3 5 Polymer density, 870 kg/m3 for Keltan 5470 𝜌𝑝𝑜𝑙 kg/m3 5, 6, 13 Solvent density 779 kg/m3 for cyclohexane (Brandrup et al.,
2003) 𝜌𝑠𝑜𝑙 kg/m
3
6
Sol fraction 𝑠 8
Gel Fraction 𝑔 8
Sol fraction of the treated rubber 𝑠𝑓 9, 16, 17 Sol fraction of the non-treated rubber 𝑠𝑖 12, 14, 16,17 Mass of sample before the extractions 𝑚1 kg 9 Mass of sample after the extractions 𝑚2 kg 9 Mass fraction of non-rubber components that can be
extracted by Soxhlet extraction 𝑒𝑁 9, 10, 11 Mass of the non-treated rubber before extraction 𝑚i1 kg 10 Mass of the non-treated rubber after extraction 𝑚i2 kg 10 Crosslink index that represents the average number of
crosslinks per polymer chain for the non-treated rubber 𝛾𝑖 12, 13, 17 Crosslink index that represents the average number of
crosslinks per polymer chain for the treated rubber 𝛾𝑓 17 Crosslink density of the non-treated rubber 𝑣𝑖 mol/cm3 7, 16, 17 Crosslink density of the treated rubber 𝑣𝑓 mol/cm3 16, 17 Number average molecular weight of the original polymer
chains 𝑀���� 𝑛 g/mol 13
4
1.1. Principle of devulcanization
In recent years there has been an increasing amount of work on devulcanization. Different methods were created for this purpose. Myhre et al. (2012) reviewed and divided the methods into two categories:
• Chemical processes which include all the methods where chemical compounds or microorganisms are used to attack and break the crosslinks.
• Physical processes such as mechanical, thermomechanical, microwaves, and ultrasonic processes.
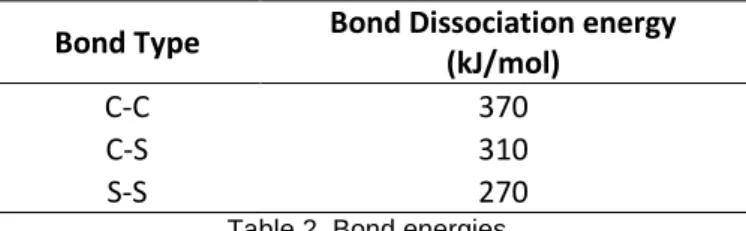
Physical devulcanization processes, such as the one studied here, aim to take advantage of the different bond energies between the molecules that form a vulcanized rubber. A C-C bond is stronger than a C-S bond, which is stronger than a S-S bond. The idea is to bring some energy to the rubber in order to break the S-S and C-S bonds of the crosslinks but not the C-C bonds that form the polymer chains. Typical bond energies as reported by Fukumori and Matsushita (2003) are shown in Table 2.
Bond Type
Bond Dissociation energy
(kJ/mol)
C-C
370
C-S
310
S-S
270
Table 2. Bond energies.
It should be noted that while all of these processes are called devulcanization processes, in reality the result of these methods is a combination of crosslink scission and main chain scission. Figure 1-C depicts the possible results of a devulcanization process. Figure 1-C1 describes the reclamation which Dijkhuis et al. (2008) defined as the random scission of both main chains and crosslinks. Figure 1-C2 shows the devulcanization process of the rubber which should only consist in the scission of crosslinks.
1.2. Principle of high shear mixing devulcanization process
The devulcanization process studied in this work is the HSM. It is described in three patents (Brown, 2008; Watson, 1996; Brown et al., 2003). The patents state that during the HSM process the rubber to be treated is subjected to a series of “high levels of shear and extensional stressing that
5 means of two metallic cones with a series of grooves on their surfaces (see Figure 2). The upper cone, depicted in Figure 2-A, is called a rotor because it is the mobile part. The lower cone is the stator, see Figure 2-B, this one does not rotate but moves vertically to increase or decrease the distance with the rotor cone. The distance between the surfaces of both cones is referred to as the gap, as shown in Figure 2-C. When the rubber is set between these two cones the combination of different parameters such as the gap, the rotation speed (𝞨) and the direction of rotation will make the rubber move into the grooves of the cones, stressing and relaxing it in a continuous and rapid way. Based on the geometry of the cones, the material is highly sheared when the material is located between the zenith flat parts. The material is less sheared when it is located in the grooves.
Figure 2. Technical views of the cones used in this work, A) rotor cone, B) stator cone, C) views of both cones and definition of the GAP.
The two directions of rotation of the rotor are defined as clockwise (CW) and counter-clockwise (CCW) from an upper view of the machine, see Figure 2-C. The angle of the grooves relative to the rotation direction defines the motion of the rubber during the process. The CW direction is expected to push the rubber upward and at some point out of the cones. According to the patent of Brown (2008), in the CCW direction, as “the material moves toward the center of the mixer the
available volume reduces so that the pressure increases with the result that the material wells up away from the center and is thereby re-circulated outwardly. This provides effective distributing mixing.”
6 The HSM process, as currently used for commercial purpose, is best described as a series of stages in which the machine executes a series of programmed parameters. Figure 3 displays a flow diagram describing the process. The first optional stage, the milling of the rubber, is performed when the average size of the rubber is bigger than a couple of cm, the purpose is to reduce the general size of the pieces of rubber and this stage is done with a CCW rotation and a minimum 1 cm gap. Once the rubber has an ideal size (pieces not bigger than 2 cm) the treatment sequence can start. A treatment sequence is a series of steps with different parameters. At the end of the sequence it is possible to program a new sequence, identical or different, or to simply end the treatment.
Figure 3. Flow diagram of a typical HSM treatment.
The objectives of this work are to have a deeper insight into the HSM process, to better understand the role of the different steps in order to try to optimize them based on processing parameters. The HSM process was analyzed on one side via a physico-chemical analysis of the treated material, and on the other side from a thermomechanical point of view via the instrumentation of the process and the follow-up of parameters such as the material temperature, the torque and the energy. Up to now, this process was only described in patents and one of the objectives is to validate the statements related to the devulcanization and to the movement of the rubber inside the cones. An instrumented machine was specifically designed for this purpose. This paper reports on the application of the HSM process to a technical rubber EPDM formulation.
7
2. Experimental 2.1. Material
The rubber used in this study is an ethylene-propylene-diene monomer (EPDM). This formulation was chosen because it is representative of a technical EPDM formulation in the rubber industry. The complete formulation is given in table 3.
Material
(per hundred
phr
rubber)
Keltan 5470 (EPDM)
100
Carbon black (N 550)
80
Paraffinic oil
65
Calcium oxide
4
Zinc oxide
5
Stearin
1
PEG 4000
2
Sulfur (80%)
1,2
MBT( 80%)
1
MBTS (75%)
0,8
CBS (80%)
1,2
ZDTP (70%)
2
TOTAL
263,2
Table 3. Rubber formulation.
The rubber was vulcanized into sheets of 20 cm x 20 cm with a 6 mm width. The state of cure of the sheets was controlled by solvent swelling analyses to give a state of cure close to 100% (Iso alpha close to 1).
Before the devulcanization treatment, the vulcanized sheets were milled in the HSM machine to get a small size of rubber, this is the optional step described on the previous section. The difference between this milling process and the devulcanization process is that the gap between the two cones is never smaller than 1 cm. The size distribution of the milled rubber, as measured by sieving, shows that 80 wt% of the material has a size between 1 and 20 mm in diameter, the remaining 20 wt% is smaller than 1 mm.
To study the motion of the material during processing, two other EPDM formulations were used. These formulations did not contain any carbon black and were identical to each other except for a colored additive. One formulation was red and the other one was green. Both formulations were vulcanized in the same conditions.
8
2.2. HSM machine
The HSM process is an industrial process that can produce batches of 20 liters of
devulcanized rubber per cycle. In order to better understand the process, a 2 liters prototype machine was designed and instrumented. The 2 liter denomination corresponds to the total volume available for the matter between the cones when the gap is at its minimum of 1 mm. The diameter of the cones for the 2 liters machine is 400 mm and the height is 270 mm. The increase and decrease of the gap is piloted by a hydraulic system that moves the stator up and down at a set speed.
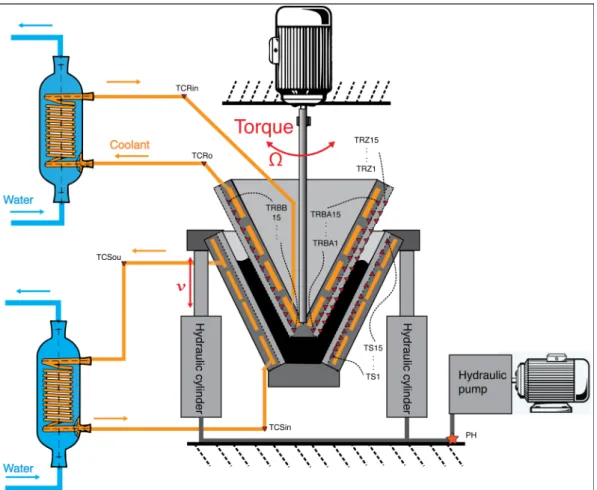
During the HSM process the rubber is self-heated. To avoid an uncontrolled rise of the
temperature of the rubber, a cooling system helps to dissipate the heat in the cones, as seen in Figure 4. The cooling system consists of two independent circulation circuits on the inside of the cones. The coolant in the circuit moves at a flow rate of 12 L/min. The coolant is cooled by a heat exchanger using the water from the public supply.
Figure 4. Schematic representation showing the different parts of the HSM machine.
9 • 60 thermocouples (type K with a steel protection sleeve and terminal head) are in contact with the rubber during the procedure. 60 holes were perforated in the cones. The 1 mm diameter thermocouples were glued inside the holes so only the measuring part of the sensor protrudes from the surface of the cones.
o 15 thermocouples in the stator (TS1-15) with a sampling period of 1.5 s (0.66 Hz). The acquisition is done in real time with an acquisition system by Agilent (34970A).
o 45 thermocouples in the rotor, 30 at the bottom of the grooves (TRBA1-15 and TRBB1-15) and 15 at the zenith of the grooves (TRZ1-15). The sampling period is 7 s (0.14 Hz). The acquisition is done in real time using a wireless modem connected to an acquisition system by National instruments (NI 9213) which is mounted on a turning platform. The systems on the platform are powered by a battery.
• 4 thermocouples that measure the temperature of the coolant at the entrance (in) and the exit (out) of both cones. The thermocouples are called TCRin and TCRout for the rotor and TCSin and TCSout for the stator.
It should be noted that since the body of the thermocouples, but not the measuring head, is in contact with the large mass of steel of the cones, their measurements are also affected by the
temperature of the steel. Although partly imbedded in the steel; these measurements appear to be very sensitive to the process and allow us to follow structural changes in the rubber material. An independent measurement of the temperature of the rubber was performed at the end of a test, using a portable thermocouple (Minitherm HI 8751 by HANNA instruments). A maximal difference of 7°C higher than the maximal temperature indicated by the thermocouples in the cones was detected. Temperatures measured by the series of thermocouples in the cones were thus considered as reliable.
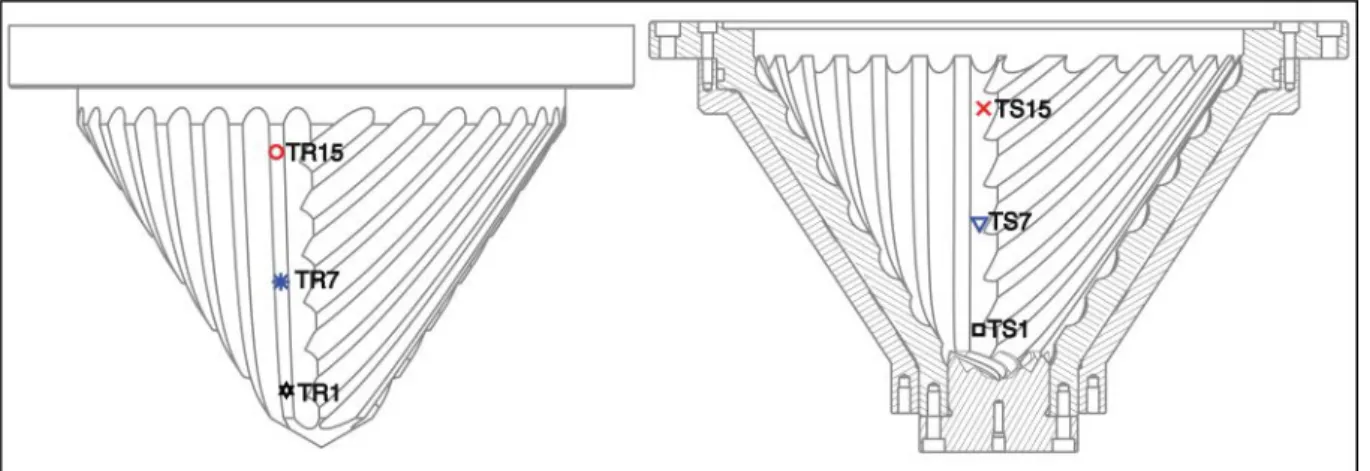
For sake of clarity the temperatures of only 6 thermocouples (3 in the rotor and 3 in the stator) are presented on the graphs, instead of all 60 thermocouples. The temperatures depicted by a series of 3 thermocouples were determined to be representative of the temperature variation along the corresponding full series of thermocouples. The positions on the cones of the six thermocouples used are displayed on Figure 5. The three thermocouples on the rotor are called TR1, TR7 and TR15 and
10 they are situated at the zenith of a groove. The three thermocouples on the stator are named TS1, TS7 and TS15 and they are at the bottom of a groove.
Figure 5. Position and denomination of the thermocouples in the rotor and in the stator.
The resistive torque applied to the rotor by the rubber is measured by a force sensor (Kistler strain gage load cell 4576A). With this measurement of the torque it is possible to calculate the instant power (P) (eq. 1) and the energy (E) (eq. 2).
𝑃 = 𝑇𝑜𝑟𝑞𝑢𝑒 x 𝞨 (1) 𝐸 = ∫ 𝑃(𝑡)𝑑𝑡0𝑡 (2)
Each test presented in this work was performed with 1 kg of rubber; therefore the energy consumed during the process corresponds to the specific mechanical energy in J/kg.
2.3. Characterization
Different techniques were used in order to characterize the rubber before and more specifically, after the HSM process:
• The treated rubber (HSM material) is heterogeneous in size. Sieving is applied to have an idea of the size distribution.
• Swelling in a good solvent was used to obtain information on the state of the rubber network and to determine the crosslink density.
• Sol fraction is used to determine the fraction of free chains.
• The plot of the sol fraction versus the crosslink density (analysis of Horikx (1958)) is used to determine whether the devulcanization process happens mainly by chain scission or by sulfur bridge rupture.
11
Sieving
The treated rubber (called HSM material in the following) is heterogeneous. It consists of small particles of a few hundred micrometers up to bigger pieces of a few centimeters in diameter,
depending on the conditions of the process. These bigger pieces can result from agglomeration of smaller particles or other phenomena, possibly re-vulcanization (to be discussed later on).
To study the heterogeneity in size of the HSM material the product was filtered in a vibratory sieve shaker (AS 200 basic, Germany). The filtering sizes of the 6 successive sieves that separate the material are: 5 mm, 1 mm, 800 µm, 500 µm, 250 µm and 100 µm.
Swelling
Swelling experiments using cyclohexane as a solvent were conducted in order to determine the crosslink density of all samples. Each sample was placed in the solvent for 72 h and the solvent was changed every 24 h. After 72 h the swollen mass of each sample was measured (𝑚𝑠). Then the samples were placed in a curing oven at vacuum at 70°C during at least 6h to clear the solvent inside. The mass of the dry samples was then measured (𝑚𝑑).
The crosslink density (𝜐) is calculated using the following equation (eq.3) proposed by Flory and Rehner (1943).
𝜐 = 𝑉𝑟0+𝜒𝑉𝑟02+𝑙𝑛(1−𝑉𝑟0)
𝑉𝑠𝑜𝑙�2𝑓𝑉𝑟0−𝑉𝑟01 3��
(3)
The presence of carbon black in the rubber formulation creates an overestimation of the polymer fraction of the swollen mass (𝑉𝑟0) and, consequently, of the crosslink density (𝜐). Kraus (1963) proposed the following equation (eq. 4) to correct the contribution of the carbon black:
𝑉𝑟0 𝑉𝑟 = 1 − Φ�3𝑐�1− �𝑉3 𝑟0�+𝑉𝑟0−1� 1−Φ (4) with Φ = 𝑉𝑐 𝑉𝑇= 𝑚𝑐 𝜌𝑐 𝑚𝑐 𝜌𝑐+𝑚𝑝𝑜𝑙𝜌𝑝𝑜𝑙 (5)
12 𝑉𝑟=𝑉𝑉𝑝𝑜𝑙𝐺 = �𝑚𝑑−𝑚𝑐� 𝜌𝑝𝑜𝑙 �𝑚𝑑−𝑚𝑐� 𝜌𝑝𝑜𝑙 +�𝑚𝑠−𝑚𝑑�𝜌𝑠𝑜𝑙 = 𝑚𝑠−𝑚𝑐 (𝑚𝑑−𝑚𝑐)+(𝑚𝑠−𝑚𝑑)�𝜌𝑝𝑜𝑙𝜌𝑠𝑜𝑙� (6)
The crosslink density of the non treated rubber (
𝑣
𝑖) was estimated using Eq. 3 to 6 to be:
𝑣
𝑖= 6.23x10⁻⁵ mol/cm3 (7)Sol fraction
A vulcanized rubber can be divided into two fractions, a gel fraction (g) and a sol fraction (s) as described in eq. 8. The gel fraction is formed by the crosslinked polymer chains which cannot be dissolved by a solvent. The sol fraction, on the other hand, consists of free polymer chains that are not linked to the network and can therefore be separated from the gel phase by a solvent. The
devulcanization of the rubber should lead to an increase of the sol fraction compared with the rubber original state before treatment.
𝑠 = 1 − 𝑔 (8)
Since rubber formulations are complex, other components such as the paraffinic oil can be extracted at the same time as the sol fraction. Some authors, for instance Yazdani et al. (2011) and Formela and Cysewska (2014), considered other components of the formulation, such as the paraffinic oil, part of the sol fraction. In this work the sol fraction only refers to the free polymer chains.
The most common method to measure the sol fraction s is the extraction in a Soxhlet apparatus as described by Loadman (1998). The extraction was conducted in two steps:
1. Extraction of polar components such as the free sulfur, accelerators, plasticizers and other low molecular weight substances. Over 24h in the Soxhlet using acetone as the solvent.
2. Extraction of the sol fraction using toluene as the solvent for 72h in the Soxhlet.
The mass of each sample was measured before the extractions (𝑚1) and after the two extractions (𝑚2).
Two kinds of sol fractions are discussed in this work: the sol fraction of the rubber before treatment (
𝑠
𝑖) and the sol fraction of the rubber after devulcanization (𝑠
𝑓).The calculation of
𝑠
𝑓 (eq. 9) is done using the method proposed by Edwards et al. (2016) which intends to remove the uncertainty added by the presence of oil in the formulation.13 𝑠𝑓=𝑚1(1−𝑒𝑚𝑝𝑜𝑙𝑁)−𝑚2 (9)
with,
𝑒𝑁=𝑚i1𝑚−𝑚i2
i1 (10)
The mass fraction of non-rubber components that can be extracted by Soxhlet extraction ( 𝑒𝑁) is calculated only for the non-treated rubber. For this work it was found that
𝑒𝑁= 0.2517 (11)
It is considered that 𝑠𝑓 ≫ 𝑠𝑖. The estimation of 𝑠𝑖 can be done in two different ways, either by extraction in Soxhlet or with the equations introduced by Horikx (1956) (eq. 12).
𝑠𝑖=(2+𝛾𝑖)−�(𝛾2𝛾𝑖𝑖2+4𝛾𝑖) (12)
where
𝛾
𝑖 is the crosslink index that represents the average number of crosslinks per polymer chain and is calculated using eq. 13.𝛾𝑖= 𝑣𝑖𝜌𝑀�����𝑝𝑜𝑙𝑛 (13)
where
𝑣
𝑖 is the crosslink density of the non-treated rubber calculated with the method previously described (eq. 3 to 6) and𝑀
����
𝑛 is the number average molecular weight of the original polymer chains. The𝑀
����
𝑛 value for the EPDM was considered to be as 150,000 g/mol (value found for an EPDM that was masticated for 30 minutes according to Baranwal and Jacobs (1969)).Verbruggen (2007) compared the two approaches to determine
𝑠
𝑖and concluded that the
Soxhlet method was preferable. Nevertheless, this result was obtained on a very simple oil-free rubber formulation. The addition of oil to the rubber introduces a high degree of uncertainty to the soxhlet extraction results. To avoid this problem 𝑠𝑖 can be calculated with Horikx’s approach. For the original non-treated rubber used in this work, the sol fraction was found to be:𝑠𝑖= 0.00674 (14)
Horikx analysis
Horikx's analysis is a technique that intends to differentiate reclaiming (random scission of main polymer chains) and devulcanization (breakage of crosslinked bridges) when samples are submitted to a devulcanization process. In this analysis, the status of the rubber network (level of
14 devulcanization) of a sample is characterized by its sol fraction (sf) and its relative reduction of the
crosslink density defined as:
Relative reduction of crosslink density = 1 − �𝑣𝑓
𝑣𝑖� (15)
where
𝑣
𝑖 and𝑣
𝑓 are the crosslink density of the rubber before and after devulcanization respectively.The values of these parameters are compared to two extreme situations: the random scission of main polymer chains (reclaiming) and the breakage of crosslink bridges. The location of experimental points (analysis of the treated rubber) relative to the two model curves (built with the data of the non-treated rubber) allows one to determine whether the process mainly occurs via random scission of main polymer chains or by the breakage of crosslink bridges, or by a combination of both mechanisms.
The model of chain scission in rubber networks was proposed by Horikx, (1956) and first used to study devulcanization by Verbruggen et al. (1999). Though the Horikx analysis is a qualitative method, not a quantitative one, it has become a widespread method for studying devulcanization, as it can be seen in several works (Meysami et al., 2017; de Sousa et al., 2017; Shi et al., 2013; Lv et al., 2016; Yazdani et al., 2011; Dijkhuis et al., 2008 among others).
The relationship between the relative reduction of crosslink density and the sol fraction in the case of random scission of polymer chains in the network is given by eq. 16:
1 − �𝑣𝑓
𝑣𝑖� = 1 − �
�1−𝑠𝑓1/2�2
�1−𝑠𝑖1/2�2� (16)
where
𝑠
𝑖 and𝑠
𝑓are the sol fraction of the rubber before and after devulcanization respectively.
The scission of crosslinks is described by eq. 17: 1 − �𝑣𝑓 𝑣𝑖� = 1 − � 𝛾𝑓�1−𝑠𝑓1/2� 2 𝛾𝑖�1−𝑠𝑖1/2� 2� (17)
where
𝛾
𝑓 is the crosslink index that represents the average number of crosslinks per polymer chain for the devulcanized rubber.𝛾
𝑖 and𝛾
𝑓 are calculated using eq. 10, the later one by replacing 𝑠𝑖 with 𝑠𝑓 and 𝛾𝑖 with 𝛾𝑓.Figure 6 represents the variation of the sol fraction versus the relative reduction of the crosslink density in relation with the two models, random main chain scission and crosslink scission.
15
Figure 6. Theoretical evolution of the sol fraction vs the relative diminution of the crosslink density for a process driven by main chain scission or by crosslink scission.
3. Results and discussion
3.1. Thermomechanical approach of the HSM process Role of the direction of rotation of the rotor
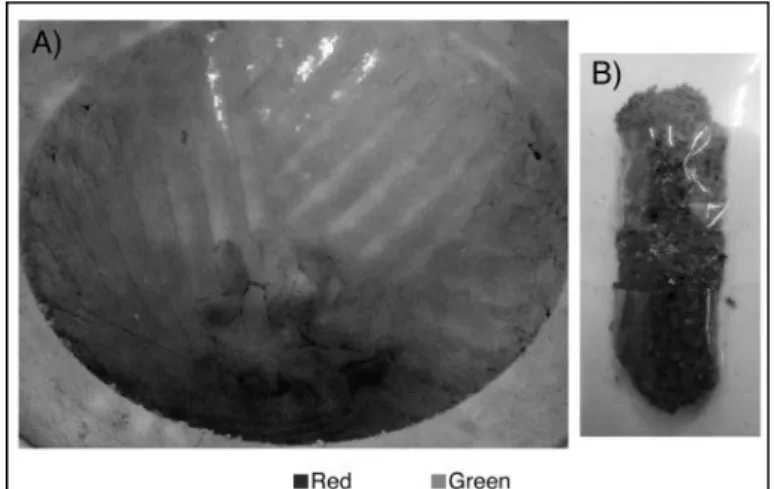
Two tests with colored EPDM were performed in order to investigate the role of the direction of rotation on the temperature increase of the rubber and on the movement of the rubber inside the cones during the process. These two tests were not intended to study the devulcanization process of the rubber. 500 grams of an already ground green colored EPDM rubber were placed at the bottom of the stator cone, as shown in Figure 7-A, then another 500 g of the same kind of EPDM but in red were laid over the green layer, Figure 7-B. The images were treated to facilitate the contrast between both colors.
16
Figure 7. Preparation of the test combining two colors of EPDM. The green EPDM was first set (A) followed by the red EPDM (B).
For these tests the HSM machine was first programmed to set the gap to 1mm and then to apply a constant rotation speed of 20 rpm for 60 seconds. A first test was performed in the CW direction. A second independent test was conducted on fresh material (similar preparation) in the CCW direction. The evolution of the temperature, power and the gap for each rotation test are shown in Figures 8 and 9. The initial temperature for both tests was around 14 °C.
17
Figure 9. Evolution of temperature, power, hydraulic pressure and gap during a colored test in CCW direction.
For the CW test it took around 13 s to reach the targeted 1 mm gap. This was more or less the moment when the hydraulic pressure reached a constant value and when the temperature measured by the thermocouples TR15 and TS15 started to increase up to respectively 32°C and 25°C at the end of the test. These thermocouples are the ones situated in the highest position of the cones as seen in Figure 5. The temperature measured by the other 4 thermocouples did not change and remained constant during the entire test. The temperature increase at the top of the machine shows that the rubber was quickly pushed up inside the cones. The hydraulic pressure went up to 100 bars and remained constant until the end of the test.
The second trial in the CCW direction showed different results. The time necessary to reach the 1 mm gap was 28 seconds, 15 seconds longer than the CW test. 200 bars of hydraulic pressure were necessary to close and keep the gap constant, 100 bars more than for the CW test. The temperature increase was measured by the thermocouples located in the low and mid sections of the cones (see Figure 5). The highest temperature, 44°C, was reported by the thermocouple TR1 (located at the bottom of the cone) at the end of the test, 12°C more than the highest temperature of the CW test (TR15). The temperature increase at the bottom of the cones is a clear indication that the rubber was pushed down to the center of the cones during the CCW rotation. The rubber motion towards the bottom of the cones in the CCW test led to a compression of the rubber and also to a higher hydraulic pressure. This pressure was necessary to set and keep the gap constant.
The largest temperatures were always measured by the thermocouples of the rotor. This is due to the fact that these thermocouples are located at the zenith of the grooves, see Figure 5, where
18 the shear rate and the friction with the rubber are at their maximum. In comparison, the thermocouples of the stator are all located at the bottom of the groove where the rubber seems to stagnate.
In comparison, the CCW rotation direction resulted in the application of larger hydraulic pressure, responsible for a larger temperature increase of the rubber (as measured by the
thermocouples). However, the power needed for the rotor rotation is higher for the CW rotation than for the CCW one. This is due to the position of the rubber relative to the center of the rotor. When turning CW the bulk of the rubber is in a higher position between the cones so the distance to the center of rotation increases and the torque needed to turn at the required speed also increases. When turning CCW the rubber is pushed down to the bottom of the cone and the distance to the center is shorter, so the torque and the power are lower.
The material at the end of both tests is shown in Figures 10 and 11. After processing it is commonly observed that part of the treated rubber adopts the shape of the grooves, referred to as fingers. The consistency and size of the fingers should be indicative of the process. The material from the CW test was mostly homogenous (one final color) and well mixed. However, some heterogeneous regions were found at the bottom of the stator cone. The fingers of this test (Figure 10-B) were small and could easily be broken down by hand into a fine powder. It was also noticed that 30 seconds after the beginning of the CW solicitation, some of the material started to come out of the upper part of the cones. On the other hand, The CCW test produces a more heterogeneous material. It was easy to see both initial colors (see Figure 11-B). The fingers were larger in size, more consistent due to the higher pressure that the rubber experienced during the process, and also not easy to break down. It was also easy to see that the green rubber stagnated at the bottom of the grooves whereas a mix of both colors was found at the bottom of the groove. It seems that the recirculation stated in the patent appeared to be only partially achieved with this geometry and set of parameters.
19
Figure 10. A) Material at the end of the CW test, B) “Finger” from this test.
Figure 11. A) Material at the end of the CCW test, B) “Fingers” from this test.
From these results it can be inferred that:
• The CW rotation pushes the rubber up and at some point out of the cones. A more homogeneous material seems to be obtained. The maximum temperature increase is recorded in the upper part of the machine,
• The CCW rotation pushes the rubber down to the bottom of the cones. The material endures a higher pressure leading to a larger temperature increase in the bottom part of the cones. The material is more heterogeneous.
• An alternation of steps in CW and CCW directions could be a way to limit the over-heating of the rubber material during the HSM process.
Effect of successive simple sequences
The usual devulcanization process applied in the HSM machine is more complex. Gap and rotation speed are varied. Both directions of rotation are used to treat the material. The total
20 on usual HSM procedure, three tests were designed based on the definition of a simple sequence combining a CW solicitation and a CCW solicitation. The three trials differ in the number of sequences: 4, 8 and 16 successive sequences. This number of sequences was fixed, based on previous tests, to investigate different states of treated rubber: 4 sequences, where the treated rubber was assumed to be undertreated; 16 sequences, where the treated rubber was assumed to be overtreated and 8 sequences, which is a condition between the two extremes. All tests were performed under the same conditions. Table 4 summarizes the different steps and the protocol is explained below.
1. Grinding step: The first action of the process consisted in working at a gap of 1.5 mm during 30 seconds at 20 rpm. The same grinding step was applied to all samples in order to start the sequences from the same initial state.
2. Manual mixing of the rubber by hand inside the cone stator for around 30s; This is done to improve the homogeneity of the material. Since this stage was done manually the duration of this step could slightly vary.
3. Treatment sequence: A sequence is a series of steps including the approach step (step 1 in Table 4) to set the gap to the working value followed by a CW step and then a CCW step (respectively steps 2 and 3 in Table 4). Only these last CW and CWW steps had an effect on the rubber treatment. In table 4 a positive value in the rotation speed corresponds to a CCW rotation and a negative value a CW rotation.
4. Manual mixing of the rubber.
5. Repeat of steps 3 and 4 until the material had the desired characteristics or until the rubber was submitted to the previously determined number of sequences.
Description
Step
Direction of
rotation
(mm)
Gap
Rotation
speed
(rpm)
Duration
(s)
Grinding
1
CCW
1.5
+20
30
Manual mixing
Sequence
Step 1
Approach
CCW
1
+20
30
Step 2
CW
1
-20
30
Step 3
CCW
1
+20
50
21
Temperature evolution
The evolution of the temperature for the thermocouples, the gap variation, and the rotation speed for the 4 sequence test are displayed in Figure 12 for the rotor and Figure 13 for the stator. The temperature scales are different in the two Figures, whereas all the other scales are kept identical. In both Figures the different stages of the treatment are also indicated. The different steps are labeled for the first sequence.
Figure 12. Temperature evolution of the three thermocouples located in the rotor with respect to the gap and rotation speed variation for the 4 sequence test.
Figure 13. Temperature evolution of the three thermocouples located in the stator in with respect to the gap and rotation speed variation for the 4 sequence test.
The first stage of the process, the grinding, displayed a rapid increase of the temperature in the rotor. TR1 increased from 18°C up to 78°C, that is 60°C increase (Figure 12), TR7 went up to
22 28°C and TR15 remained constant at 18°C (Figure 12). The location of the maximum temperature increase at the bottom of the cone compares well with what was seen in the previous section for a CCW rotation. By comparison, the temperature increase in the stator was much smaller (Figure 13). As in the colored trial, the smaller temperature increase in the stator relative to the rotor was probably due to the stagnation of rubber at the bottom of the cone. TS15 and TR15 measured no variation in temperature and remained at 18°C. These two thermocouples most likely never touched the rubber during the grinding stage.
The first hand mixing took around 50 s. During this time the temperature decreased but did not reach the level of the initial value. Almost no change in temperature was observed when the gap was closing. It is important to keep in mind that the decrease of temperature during the manual mixing is caused by the cooling fluid and the sudden loss of contact between the rubber and the thermocouples as the pressure that ensures a good contact disappears when the cones are separated, and does not correspond to a true cooling of the rubber.
The first CW step of the first sequence led to a temperature increase detected by TR15 and TS15 and no change of temperature for the four other thermocouples.
The second CCW step of the first sequence resulted in a continuous temperature increase for the thermocouples TR1 and TS1, located at the bottom of the cones, reaching 65°C and 35°C
respectively. The thermocouples on the mid-section detected a smaller increase in temperature. The thermocouples at the top of the cones saw a decrease of temperature thanks both to the cooling fluid and to the fact that they were not in contact with the rubber.
The temperature evolution of the thermocouples followed the tendencies observed in the colored trials for the CW and CCW solicitations even if the rubber was, in the present case, successively displaced upwards to the upper part of the cones and then pushed downwards to the bottom of the cones.
A similar evolution of the temperatures along the cones could be noticed for each sequence. During each one, the maximal temperature increase was recorded by TR1 and to a less extent by TS1 during the CCW step. The temperature of these thermocouples systematically decreased during the other steps. In comparison the maximal temperature increase was measured at the top of the machine
23 for TR15 and TS15 for the CW stages. During the CW steps thermocouples in the mid-section and at the bottom of both cones saw no variation. The magnitude of temperature increase dwindled with the number of sequences. This could be due to the decrease of the global size of the particles that compose the bulk of the rubber. As the particles get progressively finer, they should “flow” more easily in the grooves and the amount of shearing of the rubber in the gap should be reduced. More
arguments for this are to follow.
The evolution of the temperatures along the cones for the tests with 8 and 16 sequences are shown in Figures 14 and 15 respectively. Since similar temperature evolutions were recorded in the stator and rotor, although at different levels, only the temperatures from the stator are shown. The comparison of the three trials for the first 4 sequences shows very similar temperature variations. This attests to the good reproducibility of the process. Sequences 5 to 8 (Figure 14) continued the trend observed for the first 4. The temperatures measured by the thermocouples located at the bottom of the cones, TS1 and TS7, continued to decrease on average whereas TS15 was oscillating between 25°C and 30°C. Sequences 9 to 16 depict a change in the tendency. Temperatures recorded by TS1 and TS7 reached a minimum at around 21°C in the 8th sequence before increasing again up to 29°C for TS1 and 25°C for TS7. The temperature measured by TS15 continued to oscillate but increased slightly over time. The maximum temperature for the 1st sequence was 27°C and 34°C for the last one. This could partly be explained by the continuous self-heating of the rubber and the convection of heat along the steel since the cooling system did not permit the produced heat to dissipate instantaneously.
Figure 14. Temperature evolution of the three thermocouples located in the stator with respect to the gap and rotation speed for the 8 sequence test.
24
Figure 15. Temperature evolution of the three thermocouples located in the stator with respect to the gap and rotation speed for the 16 sequence test.
Power and energy evolutions
The power calculated with Eq. 1 for the 4 sequence test is displayed in Figure 16. The first stage of grinding implied an instant power consumption of about 10 kW. The manual mixing and the gap approach steps showed almost no power consumption. These steps had no effect on the material treatment. The first CW step led to a significant power consumption of 16 kW. In the CCW step, final step of the sequence, the power first decreased at the change of direction of rotation and then increased throughout the duration of the step to reach a value of 6 kW at the end of the step. As seen in the colored rubber tests the CW solicitation required more power. This pattern of higher power consumption in the CW step compared to the CCW one was true for all sequences. The maximum power consumption was recorded for the first sequence. The power consumption was lower in the next 4 sequences.
25
Figure 16. Evolution of the power consumption with respect to the gap and rotation speed variations for the 4 sequence test.
Figure 17 shows the power consumption for all three tests, which once again demonstrate the reproducibility of the process. There is a slight shift in the time scale due to the uncertainty of the duration of the hand mixing. It is also clear that the instantaneous power consumption passed through a minimum around 8 kW on average for the 3rd sequence and increased up to 15 kW in the 16th sequence for the CW steps. For the CCW steps, a minimum for the instantaneous power consumption occurred between the 5th and 8th sequences.
Figure 17. Evolution of the power consumption with time for all three tests.
Figure 18 depicts the specific mechanical energy calculated using Eq. 2 for the 16 sequence test. Error bars are indicated for the first four sequences and they represent the standard deviation around the mean value of the energy consumed during the CW and CCW steps for the first four sequences of the three trials. Figure 18 also reports the energy contributions for the CCW and CW directions. The energy consumption displays the same tendency as the power consumption: maximum for the 1st sequence, minimum around the 3rd and 4th sequences for the CW step energy, minimum
26 between the 4th and 8th sequences for the CCW steps, leading to a minimum of total energy between the 3rd and 5th sequences. It will be interesting to see whether these minima of energy can be correlated with the physico-chemical state of the treated rubber.
Figure 18. Evolution of energy consumption after each sequence for the 16 sequence test. The CCW and CW contributions are distinguished from each other.
3.2 Physico-chemical analysis of the HSM material
Particle size distribution
The size distribution of the rubber after HSM treatment was systematically determined by sieving. Results are shown in Figure 19. The greater the number of sequences, the larger the fraction of agglomerated material (presence of fingers). After 4 sequences the amount of rubber with particles bigger than 5 mm was around 27%, compared to 80% after 16 sequences. The larger amount of packed fingers could be at the origin of the increase of energy consumption seen in Figure 17 and 18. Larger particles must oppose more resistance to the rotation of the rotor. Therefore the power or energy consumption could be used during the process to get an indirect measurement of the current state of the rubber.
27
Rubber network after HSM treatment
The crosslink densities calculated for the rubber before treatment and for the different classes of sizes for the three tests are shown in Figure 20. The HSM process seems to have an impact on the reticulation density, showing a lower calculated crosslink density as particle size decreased.
Figure 20. Crosslink densities for the different classes of sizes of rubber after the three HSM treatments.
However it should be noted that during the swelling analysis the fact that the material is in the shape of small particles can add some uncertainty to the measurement. In the case of small particles, the swollen mass does not only correspond to the mass of the swollen rubber network but may also include solvent trapped in between particles by capillary forces. The experimental protocol was designed in order to minimize this effect but an impact might still exist.
Figure 21 displays the results of the Horikx analysis performed on samples from the three tests. Four samples were collected for each test and analyzed by swelling and by extraction. No sieving was applied before this analysis. The results are representative of all the material for a given condition: each point represents the mean value of the four collected samples and the error bar represents the standard deviation of the swelling measurements. The sol fraction for all three tests was around 5 wt %. Despite the quite large error bars, a tendency can be deduced. Passing from 4 to 8 sequences led to a decrease of the crosslink density, this is attested in Figure 21 by the fact that the mean value of the 8 sequences tests is farther to the right, and closer to the crosslink scission curve, than the 4 sequences mean value. In comparison, the mean value from the 16 sequence samples showed a higher crosslink density as it is situated farther to the left, closer to the main chain scission curve. It seems that extending the number of sequences had a negative effect on the treated rubber.
28
Figure 21. Horikx analysis for samples from the three HSM conditions. 1 −𝑣𝑓
𝑣𝑖 represents the relative decrease of
crosslink density during the HSM process (see Eq. 13).
3.3 Discussion: Relationship between the process parameters and the physico-chemical state of the rubber
Data on temperature and specific energy coupled with the evolution of the size distribution of the material and the physico-chemical state of the rubber allow us to propose a model to describe what happens to the material during the HSM process.
The rubber before the treatment has a homogeneous crosslink density as seen in Figure 22-A. During the HSM process the rubber is broken down into smaller pieces (referred to as “particles” in the following). As the particles are getting smaller, the specific surface area is more important. This can explain the lower crosslink density for the smaller particles shown in Figure 20. This breakage occurs mainly during the first sequence, as seen in Figures 17 and 18 where the energy for the first sequence is higher especially for the CCW step. Breakage of the rubber occurs during the rotor rotation when large rubber parts are entrapped in between two opposite grooves. The rubber breakage also leads to a self-heating of the material which is limited by the cooling system, as seen in Figure 12. As the average particle size decreases, the sol fraction increases. We assume that only the rubber at the surface of the particles is partially devulcanized whereas the crosslink density is nearly unchanged in the center of the particles (Figure 22-B). The effect of devulcanizing the surface of particles was referred as surface activation phenomenon by Zhang et al. (2007) and Myhre et al. (2012). In their works they described mechanical processes where the surface of ground rubber was devulcanized.
29
Figure 22. Schematic representation of the rubber network evolution during the HSM process.
As the HSM process is prolonged, small particles start to agglomerate into bigger chunks (fingers), as confirmed by the sieving test in Figure 19. These agglomerates are compressed further and further with the increased number of sequences and not even hand mixing can help to break them down. The creation of agglomerates can explain the energy increase seen in both steps but mainly in the CCW steps after the 10th sequence. The post-mortem analysis of these agglomerates shows that agglomerated particles cannot be separated during swelling. This suggests that particles were bonded by new crosslinks or by the reaction of free radicals, forming a new network (Figure 22-C).
4. Conclusion
A High Shear Mixing machine for small batches was successfully built and instrumented. Specific protocols were designed to better understand the exact role of the different variables (rotation speed, gap, direction of rotation, etc.) on the treated rubber. The instrumentation of the machine coupled to a systematic physico-chemical analysis of the treated rubber was fruitful to follow the different physical processes happening to the material. The main results of this work are the following:
• The combination of both directions of rotation in short duration sequences allowed the self-heating to be limited and the homogeneity of the treated rubber to be improved. However; some parts of the material stagnated at the bottom of the grooves. In the present work, we overcame this lack of homogenization by adding a systematic step of hand mixing. A redesign of the groove geometry should help to solve this problem.
• The treated rubber was broken down into smaller particles (down to a few hundred micrometers). The particle size evolved with the number of sequences with an initial decrease of the average size of the material followed by an increase of average size due to agglomeration of particles and a probable revulcanization of the rubber.
30 • The smaller particles seemed to have a substantially lower crosslink density compared to larger
pieces at equivalent treatment. However swelling measurements for small particles can be affected by an artifact due to additional trapped solvent due to capillary forces. Complementary analyses such as NMR (Nuclear magnetic resonance) will be used in the future in order to try to clarify this point (work in progress).
• A physical model was proposed in which the rupture of rubber parts leads to the formation of chemically active species on the fresh surface, as suggested by Myhre et al. (2012) and Zhang et al. (2007). Since smaller particles mean a higher specific surface area, then a lower average size of the material is desired. These active species seemed to be able to react again leading to a revulcanization of the rubber. The exact cause for the activation of this revulcanization phenomenon is not fully understood.
• The power and energy consumed during the process was correlated to the particle size
distribution of the treated material. When the average rubber particle size was lower, the energy needed for the treatment was also lower. This means that the specific mechanical energy can be used as an indicator of the progression of the process.
A final verdict on the physico-chemical state of the treated rubber will come from the mixing of different fractions of the HSM material with uncured rubber (of the same formulation) and subsequent vulcanization of these new mixes. A comparison of the results based on mechanical and
physicochemical analyses should clarify the physico-chemical state of the treated rubber. This work is already in progress and should be the subject of a forthcoming publication.
Acknowledgments
This work was executed in the framework of the project ECOTHER supported by BPiFrance and by Nantes Métropole. This work was partly funded by the ANRT (French National Association for Research and Technology) under the CIFRE agreement (Industrial Convention of Learning by Research) n° 2014_01017.
The authors are indebted to the two industrial partners involved in the project. The authors are grateful to the company REP International, more particularly but not only to M. Wolf and J. Teixeira for building the HSM machine, and for their professionalism and availability for this project. They are also
31 grateful to the company SACRED for providing and processing the rubber gum, more specifically to F. Chaniot for his help throughout the work, and to A. Potier and P. Dujon for their valuable insights.
References
Baranwal, K., Jacobs, H.L., 1969. Effect of mastication on molecular weight and molecular weight distribution of EPDM polymer and SBR. J. Appl. Polym. Sci. 13, 797–805.
doi:10.1002/app.1969.070130418
Brandrup, J., Immergut, E.H., Grulke, E.A., 2003. Polymer Handbook, 2 Volumes Set, Polymer Handbook. Wiley.
Brown, C., Mixer and method of mixing. Unlted States Patent 7,461,970 B2. Filed Dec. 9, 2002. Issued Dec. 9, 2008
Brown, C., Brown, D., Hodgkinson, N., Watson, W.F.. Treatment of cross-linked elastomers. International publication number WO 03/014206 A1, Issued. 20 February 2003.
De, S.K., Isayev, A., Khait, K., 2005. Rubber Recycling, 1st ed. Taylor & Francis, Boca Raton, FL. de Sousa, F.D.B., Scuracchio, C.H., Hu, G.-H., Hoppe, S., 2017. Devulcanization of waste tire rubber
by microwaves. Polym. Degrad. Stab. 138, 169–181. doi:10.1016/j.polymdegradstab.2017.03.008
Dijkhuis, K. a. J., Babu, I., Lopulissa, J.S., Noordermeer, J.W.M., Dierkes, W.K., 2008. A Mechanistic Approach to EPDM Devulcanization. Rubber Chem. Technol. 81, 190–208.
doi:10.5254/1.3548204
Edwards, D.W., Danon, B., van der Gryp, P., Görgens, J.F., 2016. Quantifying and comparing the selectivity for crosslink scission in mechanical and mechanochemical devulcanization processes. J. Appl. Polym. Sci. doi:10.1002/app.43932
Flory, P.J., Rehner, J., 1943. Statistical Mechanics of Cross‐Linked Polymer Networks I. Rubberlike Elasticity. J. Chem. Phys. 11, 512–520. doi:10.1063/1.1723791
Formela, K., Cysewska, M., 2014. Efficiency of thermomechanical reclaiming of ground tire rubber conducted in counter-rotating and co-rotating twin screw extruder. Polimery 59, 231–238. doi:10.14314/polimery.2014.231
Fukumori, K., Matsushita, M., 2003. Material recycling technology of crosslinked rubber waste. Tech J RD Rev Toyota 38, 39–47.
Horikx, M.M., 1956. Chain scissions in a polymer network. J. Polym. Sci. 19, 445–454. doi:10.1002/pol.1956.120199305
International Rubber Study Group (IRSG), 2016. Rubber Statistical Bulletin. Singapore. Kraus, G., 1963. Swelling of filler-reinforced vulcanizates. J. Appl. Polym. Sci. 7, 861–871.
doi:10.1002/app.1963.070070306
Loadman, J., 1998. Analysis of Rubber and Rubber-like Polymers. Springer Netherlands. Lv, X.-L., Huang, H.-X., Lv, B.-Y., 2016. Balancing mechanical properties and processability for
devulcanized ground tire rubber using industrially sized single-screw extruder. J. Appl. Polym. Sci. n/a-n/a. doi:10.1002/app.43761
Meysami, M., Tzoganakis, C., Mutyala, P., Zhu, S.H., Bulsari, M., 2017. Devulcanization of Scrap Tire Rubber with Supercritical CO2: A Study of the Effects of Process Parameters on the
Properties of Devulcanized Rubber. Int. Polym. Process. 32, 183–193. doi:10.3139/217.3290 Myhre, M., Saiwari, S., Dierkes, W., Noordermeer, J., 2012. Rubber recycling: chemistry, processing,
and applications. Rubber Chem. Technol. 85, 408–449.
Shi, J., Jiang, K., Ren, D., Zou, H., Wang, Y., Lv, X., Zhang, L., 2013. Structure and performance of reclaimed rubber obtained by different methods. J. Appl. Polym. Sci. 129, 999–1007. Verbruggen, M. a. L., van der Does, L., Noordermeer, J.W.M., van Duin, M., Manuel, H.J., 1999.
Mechanisms Involved in the Recycling of NR and EPDM. Rubber Chem. Technol. 72, 731– 740. doi:10.5254/1.3538830
Verbruggen, M.A.L., 2007. Devulcanization of EPDM rubber (Ph.D.). University of Twente, Twente, Enschede, the Netherlands.
Watson, W.F., Mixing. International publication number WO 96/33008, Filed 22 April 1996, Issued 24 October 1996.
Yazdani, H., Karrabi, M., Ghasmi, I., Azizi, H., Bakhshandeh, G.R., 2011. Devulcanization of waste tires using a twin-screw extruder: The effects of processing conditions. J. Vinyl Addit. Technol. 17, 64–69. doi:10.1002/vnl.20257
32 Zhang, X.-X., Lu, C.-H., Liang, M., 2007. Preparation of rubber composites from ground tire rubber
reinforced with waste-tire fiber through mechanical milling. J. Appl. Polym. Sci. 103, 4087– 4094. doi:10.1002/app.25510