HAL Id: hal-02505530
https://hal-mines-albi.archives-ouvertes.fr/hal-02505530
Submitted on 24 Mar 2020
HAL is a multi-disciplinary open access
archive for the deposit and dissemination of
sci-entific research documents, whether they are
pub-lished or not. The documents may come from
teaching and research institutions in France or
abroad, or from public or private research centers.
L’archive ouverte pluridisciplinaire HAL, est
destinée au dépôt et à la diffusion de documents
scientifiques de niveau recherche, publiés ou non,
émanant des établissements d’enseignement et de
recherche français ou étrangers, des laboratoires
publics ou privés.
Automated and quantitative analysis of plastic strain
localization via multi-modal data recombination
M.A. Charpagne, J.C. Stinville, P.G. Callahan, Damien Texier, Z. Chen, P.
Villechaise, Valery Valle, T.M. Pollock
To cite this version:
M.A. Charpagne, J.C. Stinville, P.G. Callahan, Damien Texier, Z. Chen, et al.. Automated and
quan-titative analysis of plastic strain localization via multi-modal data recombination. Materials
Charac-terization, Elsevier, 2020, 163, pp.1-16/110245. �10.1016/j.matchar.2020.110245�. �hal-02505530�
Automated and quantitative analysis of plastic strain localization via
multi-modal data recombination
M.A. Charpagne
a,⁎, J.C. Stinville
a, P.G. Callahan
a,1, D. Texier
c, Z. Chen
a, P. Villechaise
b, V. Valle
b,
T.M. Pollock
aaUniversity of California Santa Barbara, Santa Barbara, USA
bInstitut PPRIME, Université de Poitiers, CNRS, ENSMA, UPR 3346, 86962 Chasseneuil Cedex, France
cClément Ader Institute (ICA), Université de Toulouse, CNRS, IMT Mines Albi, INSA, ISAE-SUPAERO, UPS, Campus Jarlard, F-81013 Albi, France
Keywords:
High resolution digital image correlation Scanning electron microscopy digital image correlation Strain localization Discontinuities measurements Multi-modal data Slip bands A B S T R A C T
A multi-modal data recombination method that enables the automated, quantitative and statistical assessment of strain localization as a function of the microstructure is presented. It consists of merging high resolution digital image correlation (HR-DIC) datasets collected in a scanning electron microscope (SEM), with crystallographic data obtained from electron back-scattered diffraction (EBSD). As the data is typically gathered over large areas (about 1 mm2), this method enables the quantitative assessment of plastic strain localization over hundreds to
thousands of grains, yet with a spatial resolution of tens of nanometers. The data is treated in a hierarchical manner so that strain localization phenomena can be studied as a function of phases, texture and grain or-ientation. The use of discontinuity tolerant DIC codes, such as Heaviside DIC (H-DIC) in the present case, enables identification the active slip system associated with slip band discontinuities. Analyses conducted over thousands of bands in thousands of grains enable the quantitative assessment of fundamental plasticity laws. The cap-abilities of this method are shown through application to Ti-6Al-4V and Inconel 718 alloys.
1. Introduction
In most structural materials, strain is accumulated in a highly lo-calized manner, in the form of slip bands, shear bands or deformation twins [1]. The localization of deformation or/and plasticity is generally the precursor to damage in structural materials for relevant mechanical solicitations such as fatigue, creep, compression and tension. Therefore, understanding the localization processes in the microstructure as a function of loading is of prime interest. Transmission electron scopy (TEM) studies have been useful for understanding the micro-mechanisms of dislocation motion and slip band formation at the scale of one to a few grains [2,3]. However, their smallfield of view (FOV) does not permit a statistical assessment of the observations, nor the study of longer range effects such as grain neighbors and texture effects. Conversely, meso-scale experiments encompassing hundreds of grains and involving scanning electron microscopy (SEM) measurements coupled with electron back-scattered diffraction (EBSD) data, have in-deed revealed the importance of local texture, boundaries and neighbor effects on strain localization [4–9], which have later been captured in polycrystalline plasticity models. However, integration of nanometer
scale and meso-scale information remains a challenge for development of microstructure-sensitive property models. [10–14].
Slip trace analyses have been employed for assessment of the active slip systems in a variety of materials [5,7,9,15–19]. Manual band-by-band analysis coupled with EBSD has enabled crystallographic trends in terms of plastic localization to be examined as a function of the mi-crostructure. This process is time-consuming, and the analyses are usually limited to tens of grains. Digital image correlation conducted in the SEM (SEM-DIC) offers a good compromise between FOV and re-solution, as it possesses a sub-micron resolution over millimeter-scale FOVs. The investigated areas usually contain hundreds or thousands of grains. Recent progress in imaging techniques [20–25] have greatly improved the quality and accuracy of SEM-DIC data. High-resolution DIC (HR-DIC) can now capture slip localization induced by in-plane shearing to displacements as small as 10 nm. In parallel, improvements in the correlation algorithms, especially the implementation of dis-continuity-tolerant DIC codes where the opening associated with each band is systematically calculated, have facilitated the full identification of the active slip systems (plane and direction). The possibility of identification of the slip systems at the scale of individual grains has
⁎Corresponding author.
E-mail address:[email protected](M.A. Charpagne).
1Now at: US Naval Research Lab, Washington, DC, USA.
been demonstrated manually on selected bands [26]. However, the increasingly rich information gathered from DIC data makes its post-processing increasingly time-consuming. Manual analysis of each ob-served slip band in every single grain becomes more and more difficult when the strain increases (and consequently the number of slip bands) or when observations are carried out at several strains or after varying number of cycles. Statistical approaches and detailed mechanistic stu-dies which fully leverage the rich in-situ data require a multi-modal data merging method with accurate alignment of all the data types. EBSD scans are subjected to complex distortions that make merging of DIC datasets with orientation data difficult. One option is to collect all the data simultaneously with the same tiling: Chen et al. [27,28] have recently implemented a multi-modal data acquisition and recombina-tion method which consists of acquiring as many EBSD maps as DIC tiles and subsequently stitching them together, then correcting the re-maining distortion by applying a displacive transformation.
The present recombination method merges the richer information gathered by HR-DIC with EBSD data, using a single EBSD scan, in which distortions are corrected in one unique step. The microstructural fea-tures are represented in a hierarchical way for an easy automated and statistical assessment of the plastic localization as a function of the microstructure. In the present paper, a methodology for the systematic identification and quantification of the slip localization of thousands of individual slip bands as a function of the microstructure is presented. This procedure is demonstrated here for thefirst time using EBSD and DIC datasets on a titanium alloy and nickel base superalloy.
2. Materials and experimental methods 2.1. Materials
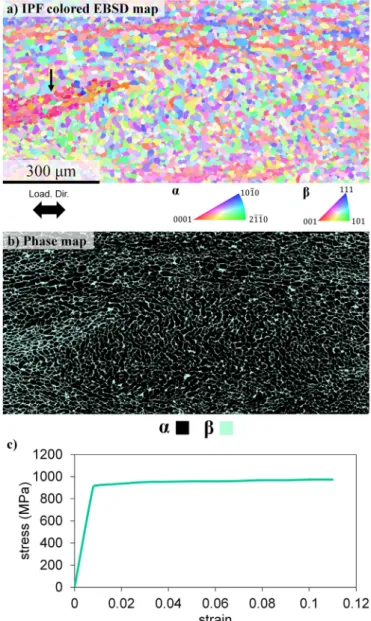
Two polycrystalline materials were used for this study: a Ti-6Al-4V (Ti64) titanium alloy and Inconel 718 nickel-base superalloy. Theα − β mill-annealed titanium alloy of composition Ti - 6% Al - 4% V was fabricated by Timet. It was subjected to a homogenization treatment consisting of 4 h at 926 °C followed by slow cooling at 30 °C/h. The microstructure of the investigated area is shown in Fig. 1. Fig. 1-a shows an EBSD map of the microstructure in IPF colors along the loading direction (horizontal). Among the 111,000 grains (mea-suring > 5 pixels) contained in the area, a (0001)-oriented micro-tex-tured region (MTR) is present. It was identified visually and is high-lighted by transparency over the rest of the microstructure (see arrow onfigure). The fraction and size of MTRs directly results from dynamic spheroidization that takes place during high temperature thermo-me-chanical processing [29–31].Fig. 1-b shows the phase map with theα phase in black and theβ phase in green; the β phase fraction is 4%. The stress-strain curve is shown in Fig. 1-c. Inconel 718 of nominal composition Ni 0.56%Al 17.31%Fe 0.14%Co 17.97%Cr 5.4%Nb Ta -1.00%Ti - 0.023%C - 0.0062%N (wt%) was subjected to a solution treatment of 30 min at 1050 °C followed by water quench that produced a lowδ-phase content with an average grain size of 62 μm. Over 900 grains are present in the region of interest. The grain structure is shown in the EBSD map of Fig. 2-a, the grains are equiaxed and exhibit no texture. The solution treatment was followed by a two-step precipita-tion hardening treatment (8 h at 720 °C and 8 h at 620 °C) to establish a high fraction of hardening precipitates [32]. Fig. 2-b shows a bright field transmission micrograph of the hardening γ″ precipitates that formed during ageing.Fig. 2-c shows the associated stress-strain curve. 2.2. Mechanical testing, sample preparation and microscopy
Tensile tests were performed at room temperature using a custom in-situ ± 5000 N stage within a ThermoFisher field-emission gun Versa3D dual-beam scanning electron microscope (SEM). Flat dogbone-shaped specimens with a gauge section of 1 × 3 mm were mechanically polished using diamond suspensions of diameters down to 1 μm,
followed by a 24 h step of vibratory polishing using a suspension of 0.04 μm colloidal silica particles. Electron Backscatter Diffraction (EBSD) measurements were performed with an EDAX OIM-Hikari XM4 EBSD detector using a step size of 0.2μm under an accelerating voltage of 20 kV, a beam current of 0.2 nA and using a 2 × 2 binning. SEM images and EBSD maps were acquired prior to and after deformation. Tensile tests were interrupted at macroscopic strain levels of 0.8%, 1.0% and 1.4%, that correspond to plastic strain levels of 0.2%, 0.4% and 0.8%. The macroscopic strain was measured in-situ usingfiducial markers located at both ends of the gauge section. The loading direction is horizontal on all the maps presented in all thefigures. The speckle pattern for DIC measurements was obtained by deposition of gold na-noparticles of average size of 60 nm, according to the procedure de-veloped by Kammers et al. [20]. Subset sizes of 31 × 31 pixels (1044 nm × 1044 nm) and 27 × 27 pixels (910 nm × 910 nm) with a step size of 3 pixels (101 nm) were used, in accordance with the number of speckle grains per subset recommended by Sutton [33].
Fig. 1. Microstructure of the Ti64 material: a) IPF colored EBSD map along the loading direction (horizontal, indicated by the arrow), a MTR is highlighted by transparency (see arrow) b) Phase map showing theα and β phases, c) True stress-true strain curve. (For interpretation of the references to color in this figure legend, the reader is referred to the web version of this article.)
2.3. Scanning electron microscopy imaging conditions for high resolution DIC
SEM images sets were acquired before loading and after unloading from plastic deformation. In order to minimize the distortion errors inherent to SEM imaging [20,21], SEM parameters were chosen fol-lowing the guidelines of Kammers and Daly [20,21] and Stinville et al. [23]. High magnification images were taken at horizontal field widths (HFWs) of 138μm, which reduces imaging distortions. Large electron beam spot sizes and large dwell times (20μm, 6 min per image), were used to reduce drift distortions. In addition, low acceleration voltages of 5 kV were used to minimize charging effects and further reduce drift distortion. Short working distances of 5 mm were used to obtain higher spatial imaging resolution and electron beam stability. A National In-strument™ scan controller and acquisition system (DAQ) were used to control beam scanning in the FEI microscope. This custom beam scanner removes the SEM beam defects associated with some micro-scope scan generators and is detailed elsewhere [23,24].
2.4. Heaviside-DIC for plastic localization measurements
The process of digital image correlation is performed using a novel discontinuity-tolerant DIC code. The Heaviside-DIC method [26,34] provides quantitative measurements of plastic localization via the sys-tematic detection of the physical in-plane displacement induced by slip.
An Heaviside function is used to detect discontinuous displacements within the displacementfield. The procedure is outlined in more details elsewhere [26,34]. Of most interest, during plastic deformation of polycrystalline materials that involve slip, the Heaviside-DIC method provides both the in-plane slip vector [26] and opening angle at each point of the investigated region. The norm of the mentioned vector quantitatively describes the intensity of the local displacements induced by slip. The direction of the vector enables direct identification of the active slip system [26]. Once the Burgers vector associated to the slip band is known, the out-of-plane component of the slip vector can be calculated. The experimental procedure and DIC code provide the de-tection of slip with a spatial resolution of 33 nm and amplitude re-solution of few nanometers.
3. Numerical framework for multi-modal data recombination The process of multi-modal data (EBSD and H-DIC) recombination is described in this section, with an example workflow on the Inconel 718 material.
3.1. Pre-processing of the data 3.1.1. EBSD
An EBSD map of the region of interest (ROI) is typically acquired before deformation. Small non-physical grains (< 5 pixels) are removed
Fig. 2. Microstructure of the Inconel 718 material: a) IPF colored EBSD map along the loading direction (horizontal, indicated by the arrow), b) Brightfield TEM micrograph showing the hardeningγ″ precipitates, c) True stress- true strain curve (interrupted test). (For interpretation of the references to color in this figure legend, the reader is referred to the web version of this article.)
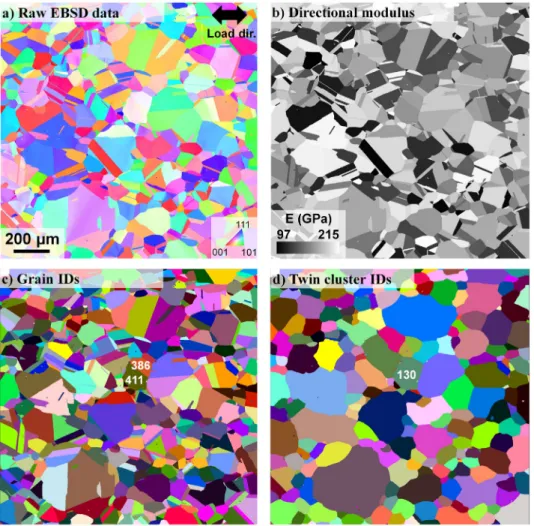
from the data, as well as non-indexed regions and each grain is then assigned its average orientation. For the Inconel 718 dataset, the Grain Dilation and Neighbor Orientation Correlation of the TSL OIM package were used.Fig. 3shows the pre-processed EBSD data. The EBSD map colored according to the Inverse Pole Figure (IPF) colors in the loading direction is presented inFig. 3-a. The grains were segmented using a 10° tolerance angle. They are shown inFig. 3with random coloring. Using the average grain orientation, the directional modulus along the loading direction of each grain was computed. The modulus was cal-culated using the elastic properties of the single crystal as reported by Martin et al. [35]: c11= 259.6 GPa, c12= 179.0 GPa, c44= 109.6 GPa.
Those values lead to a Young modulus E = 199 GPa for a single crystal of⟨001⟩ direction, a Poisson's ratio μ = 0.338 and an Zener anisotropy coefficient of 2.7. Those values are consistent with other sets of elastic constants, obtained from ultrasonic measurements by Haldipur et al. [36] or measurements on polycrystalline material by Jothi et al. [37], where an anisotropy coefficient of 2.7 is also found. The resulting stiffness map is presented inFig. 3-c. The annealing twin boundaries (defined as 60° rotations around a ⟨111⟩ direction) were identified using the Brandon criterion in order to segment the individual twin clusters. A map of the individual twin clusters with random coloring according to their ID is shown inFig. 3-d. There are 910 grains and 324 twin clusters in this dataset.
3.1.2. H-DIC
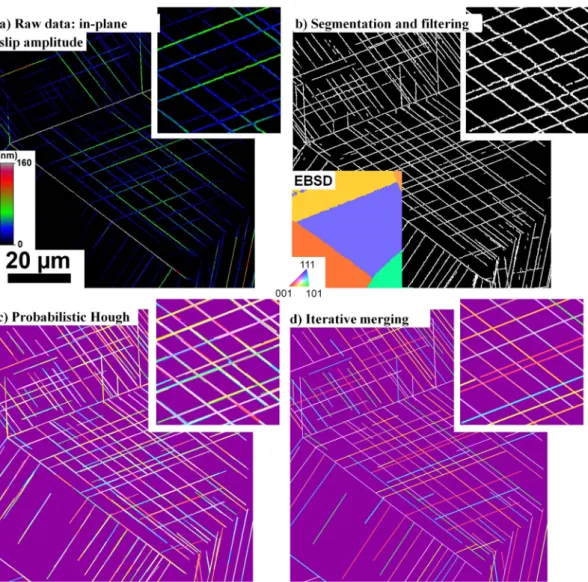
Raw H-DIC data consists of maps of intensity values of the norm of in-plane slip vector, angle, shearing, sliding calculated at each pixel. A
typical example of a raw H-DIC map is shown inFig. 4-a, colored ac-cording to the local amplitude of the in-plane slip vector. The shape of the slip bands clearly appears on this map, though the slip bands are not segmented as objects at this point. To do so, the data isfirst binarized using a set threshold value, usually the noise associated with HR-DIC (about 10 nm). The resulting (binarized) map is shown in Fig. 4-b. Then, a probabilistic Hough transformation (probabilistic Hough func-tion from the skimage python package) is applied to the thresholded image to detect the linear features. The parameters of the probabilistic Hough transformation, including the line length are adapted on the case-by-case analysis, according the length of the slip bands. The result of this transformation is shown onFig. 4-c, where the lines are ran-domly colored according to their number ID. Each line is defined by its inclination angle (to the horizontal direction) and endpoints. At this stage, more than one line is detected in each slip band. For a more realistic identification of the slip bands, an iterative merging of the lines is carried out. This process consists infinding the fragments of each slip band and merging them together. To do so, the distance between bands of similar inclination angles is calculated. Co-linear lines (with a tol-erance angle of 2 degrees) that possess an overlap of three or more pixels are merged together. Iterative merging goes on until the number of bands between two successive steps remains constant. Visual in-spection was carried out to assess the realistic aspect of the individual slip bands. Thefinal ID map of the slip bands is shown inFig. 4-d. A total of 2246, 3381 and 4330 individual bands were segmented at plastic strains of 0.2, 0.4 and 0.8% respectively.
Fig. 3. Maps generated from pre-processing of the EBSD data, in the Inconel 718 material: a) IPF colored map, along the loading direction, b) Directional modulus from average orientations, c) Grain IDs, d) Twin cluster IDs. (For interpretation of the references to color in thisfigure legend, the reader is referred to the web version of this article.)
3.1.3. Twin boundaries
A binarized map of the twin boundaries was generated from the EBSD data, following the criteria described inSection 3.1.1. The in-dividual twin boundaries (straight lines) were identified using the procedure described inSection 3.1.2. There are 748 twin boundaries in the Inconel 718 dataset.
3.2. Data recombination
3.2.1. Correction of the distortions in EBSD data
Relative to H-DIC data, EBSD data is subject to more complex dis-tortions that are induced by the physical positioning of the stage, the magnetic lenses of the microscope as well as charging phenomena that occur during scanning [38–41]. The resulting distortion can be modeled by a polynomial function of degree 3, which shape is shown in Eq.(1). This degree has been shown to enable compensation of non-linear as well as space-time distortion [41]. Characteristic microstructural fea-tures such as triple junctions, twin and grain boundaries are used as control points, picked manually. The coefficients ck, n−kx, y of this
function were determined using a least-squaresfitting method (avail-able in the Sklearn Python package). The EBSD data is interpolated onto the H-DIC grid, which is used as the reference.
∑
∑
∑
∑
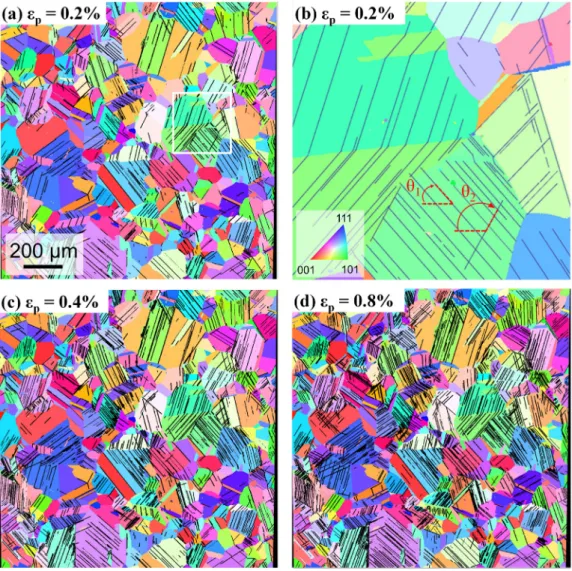
⎛ ⎝ ⎜ ⎜ ⎞ ⎠ ⎟ ⎟ = ⎛ ⎝ ⎜ ⎜ ′ = ′ = = = − − = = − − f x y x c x y y c x y , n k n k n kx k n k n k n k n k y k n k 0 3 0 , 0 3 0 , (1)Fig. 5shows the segmented slip bands from the H-DIC data, over-lapped to the IPF-colored EBSD map, for all three deformation steps. Fig. 5-a, c shows the good matching between H-DIC and EBSD data over the whole region of interest (ROI).Fig. 5-d shows the sub-grain scale accuracy of the recombination, as the endpoints of the slip bands fall on the grain and twin boundaries.
3.2.2. Properties assignment
Once all the data is aligned on the same grid, the different features are assigned their properties, resulting in the data structure presented in Fig. 6. The features of interest are the individual slip bands, the grains, the twin clusters and the twin boundaries. The intrinsic prop-erties of each feature are listed in black. The length and inclination angle of each band and twin boundary are computed using its co-ordinates, using the opening convention shown inFig. 5-b (see the opening direction of theθ1,θ2angles).
The cross-correlated properties between the features are then as-signed; these are highlighted in blue inFig. 6. For example, in order to find the twin cluster of grain 411, the coordinates of all the pixels that belong to this grain (seeFig. 3-b) are listed and the values of the twin
Fig. 4. Segmentation and indexing of the individual slip bands: a) Raw data colored according to the amplitude of in-plane slip, b) Segmented image obtained by thresholding andfiltering, c) Individual lines after probabilistic Hough transform, one color per band, d) Slip bands after iterative merging, one color per band. (For interpretation of the references to color in thisfigure legend, the reader is referred to the web version of this article.)
cluster ID on the corresponding map (Fig. 3-d) are read, along with their number of occurrences. The twin cluster that has the most pixels in this list is the hosting twin cluster. In the shown example, the hosting twin cluster of grain 411 is 130. It is also the hosting twin cluster of grain 386. In a similar manner, a hosting twin cluster is assigned to each
twin boundary and a hosting grain is assigned to each band at each step. Typically, over 99% of the pixels of each band belong to one grain while a few pixels overlap with neighboring grains. The goodness of this value depends on the quality of segmentation of the features and the cor-rection of the distortions. A tolerance angle of 5° is used to detect the
Fig. 5. Overlap of the segmented slip bands and IPF colored EBSD map after merging, in the Inconel 718 material. a)ϵε=0.8%, b) area framed in white on a), c) ϵε=1.0%, d) ϵε=1.4%. (For interpretation of the references to color in this figure legend, the reader is referred to the web version of this article.)
Fig. 6. Structure of the data after the recombination process. Such data is generated for each phase of the material. (For interpretation of the references to color in thisfigure, the reader is referred to the web version of this article.)
parallelism between the slip bands and twin boundaries that belong to the same twin cluster. Using these tools, the different number IDs of each band throughout the deformation steps are also retrieved.
3.3. Full identification of the slip system associated with each band 3.3.1. Slip plane
Since the hosting grain of each slip band as well as its Euler angles are known, the angles of the {111} plane traces the surface plane of the sample can be calculated, using the same angular convention as for the
Fig. 7. Slip system assignment procedure, example in Inconel 718: a) IDs of the bands of interest (249 and 1079) at a plastic strain of 0.2%, b) H-DIC map colored according to the norm of in-plane slip vector, c) corresponding IPF colored EBSD map with {111} plane traces overlapped, d) H-DIC map colored ac-cording to the angle of in-plane slip vector, e) Distribution of the values of the angle of in-plane slip vector for both bands of interest (following the color code of -a) and theoretical angle values corre-sponding to the possible slip directions associated to each slip plane. Arrows indicate the values of the angles that occur the most frequently along the bands of interest. (For interpretation of the refer-ences to color in thisfigure legend, the reader is referred to the web version of this article.)
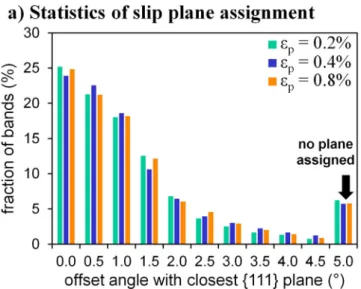
slip bands. A graphical example of slip system assignment is shown on Fig. 7. The map of the band IDs is shown inFig. 7-a, and the two intense bands of interest are highlighted: 249 and 1079 (seeFig. 7-b). The as-sociated ESBD map colored in IPF colors is shown inFig. 7-c: both bands belong to the same grain, 418, which {111} plane traces are plotted in red. The misorientation angles between each slip band within the grain and each of the four slip traces are calculated. The value of the lowest misorientation angle is then reported, as well as the (h,k,l) in-dices of the corresponding slip plane.Fig. 8-a shows the distribution of such misorientation angles, for all the bands in the microstructure and at each applied strain. Over 75% of the bands are parallel to a {111} slip plane, with a 2° tolerance; and 95% of the bands for a 5° tolerance. A tolerance of 5% was thus used for the slip plane assignment. In ad-dition, if two slip planes fulfill the assignment conad-dition, then no plane is assigned to the band. This represents about 5 to 6% of the bands (highlighted by the arrow onFig. 8-a). In the shown example, the active slip plane of band 249 is (111), that of band 1079 is(111).
3.3.2. Slip direction
As already demonstrated in [26], the slip direction associated with each band can be identified from the Heaviside DIC data, and the opening angle in the reference frame of the slip band is also measured. Knowing the average opening per band is critical for determining the slip direction among the three⟨110⟩ candidates.
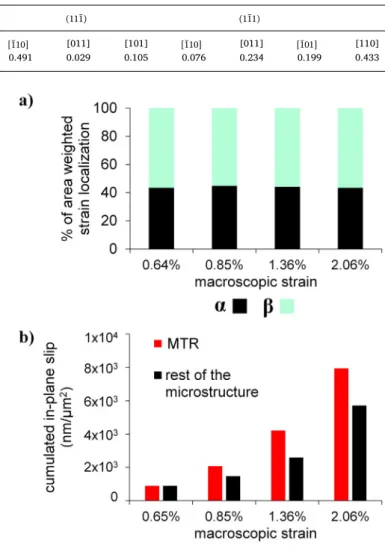
Fig. 7-d shows the H-DIC map colored according to the angle of the in-plane slip vector. This value ranges from−180° to +180°. In the local reference base of the slip band, a positive γ angle > 90° is equivalent to an angle of 180−γ. A negative angle also describes the same direction than −γ (seeFig. 16in Appendix). Using those con-versions, the list of angle values associated with each band is created. The histogram of angle values is then plotted with a binning width of 2° and the most frequent value is reported. This value is then compared to the theoreticalγ angle of all three available directions. If the measured angle is within ± 4° of the theoretical angle of a candidate direction, this direction is assigned to the band. If two slip directions fulfill this condition, then none is assigned. This procedure is slightly different than that described in [26]. As an example, the distributions corre-sponding to bands 249 and 1079 are shown inFig. 7-e. They both ex-hibit a peak at the 0–2° bin. The γ angle values corresponding to the three available directions associated to each slip plane are reported on the same histogram. The peak of band 249 corresponds to the[110] direction in the (111) plane while that of band 1079 corresponds to the [011] direction in the(111)plane. The values of the Schmid factors in this grain are listed inTable 1. Interestingly, while the slip system of band 249 corresponds to the one of highest Schmid factors in this grain (0.49), that associated with band 1079 is relatively low (0.23). It is worth mentioning that band 1079 has developed parallel to a twin boundary. The influence of the local microstructure on the development of slip bands is discussed in details inSection 4.2.Fig. 8-b shows the statistics associated to the assignment of the slip direction. At each deformation step, about half of the bands are missing a direction. This is due to the scatter of the angle values along one band, as shown inFig. 7 -e and th-e low tol-eranc-e on th-e d-eviation to th-e th-eor-etical angl-es. This can be improved by cross-correlation as described in the following section.
3.3.3. Extrapolation of the missing slip planes and directions
As each slip band develops following a unique slip system, neither its slip plane nor direction should change with increasing deformation (for this monotonic tensile test). Since the IDs of a band throughout the steps are known (see Section 3.2.2), the missing information (plane and/or direction) of a given band at a given step can be retrieved if it was successfully assigned in other steps. This depends on the accuracy of the band segmentation and the scatter of the angle values in the band. The effect of this recombination procedure is shown inFig. 8-c. Initially, about 90% of the bands were assigned a slip plane. The
Fig. 8. Statistics of plane and direction assignment: a) distribution of the offset angles between the slip bands and their closest {111} plane for all deformation steps, b) distribution of the offset angles between the calculated opening of the bands and their closest〈110〉 direction, c) effect of recombination of the planes and direction based on the identification of each band ID at each step.
recombination then allowed for the successful assignment of a plane to 100% of the bands for two of the deformation steps (ε = 0.2% and 0.8%), and 98% of the bands for the other one. As already mentioned, about 50% of the bands were initially missing a slip direction. The re-combination dramatically increases this value, as 80% of the bands are assigned a direction in thefinal dataset. The second deformation step (ε = 0.4%) is the least successful for both plane and direction assign-ment. This can be attributed to a lesser accurate segmentation of the bands at this step.
4. Results and discussion
Using the procedures outlined inSection 3, the plastic behavior of the two most common aerospace alloys, Ti-6Al-4V and Ni-Fe-base su-peralloy 718 is examined.
4.1. Ti-6Al-4V
4.1.1. Strain localization at the meso-scale
In the Ti-6Al-4V material, the distribution of strain localization for theα and β phases was studied. Based on the map shown inFig. 1-b, the accumulated intensity of slip in each phase divided by the area of the phase was calculated. The distribution of strain localization in both phases is shown inFig. 9-a. When normalized by the area fraction of the phase, both phases exhibit similar intensity of strain localization. A similar observation was made by Zhang et al. [19] using SEM images in the same alloy under similar mechanical solicitations. This behavior could be explained by the fact that most slip events initiate in theα phase and are then easily transmitted to theβ phase, due to the high number of slip systems available in the BCC lattice. Along those lines, Zhang et al. have also reported that basal slip easily transmits between α grains even with the presence of β phase at their boundaries.
The strain localization in the MTR compared to the rest of the mi-crostructure has also been analyzed. The accumulated intensity of in-plane slip normalized by the area of each phase is presented inFig. 9-b. For all the deformation steps, the slip activity is higher in the MTR, compared to the rest of the microstructure. This observation is con-sistent with previous observations by Bridier et al. [5], Zhang et al. [19], Lunt et al. [42] and Hemery et al. [43], who noted that (0001)-oriented MTRs increases the heterogeneous character of the stress-field at the meso-scale. This was confirmed by modeling work, using a fast Fourier transformation crystal plasticity model (CP-FFT), with varying volume fractions of MTRs [44,45]. Slip has also been reported to be activated earlier in MTRs having predominant (0001) orientation, re-gardless of the slip system [9,44]. Interestingly, the present analysis also shows that the slip localization in the MTR becomes more and more intense as the strain increases, compared to the rest of the micro-structure. This is expected to ultimately result in crack initiation in these locations [46,47]. Present results provide further proof of the intensity of strain localization in these regions, enabled by the auto-mation of the post-processing of DIC and EBSD data at several de-formation steps.
4.1.2. Active slip systems
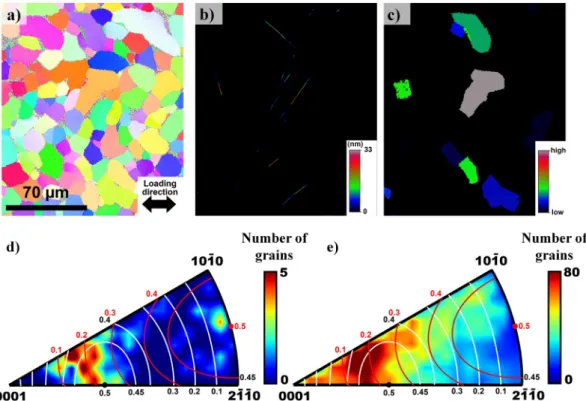
The partitioning of strain localization at the grain scale is re-presented in a similar manner than in the previous section:Fig. 10-a and -b show the IPF colored EBSD map and the corresponding H-DIC map colored according to the norm of the in-plane slip vector. For each
α grain of the dataset, the accumulated intensity of slip is calculated by summing all the values of the pixels that belong to that grain. The value of the total slip intensity per grain is then mapped as shown inFig. 10-c. The central grain is the one of highest intensity, colored in grey on Fig. 10-c. The comparison of the IPF colored EBSD map (Fig. 10-a) and the Schmid factor iso-lines (black) shown onFig. 10-d indicates that it is favorably oriented for basal slip. So are the two other intense grains of this area, colored in bright green onFig. 10-c. This calculation has been done for all 111,000 grains. The 400 most intense grains have then been listed and plotted in the standard triangle. A heatmap colored according to the number of points per region of the triangle is shown onFig. 10-d. The iso-lines of Schmid factor for basal and prismatic slip are shown in white and red respectively. Two hot-spots are observed: the most in-tense one corresponds to the grains that are favorably oriented for basal slip, the second one corresponds to the grains oriented for prismatic slip. This trend is consistent with previous observations from Echlin et al. [9], Bridier et al. [7], Castany et al. [2,3], Hemery et al. [43], who all report the dominance of basal then prismatic slip in this material. The grains present in thefirst pole all exhibit a Schmid factor μ > 0.35 for basal slip. However, they are not quite located in the center of the μ = 0.5 zone, as most of them are actually shifted towards the (0001)
Table 1
Schmid factors of grain 418 (fromFig. 7).
{111} plane (111) (111) (111) (111)
⟨110⟩ direction [011] [101] [110] [011] [101] [110] [011] [101] [110] [011] [101] [110] Schmid factor 0.124 0.257 0.134 0.328 0.163 0.491 0.029 0.105 0.076 0.234 0.199 0.433
Fig. 9. Strain localization in the Ti-6Al-4V material: a) distribution of the strain localization betweenα and β phases: the total intensity of slip over the whole ROI, normalized by the area is computed (in nm/μm2), the fraction of the total
slip per phase is plotted, b) strain localization in the macro-zone compared to the rest of the microstructure: the cumulated intensity of in-plane slip over each zone (MTR and non-MTR) is calculated (in nm), divided by the area of the region (inμm2).
pole. This shift has been observed by Bridier et al. [7] for secondary fatigue cracks, and attributed to the elastic anisotropy of the material. Despite the absence of macro-texture, and thus an equal amount of grains favorably oriented for basal, prismatic and pyramidal slip, the majority of the most intensely deformed grains have undergone basal slip. This trend enhances at higher strains, as shown on the plot of Fig. 10-e (ε = 1.36%). Values for the 40,000 most deformed grains are reported on this figure and the basal slip activity is even more pro-nounced. However, the hot-spot of strain localization spreads over re-gions of lower basal Schmid factor but accompanied by high elastic modulus.
4.2. Inconel 718
4.2.1. Slip bands location and annealing twin boundaries
Previous research on the Ni-base superalloy Rene 88 DT reports that fatigue cracks nucleate at regions of high strain localization in bands that are parallel and close to some specific annealing twin boundaries, and favorably oriented for parallel slip [8]. Visual inspection ofFig. 5-a suggests that many of the early bands also formed parallel to annealing twin boundaries in the present alloy. Quantitative analyses reported in Table 2 confirm this hypothesis, with the number fraction of bands parallel to twin boundaries as high as 72% for a plastic strain of 0.2%. This fraction then decreases as the strain increases, by the additional formation of slip bands further from twin boundaries.Fig. 11 shows some characteristics of the bands that are parallel to twin boundaries.
Fig. 11-a shows the distribution of the distances between the bands and their parallel twin boundary. The results are normalized by the total number of bands parallel to twin boundaries at each step (e.g. 0.72 × 2246, 0.47 × 3381 and 0.36 × 4330 bands respectively). The two high peaks at plastic strains of 0.2% and 0.4% reveal that most of the bands that are parallel to twin boundaries are also located very close to them, within a 2μm distance typically. As the strain increases, the new bands that develop are more distant to the twin boundary. Fig. 11-b and -c show the average norm of the in-plane slip vector of such bands, as a function of the distance between the band and its parallel twin boundary. Most of the intense bands (high value on the y-axis) are located close to the twin boundary, within a 2μm distance. This trend diminishes onFig. 11-c and d though is still visible. At a plastic strain of 0.8%,Fig. 5-d shows that more bands have developed in the microstructure that have no specific relationship with twin boundaries (neither parallel nor close), as several slip systems are active in most of the grains.
4.2.1.1. Bands that are parallel to twin boundaries. From this point, the bands were separated into two categories. Previous work by Stinville et al. [8,48–51] and Liu et al. [52] has indicated that fatigue cracks will preferentially develop along the long twin boundaries that possess a high Schmid factor and separate crystals of very different elastic modulus. The hierarchical structure of the merged dataset enables isolation of the properties of the twin boundaries which possess parallel slip bands nearby.Fig. 12summarizes both the characteristics of the slip bands that are parallel to twin boundaries (length and intensity) and the characteristics of the twin boundaries themselves. Each point corresponds to a slip band that is parallel and close to a twin boundary. On the left column, the coordinates of this point corresponds to the maximum Schmid factor along the {111} plane of the twin boundary (x-coordinate) and the difference in elastic modulus across the twin boundary (y-axis). Each point is colored according to the average
Fig. 10. Strain localization at the grain scale in the Ti-6Al-4V material: a) IPF colored EBSD map of a subset of the microstructure, b) corresponding H-DIC map colored according to the norm of the in-plane slip vector, c) EBSD map colored according to the cumulated intensity of in-plane slip per grain, d) IPF heatmap colored according to the number of grains that exhibit the most important strain localization (100 most intense grains) at 0.64% strain. e) Same map for a strain of 1.36% representing the 40,000 most deformed grains. Schmid factor iso-lines for basal slip are highlighted in white while those for prismatic slip are shown in red. (For interpretation of the references to color in thisfigure legend, the reader is referred to the web version of this article.)
Table 2
Number fraction of slip bands parallel to annealing twin boundaries as a function of plastic strain.
Plastic strain 0.2% 0.4% 0.8% Fraction of slip bands parallel to twin boundaries 0.72 0.47 0.36
intensity of slip and sized according to the length of the slip band. On the left column, the points are clustered in two zones which correspond to the twin boundaries that either possess a very high Schmid factor (> 0.45), or those that separate two crystals of very high elastic modulus difference but not an especially high Schmid factor. The dashed line shows the theoretical upper bound of the combination of the elastic modulus difference and Schmid factor. Many of the points are located along this line, especially the most intense (long and/or intense slip bands). FromFig. 12-a to -c, the number of bands parallel to twin boundaries slightly increases, though the bands that were present on thefirst deformation step become longer and increase in intensity as the strain increases. Most of the hot spots visible onFig. 12-b and -c are already present onFig. 12-a. On the right column, the y-axis is replaced by the length of the twin boundary and other parameters remain the same. Slip bands develop near twin boundaries that exhibit a high Schmid factor, regardless of their length. The length of the bands is correlated to that of twin boundaries, as the band cannot be longer than the twin on the observation plane. Similarly to what has been observed for fatigue cracks, the most intense bands tend to develop along the long twin boundaries that exhibit a high Schmid factor. However, the influence of length of the twin boundary on the intensity of strain localization under simple tensile loading does not seem to be as important as in fatigue regime [8,50,51].
4.2.1.2. Bands that are not parallel to twin boundaries. The bands that are not parallel and not close to twin boundaries were studied separately.Fig. 13shows an inverse polefigure plot where each point corresponds to a band, colored according to the intensity of slip, and located according to the crystallographic orientation of the grain
hosting the band. At all the deformation steps, most of the bands are located in the regions of high Schmid factors, as there are more points in theμ = 0.5 region than other regions despite the absence of texture. In addition, the most intense bands are located towards the region of higher Schmid factors (highlighted by red arrows). Interestingly, not all the hot-spots are located in the region of highest Schmid factor, indicating that the Schmid law may not always be followed. This is classically observed and explained by boundary effects, neighboring grains effects or 3D microstructure effects, which cannot be resolved based by 2D analyzes. The influence of the 3D microstructure and grain boundary network on strain localization will be studied in detail in a future publication, using TriBeam tomography [53].
4.2.2. Interaction of slip bands with other microstructural features The architecture of thefiles enables local variations of slip along bands of interest to be studied, and their evolution throughout de-formation, with respect to the microstructure. This section is dedicated to the interaction of slip bands with each other and with grain boundaries, and examination of how these modify the intensity of in-plane slip along the bands. Intensity profiles along the slip bands are plotted here for thefirst time.
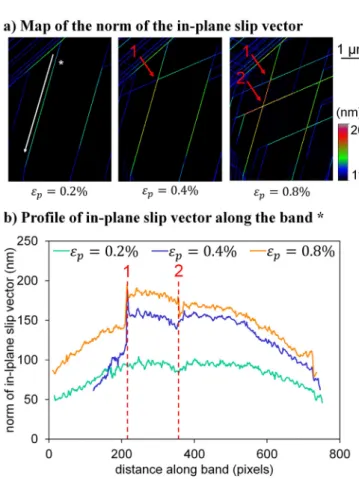
4.2.2.1. Intersecting slip bands. When several slip systems are activated in the same grain, the slip bands eventually intersect each other.Fig. 14 shows an illustration of such phenomenon, where the band highlighted with a“*” mark (Fig. 14-a) had developed at a plastic strain of 0.2%, gets intersected by two other slip bands in subsequent loading steps. The intersection occurs at location“1” at a plastic strain of 0.4%, and at location“2” at a plastic strain of 0.8%. The local evolution of in-plane
Fig. 11. Properties of the slip bands that are parallel to twin boundaries in Inconel 718: a) distribution of the bands as a function of their distance to the parallel twin boundary, average norm of the in-plane slip vector as a function of the distance to the parallel twin boundary for a plastic strain of b) 0.2%, c) 0.4%, d) 0.8%.
slip in this band is plotted inFig. 14-b. Initially, the intensity of slip along the band exhibits a smooth profile with slight decrease towards the ends of the band. This is the typical profile observed for most of the bands in the dataset. As the original band is intersected by other bands, the intensity of in-plane slip exhibits a drastic change. A jump is observed at the location of the intersections and the different parts of the band are characterized by very different in-plane slip values. While more and more dislocations emerge on the free surface of the sample, leading to a global increase in intensity inFig. 14-b, the part located between the two intersections has a higher intensity. This could be explained by the occurrence of cross-slip occurring from the intersecting bands towards the initial one and/or enhanced activation
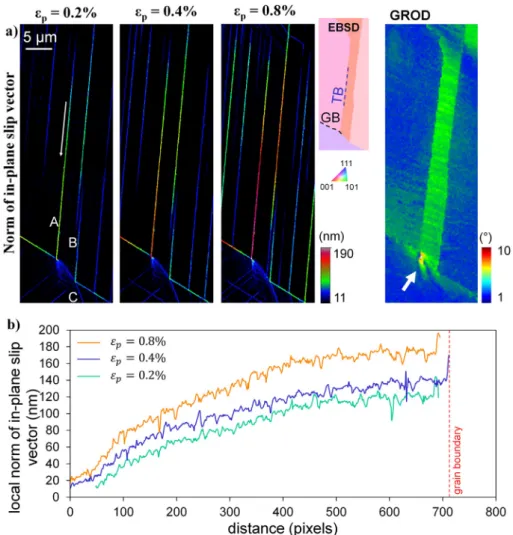
of sources arising from the stress concentration created by the intersection. This information, coupled with dislocation dynamics simulations, will provide new insights to the strain localization process. 4.2.2.2. Slip band-grain boundaries interactions: micro-volumes. When slip transfer across a grain boundary is difficult, local and large elastic rotations in the adjacent crystal can appear, at the tip of the slip band. Such rotations are usually visible on EBSD data and are believed to arise from the shearing of the grain boundary [54]. Micro-volumes werefirst observed in Udimet 720Li nickel base superalloy and have been shown to play a critical role on the fatigue crack initiation in the low cycle fatigue regime [54].Fig. 15shows a configuration where
Fig. 12. Elastic modulus difference and maximum Schmid factor along the {111} twinned plane, for the bands that are parallel to a twin boundary in Inconel 718. The maximum values of the combinations of the difference in elastic modulus versus maximum Schmid factor are plotted in dashed lines. Markers are colored according to the average norm of the in-plane slip vector along the band, and sizes according to the length of the band. (For interpretation of the references to color in thisfigure legend, the reader is referred to the web version of this article.)
a slip band that developed parallel to a twin boundary (highlighted on the EBSD map in Fig. 15-a) encounters a grain boundary (also highlighted on the figure). The H-DIC maps colored according to the
intensity of in-plane slip show that this band is not transmitted across the boundary at any point during deformation. The grain reference orientation deviation (GROD) map obtained by EBSD shows a micro-volume right at the tip of the band, in the adjacent grain. It is highlighted with a white arrow in thefigure. The profile of in-plane slip along the band (Fig. 15-b) follows an interesting trend where the magnitude of slip increases along the band towards the grain boundary. This can be interpreted to be due to dislocations that pile up at the tip of the band near the grain boundary, leading to rotations in the adjacent crystal [55].
5. Conclusions
A method for multi-modal data recombination has been im-plemented, which enables merging of sub-micron resolution of EBSD and Heaviside-DIC data for an automated and statistical assessment of slip localization as a function of the microstructure. The automated detection of the slip bands and assignment of their attributes enables the full identification of the slip system in over 90% of the bands. Post processing of such data enables assessment of fundamental plasticity laws, such as Schmid's law. In Ti-6Al-4V, a fully quantitative analysis of strain partitioning inα and β phases, microtextured regions, and at the scale of individual grains has been conducted for thefirst time on a large number of grains. Basal slip was found to be the major slip system activated. The degree of strain localization in the MTRs was quantified as a function of loading. In the Inconel 718 superalloy, the automated statistical and quantitative assessment of strain localization under tensile loading has been realized for thefirst time, over an assembly of
Fig. 13. Normalized total slip per grain, due to bands that are not parallel to twin boundaries or parallel but far away from the twin boundaries (> 10μm), at plastic strains of: a) 0.2%, b) 0.4%, c) 0.8%, in Inconel 718. The intensities are normalized by the area of the grain to account for the Hall-Petch effect. Only the grains which diameter is > 35 μm were considered. {111}〈110〉 Schmid factor isocurves are plotted with black lines. The grains with the most intense slip bands are highlighted with red arrows. (For interpretation of the references to color in thisfigure legend, the reader is referred to the web ver-sion of this article.)
Fig. 14. Intersection of slip bands in a single grain in Inconel 718. a) H-DIC maps colored according the norm of the in-plane slip vector, for different plastic strains, b) evolution of the norm of the in-plane slip vector along the band highlighted with a“*” marker for different plastic strains. This band get in-tersected by two other bands of a different slip system at locations “1” and “2”. (For interpretation of the references to color in thisfigure legend, the reader is referred to the web version of this article.)
about a thousand grains. Thefirst slip bands to develop are parallel to annealing twin boundaries favorably oriented for parallel slip. They are also the most intense ones. Intensity profiles of in-plane slip magnitude along slip bands are shown for thefirst time and high degrees of lo-calization can occur in relatively small grains. The new data merging methodology also enables quantitative study of the interactions be-tween individual slip bands, as well as interactions of slip bands with grain boundaries.
Declaration of competing interest
The authors declare that they have no known competingfinancial interests or personal relationships that could have appeared to influ-ence the work reported in this paper.
Acknowledgements
The authors gratefully acknowledge Professor Samantha Daly, Professor Henry Proudhon and Professor Jonathan Cormier for
Fig. 15. Development of a microvolume at the tip of a slip band in Inconel 718. a) norm of the in-plane slip vector for a macroscopic plastic strain of 0.2%, 0.4% and 0.8% and corresponding EBSD maps colored according the IPF along the loading direction and the GROD, showing lattice rotations, b) evolution of the local norm of in-plane slip along the band highlighted in a) following the arrow. (For interpretation of the references to color in thisfigure legend, the reader is referred to the web version of this article.)
Fig. 16. Schematic representation of some equivalent in-plane opening angles. The red and light blueγ angles both produce the same slip configuration. The dark and bright blue angles correspond to the trace of the same slip direction in the local base of the slip band( ,→ → ⎯→L T,N⎯ ). (For interpretation of the references to color in this figure legend, the reader is referred to the web version of this article.)
insightful discussions. The authors also appreciate useful discussions with J. Laflen, A. Loghin and J. Marte. Remco Geurts (FEI) is also ac-knowledged for contributions to microscope scripting. The support of
ONR Grants # N00014-16-1-2982 and # N00014-18-1-3031 is grate-fully acknowledged.
Appendix A
A.1. In-plane slip vector angles and equivalent directions
Fig. 16shows a schematic representation of the step produced by a slip band at the surface of the sample. In plane, the red and light blue vectors result in the same translation between the two parts of the crystal. The redγ angle is positive and lower than 90°, whereas the light blue γ angle is > 90°. The negative light blueγ angle corresponds to the trace of the same slip direction than the light blue angle.
References
[1] Peter M. Anderson, John P. Hirth, Jens Lothe, Theory of Dislocations, Cambridge University Press, 2017.
[2] P. Castany, F. Pettinari-Sturmel, J. Crestou, J. Douin, A. Coujou, Experimental study of dislocation mobility in a Ti-6Al-4V alloy, Acta Mater. 13596454, 55 (18) (Oct 2007) 6284–6291,https://doi.org/10.1016/j.actamat.2007.07.032.
[3] P. Castany, F. Pettinari-Sturmel, J. Douin, A. Coujou, In situ transmission electron microscopy deformation of the titanium alloy Ti-6Al-4V: interface behaviour, Mater. Sci. Eng. A 483–484 (1–2 C) (Jun 2008) 719–722,https://doi.org/10.1016/ j.msea.2006.10.183.
[4] Peter R. Morris, Resolved shear stress in elastically anisotropic polycrystals, Metall. Trans. 03602133, 2 (7) (Jul 1971) 1949–1952,https://doi.org/10.1007/ BF02913428.
[5] F. Bridier, P. Villechaise, J. Mendez, Analysis of the different slip systems activated by tension in aα/β titanium alloy in relation with local crystallographic orienta-tion, Acta Mater. 13596454, 53 (3) (Feb 2005) 555–567,https://doi.org/10.1016/ j.actamat.2004.09.040.
[6] Fabienne Lagattu, Florent Bridier, Patrick Villechaise, Jean Brillaud, In-plane strain measurements on a microscopic scale by coupling digital image correlation and an in situ SEM technique, Mater. Charact. 10445803, 56 (1) (Jan 2006) 10–18,https:// doi.org/10.1016/j.matchar.2005.08.004.
[7] F. Bridier, P. Villechaise, J. Mendez, Slip and fatigue crack formation processes in anα/β titanium alloy in relation to crystallographic texture on different scales, Acta Mater. 13596454, 56 (15) (Sep 2008) 3951–3962,https://doi.org/10.1016/j. actamat.2008.04.036.
[8] J.C. Stinville, N. Vanderesse, F. Bridier, P. Bocher, T.M. Pollock, High resolution mapping of strain localization near twin boundaries in a nickel-based superalloy, Acta Mater. 98 (2015) 29–42,https://doi.org/10.1016/j.actamat.2015.07.016. [9] McLean P. Echlin, Jean Charles Stinville, Victoria M. Miller, William C. Lenthe,
Tresa M. Pollock, Incipient slip and long range plastic strain localization in mi-crotextured Ti-6Al-4V titanium, Acta Mater. 114 (Aug 2016) 164–175,https://doi. org/10.1016/J.ACTAMAT.2016.04.057.
[10] E. Héripré, M. Dexet, J. Crépin, L. Gélébart, A. Roos, M. Bornert, D. Caldemaison, Coupling between experimental measurements and polycrystalfinite element cal-culations for micromechanical study of metallic materials, Int. J. Plast. 07496419, 23 (9) (Sep 2007) 1512–1539,https://doi.org/10.1016/j.ijplas.2007.01.009. [11] A. Musienko, A. Tatschl, K. Schmidegg, O. Kolednik, R. Pippan, G. Cailletaud,
Three-dimensionalfinite element simulation of a polycrystalline copper specimen, Acta Mater. 13596454, 55 (12) (Jul 2007) 4121–4136,https://doi.org/10.1016/j. actamat.2007.01.053.
[12] J.D. Carroll, B.G. Clark, T.E. Buchheit, B.L. Boyce, C.R. Weinberger, An experi-mental statistical analysis of stress projection factors in {BCC} tantalum, Mater. Sci. Eng. A 581 (0) (2013) 108–118,https://doi.org/10.1016/j.msea.2013.05.085ISSN 0921-5093.
[13] L. Signor, P. Villechaise, T. Ghidossi, E. Lacoste, M. Gueguen, S. Courtin, Influence of local crystallographic configuration on microcrack initiation in fatigued 316LN stainless steel: experiments and crystal plasticityfinite elements simulations, Mater. Sci. Eng. A 649 (Jan 2016) 239–249,https://doi.org/10.1016/j.msea.2015.09.119. [14] Matthew Kasemer, McLean P. Echlin, Jean Charles Stinville, Tresa M. Pollock,
Paul Dawson, On slip initiation in equiaxedα/β Ti-6Al-4V, Acta Mater. 13596454, 136 (Sep 2017) 288–302,https://doi.org/10.1016/j.actamat.2017.06.059. [15] A. El Bartali, V. Aubin, L. Sabatier, P. Villechaise, S. Degallaix-Moreuil,
Identification and analysis of slip systems activated during low-cycle fatigue in a duplex stainless steel, Scr. Mater. 13596462, 59 (12) (Dec 2008) 1231–1234,
https://doi.org/10.1016/j.scriptamat.2008.07.044.
[16] Maria Cecilia Marinelli, Ahmed El Bartali, Javier W. Signorelli, Pierre Evrard, Véronique Aubin, Iris Alvarez-Armas, Suzanne Degallaix-Moreuil, Activated slip systems and microcrack path in LCF of a duplex stainless steel, Mater. Sci. Eng. A 509 (1–2) (May 2009) 81–88,https://doi.org/10.1016/j.msea.2009.01.012. [17] Wael Abuzaid, Michael D. Sangid, Huseyin Sehitoglu, Jay Carroll, John Lambros,
The role of slip transmission on plastic strain accumulation across grain boundaries, Procedia IUTAM, 4 2012, pp. 169–178, ,https://doi.org/10.1016/j.piutam.2012. 05.019(IUTAM Symposium on Full-field Measurements and Identification in Solid Mechanics).
[18] X. Xu, D. Lunt, R. Thomas, R. Prasath Babu, A. Harte, M. Atkinson, J. Q. da Fonseca, and M. Preuss. Identification of active slip mode in a hexagonal material by cor-relative scanning electron microscopy. Acta Mater., 175:376–393, aug 2019. ISSN
13596454. doi:https://doi.org/10.1016/j.actamat.2019.06.024.
[19] K. Zhang, K.V. Yang, A. Huang, X. Wu, C.H.J. Davies, Fatigue crack initiation in as forged Ti-6Al-4V bars with macrozones present, Int. J. Fatigue 80 (Jun 2015) 288–297,https://doi.org/10.1016/j.ijfatigue.2015.05.020.
[20] A.D. Kammers, S. Daly, Self-assembled nanoparticle surface patterning for im-proved digital image correlation in a scanning electron microscope, Exp. Mech. 53 (8) (2013) 1333–1341,https://doi.org/10.1007/s11340-013-9734-5.
[21] A.D. Kammers, S. Daly, Digital image correlation under scanning electron micro-scopy: methodology and validation, Exp. Mech. 53 (9) (2013) 1743–1761,https:// doi.org/10.1007/s11340-013-9782-x(URL).
[22] A.W. Mello, T.A. Book, A. Nicolas, S.E. Otto, C.J. Gilpin, M.D. Sangid, Distortion correction protocol for digital image correlation after scanning electron micro-scopy: emphasis on long duration and ex-situ experiments, Exp. Mech. (Jul 2017),
https://doi.org/10.1007/s11340-017-0303-1.
[23] J.C. Stinville, M.P. Echlin, D. Texier, F. Bridier, P. Bocher, T.M. Pollock, Sub-grain scale digital image correlation by electron microscopy for polycrystalline materials during elastic and plastic deformation, Exp. Mech. (2015) 1–20,https://doi.org/10. 1007/s11340-015-0083-4ISSN 0014-4851. (URL).
[24] William C. Lenthe, Jean Charles Stinville, McLean P. Echlin, Zhe Chen, Samantha Daly, Tresa M. Pollock, Advanced detector signal acquisition and electron beam scanning for high resolution SEM imaging, Ultramicroscopy 0304-3991, 195 (2018) 93–100,https://doi.org/10.1016/j.ultramic.2018.08.025.
[25] F. Di Gioacchino, J. Quinta da Fonseca, Plastic strain mapping with sub-micron resolution using digital image correlation, Exp. Mech. 53 (5) (2013) 743–754. [26] F. Bourdin, J.C. Stinville, M.P. Echlin, P.G. Callahan, W.C. Lenthe, C.J. Torbet,
D. Texier, F. Bridier, J. Cormier, P. Villechaise, T.M. Pollock, V. Valle, Measurements of plastic localization by heaviside-digital image correlation, Acta Mater. 1359-6454, 157 (Sep 2018) 307–325,https://doi.org/10.1016/J. ACTAMAT.2018.07.013.
[27] Z. Chen, W. Lenthe, J.C. Stinville, M. Echlin, T.M. Pollock, S. Daly, High-resolution deformation mapping across largefields of view using scanning electron micro-scopy and digital image correlation, Exp. Mech. 58 (9) (Nov 2018) 1407–1421,
https://doi.org/10.1007/s11340-018-0419-y.
[28] Z. Chen, S. Daly, Deformation twin identification in magnesium through clustering and computer vision, Mater. Sci. Eng. A 09215093, 736 (Oct 2018) 61–75,https:// doi.org/10.1016/j.msea.2018.08.083.
[29] P. Ari-Gur, S.L. Semiatin, Evolution of microstructure, macrotexture and micro-texture during hot rolling of Ti-6A1-4V, Mater. Sci. Eng. A 0921-5093, 257 (1) (Nov 1998) 118–127,https://doi.org/10.1016/S0921-5093(98)00829-6.
[30] Dipankar Banerjee, Adam Pilchak, James C. Williams, Processing, structure, texture and microtexture in titanium alloys, Mater. Sci. Forum, 710 2012, pp. 66–84, ,
https://doi.org/10.4028/www.scientific.net/MSF.710.66.
[31] Dipankar Banerjee, J.C. Williams, Perspectives on titanium science and technology, Acta Mater. 61 (3) (Feb 2013) 844–879,https://doi.org/10.1016/j.actamat.2012. 10.043.
[32] Damien Texier, Ana Casanova Gómez, Stéphane Pierret, Jean-Michel Franchet, Tresa M. Pollock, Patrick Villechaise, Jonathan Cormier, Microstructural features controlling the variability in low-cycle fatigue properties of alloy Inconel 718DA at intermediate temperature, Metall. Mater. Trans. A 47 (3) (2016) 1096–1109,
https://doi.org/10.1007/s11661-015-3291-8.
[33] Michael A. Sutton, Digital image correlation for shape and deformation measure-ments, in: Jr. Sharpe, N. William (Eds.), Springer Handbook of Experimental Solid Mechanics, Springer, US, 2008, pp. 565–600, , https://doi.org/10.1007/978-0-387-30877-7_20ISBN 978-0-387-26883-5.
[34] Valéry Valle, Stephen Hedan, Philippe Cosenza, Anne-Laure Fauchille, M. Berdjane, DIC development for the study of materials including multiple crossing cracks, Exp. Mech. 55 (2) (2015) 379–391,https://doi.org/10.1007/s11340-014-9948-1ISSN 17412765.
[35] G. Martin, N. Ochoa, K. Saï, E. Hervé-Luanco, G. Cailletaud, A multiscale model for the elastoviscoplastic behavior of directionally solidified alloys: application to FE structural computations, Int. J. Solids Struct. 51 (5) (Mar 2014) 1175–1187,
https://doi.org/10.1016/J.IJSOLSTR.2013.12.013.
[36] P. Haldipur, F.J. Margetan, R.B. Thompson, Estimation of single-crystal elastic constants from ultrasonic measurements on polycrystalline specimens, AIP Conf. Proc, 700 2004, p. 1061, ,https://doi.org/10.1063/1.1711735.
[37] Sathiskumar Jothi, S.V. Merzlikin, T.N. Croft, J. Andersson, S.G.R. Brown, An in-vestigation of micro-mechanisms in hydrogen induced cracking in nickel-based superalloy 718, J. Alloys Compd. 0925-8388, 664 (Apr 2016) 664–681,https://doi. org/10.1016/J.JALLCOM.2016.01.033.
[38] G. Nolze, Geometrically caused image distortion effects and their influence on in-terpretation of EBSD measurements, Mater. Sci. Technol. 22 (11) (Nov 2006) 1343–1351,https://doi.org/10.1179/174328406X130894(URL).
[39] Gert Nolze, Image distortions in SEM and their influences on EBSD measurements, Ultramicroscopy 107 (2–3) (Feb 2007) 172–183,https://doi.org/10.1016/j. ultramic.2006.07.003.
[40] Y.B. Zhang, A. Elbrønd, F.X. Lin, A method to correct coordinate distortion in EBSD maps, Mater. Charact. 1044-5803, 96 (Oct 2014) 158–165,https://doi.org/10. 1016/J.MATCHAR.2014.08.003.
[41] Marie-Agathe Charpagne, Florian Strub, Tresa M. Pollock, Accurate reconstruction of EBSD datasets by a multimodal data approach using an evolutionary algorithm, Mater. Charact. 150 (2019) 184–198,https://doi.org/10.1016/j.matchar.2019.01. 033ISSN 1044-5803.
[42] D. Lunt, J. Quinta da Fonseca, D. Rugg, M. Preuss, Microscopic strain localisation in Ti-6Al-4V during uniaxial tensile loading, Mater. Sci. Eng. A 09215093, 680 (Jan 2017) 444–453,https://doi.org/10.1016/j.msea.2016.10.099.
[43] S. Hémery, P. Nizou, P. Villechaise, In situ SEM investigation of slip transfer in Ti-6Al-4V: effect of applied stress, Mater. Sci. Eng. A 709 (Supplement C) (2018) 277–284,https://doi.org/10.1016/j.msea.2017.10.058.
[44] S. Hémery, A. Nait-Ali, P. Villechaise, Combination of in-situ SEM tensile test and FFT-based crystal elasticity simulations of Ti-6Al-4V for an improved description of the onset of plastic slip, Mech. Mater. 01676636, 109 (Jun 2017) 1–10,https://doi. org/10.1016/j.mechmat.2017.03.013.
[45] S. Hémery, A. Naït-Ali, M. Guéguen, J. Wendorf, A.T. Polonsky, M.P. Echlin, J.C. Stinville, T.M. Pollock, P. Villechaise, A 3D analysis of the onset of slip activity in relation to the degree of micro-texture in Ti–6Al–4V, Acta Mater. 181 (Dec 2019) 36–48,https://doi.org/10.1016/j.actamat.2019.09.028.
[46] K. Le Biavant, S. Pommier, C. Prioul, Local texture and fatigue crack initiation in a Ti-6Al-4V titanium alloy, Fatigue Fract. Eng. Mater. Struct. 8756-758X, 25 (6) (Jun 2002) 527–545,https://doi.org/10.1046/j.1460-2695.2002.00480.x.
[47] Alec Blankenship, Elucidating the Role of Microstructure, Texture, and Microtexture on the Dwell Fatigue Response of Ti-6Al-4V, PhD thesis (Jan 2016). [48] J.C. Stinville, W.C. Lenthe, J. Miao, T.M. Pollock, A combined grain scale
elastic–plastic criterion for identification of fatigue crack initiation sites in a twin containing polycrystalline nickel-base superalloy, Acta Mater. 103 (2016) 461–473,
https://doi.org/10.1016/j.actamat.2015.09.050.
[49] William C. Lenthe, Jean Charles Stinville, McLean P. Echlin, Tresa Pollock, Statistical assessment of fatigue-initiating microstructural features in a poly-crystalline disk alloy, 13th International Symposium on Superalloys, 16 2016, pp. 569–577.
[50] J.C. Stinville, W.C. Lenthe, M.P. Echlin, P.G. Callahan, D. Texier, T.M. Pollock, Microstructural statistics for fatigue crack initiation in polycrystalline nickel-base superalloys, Int. J. Fract. (Sep 2017),https://doi.org/10.1007/s10704-017-0241-z
ISSN 1573-2673.
[51] Jean Charles Stinville, Etienne Martin, Mallikarjun Karadge, Shak Ismonov, Monica Soare, Tim Hanlon, Sairam Sundaram, McLean P. Echlin, Patrick G. Callahan, William C. Lenthe, V.M. Miller, Jiashi Miao, Andrew E. Wessman, Rebecca Finlay, Adrian Loghin, Judson Marte, Tresa M. Pollock, Fatigue deforma-tion in a polycrystalline nickel base superalloy at intermediate and high tempera-ture: competing failure modes, Acta Mater. 152 (Jun 2018) 16–33,https://doi.org/ 10.1016/j.actamat.2018.03.035.
[52] J.H. Liu, N. Vanderesse, J.C. Stinville, T.M. Pollock, P. Bocher, D. Texier, In-plane and out-of-plane deformation at the sub-grain scale in polycrystalline materials assessed by confocal microscopy, Acta Mater. 169 (May 2019) 260–274,https:// doi.org/10.1016/j.actamat.2019.03.001.
[53] McLean P. Echlin, Marcus Straw, Steven Randolph, Jorge Filevich, Tresa M. Pollock, The TriBeam system: femtosecond laser ablation in situ SEM, Mater. Charact. 100 (Feb 2015) 1–12,https://doi.org/10.1016/j.matchar.2014.10.023ISSN 10445803. [54] Baptiste Larrouy, Patrick Villechaise, Jonathan Cormier, Olivier Berteaux, Grain
boundary-slip bands interactions: impact on the fatigue crack initiation in a poly-crystalline forged Ni-based superalloy, Acta Mater. 99 (Oct 2015) 325–336,https:// doi.org/10.1016/j.actamat.2015.08.009.
[55] Y. Guo, T.B. Britton, A.J. Wilkinson, Slip band-grain boundary interactions in commercial-purity titanium, Acta Mater. 76 (Sep 2014) 1–12,https://doi.org/10. 1016/j.actamat.2014.05.015.