HAL Id: hal-02007864
https://hal-mines-albi.archives-ouvertes.fr/hal-02007864
Submitted on 6 Nov 2019
HAL is a multi-disciplinary open access
archive for the deposit and dissemination of
sci-entific research documents, whether they are
pub-lished or not. The documents may come from
teaching and research institutions in France or
abroad, or from public or private research centers.
L’archive ouverte pluridisciplinaire HAL, est
destinée au dépôt et à la diffusion de documents
scientifiques de niveau recherche, publiés ou non,
émanant des établissements d’enseignement et de
recherche français ou étrangers, des laboratoires
publics ou privés.
Mechanical behaviour modelling and finite element
simulation of simple part of Ti-6Al-4V sheet under
hot/warm stamping conditions
Quentin Sirvin, Vincent Velay, Rébecca Bonnaire, Luc Penazzi
To cite this version:
Quentin Sirvin, Vincent Velay, Rébecca Bonnaire, Luc Penazzi. Mechanical behaviour modelling
and finite element simulation of simple part of Ti-6Al-4V sheet under hot/warm stamping
condi-tions. Journal of Manufacturing Processes, Society of Manufacturing Engineers, 2019, 38, pp.472-482.
�10.1016/j.jmapro.2018.12.010�. �hal-02007864�
Mechanical behaviour modelling and finite element simulation of simple
part of Ti-6Al-4V sheet under hot/warm stamping conditions
Quentin Sirvin
⁎, Vincent Velay, Rebecca Bonnaire, Luc Penazzi
Institut Clément Ader (ICA), Université de Toulouse, CNRS, Mines Albi, UPS, INSA, ISAE-SUPAERO, Campus Jarlard, 81013 Albi CT Cedex 09, France
Keywords:
Numerical simulation Modelization
Isothermal hot/warm stamping Ti-6Al-4V
A B S T R A C T
In order to reduce production costs and environmental impact, the cycle time reductions associated with a decrease in temperature levels are relevant. This study focuses on the behaviour modelling of Ti-6Al-4V alloy at temperatures between 400 °C and 500 °C in order to obtain greater formability than at room temperature, whilst remaining below SPF conditions to reduce tool, workshop and energy costs. Mechanical tests are conducted to identify elasto-viscoplastic model parameters. They use displacement field measurements obtained by Digital Image Correlation (DIC) and based on innovative surface preparation patterns adapted to high temperature exposures. Different material parameters are identified to define a model that is able to predict the mechanical behaviour of Ti-6Al-4V alloy under hot/warm stamping conditions. Then, an omega shape forming test is de-veloped to validate the behaviour model. Finally, the experimental results are compared with numerical si-mulations which require the implementation of the behaviour model formulation into an FE code.
1. Introduction
In the aeronautics industry, titanium alloys are very common, principally due to their high strength-to-weight ratio. This kind of material is widely used in sheet form because this process avoids ex-pensive operations such as machining and supports forming parts with reduced weight, good mechanical properties and a high production level[1,2]. It can be formed using three methods and three temperature ranges. At room temperature by drawing, at very high temperature (≃900 °C) by superplastic forming and at intermediate temperature by hot forming or hot stamping (≥750 °C)[3]. In the case of hot forming or stamping, the temperature is usually between 750 °C and 890 °C[4]. In order to save on energy costs and limit the environmental impact, this study seeks to reduce the temperature range in hot stamping op-erations, as proposed by Odenberger et al. on Ti-6242 titanium alloys [5].
In the design phase, numerical tools such as the finite element method (FEM) are often used to evaluate new manufacturing processes and predict product formability. In order to increase the accuracy of these predictions and to develop suitable isothermal mechanical forming processes for Ti-6Al-4V titanium alloy sheet metal components, FE-analysis of forming processes is required. The shape deviation of the complete part generated in the sheet metal forming procedure will be influenced by resulting geometry, sheet thickness and residual stress.
There is little information available with regard to Ti-6Al-4V tita-nium alloy at the temperature range from 400 °C to 500 °C hot/warm forming conditions. On the other hand, Ti-6Al-4V has been widely studied under SPF conditions. It is known that at high temperature, grain boundary sliding (GBS) is the main inelastic mechanism[3]. In this case, isotropic and viscoplastic behaviour can be assumed, but large microstructural changes can occur and greatly influence the mechanical behaviour[6,7]. At lower temperatures, inelastic deformation is mainly controlled by dislocation motion[3]. In such conditions, the micro-structure remains unchanged with time and temperature but other phenomena need to be investigated[8]. A number of studies have been performed to identify and understand the sensitivity of titanium alloy parameters. The anisotropy[9,10], the strain rate sensitivity[11], the temperature effect[12]and the asymmetry behaviour between ten-sion/compression[9], are prominent phenomena that need to be con-sidered when formulating the behaviour model. Particular attention needs to be paid to the yield criterion. Numerous anisotropic yield formulations which can account for plastic anisotropy, e.g. Hill [13–15]. Odenberger et al.[16]and Tuninetti et al.[17]have shown that the yield criterion, developed by Cazacu et al.[15], accurately describes the mechanical behaviour, associated with temperature, of Ti-6Al-4V titanium alloy. The drawback of this criterion is the number of tests required for it to be correctly identified.
This work aims to determine the process parameters that make the
⁎Corresponding author.
E-mail address:quentin.sirvin@mines-albi.fr(Q. Sirvin).
best use of the material behaviour in order to optimize the forming of industrial parts in hot/warm isothermal stamping. Thus the main pro-blem is the formability prediction of the material under stamping conditions. To make this prediction, an isothermal behaviour model is proposed here. It considers an elasto-viscoplastic behaviour, an aniso-tropic yield criterion and hardening evolution. In this study, a Hill criterion is identified and two different hardening evolutions (i.e. iso-tropic and kinematic hardening) are compared for the analysis of the forming procedure and the prediction of the final shape (after spring-back). The present work considers three kinds of experimental tests, namely simple tensile tests under large deformation (TTLD), cyclic tests
under small strain conditions (CTSS) and hot forming tests (HFT). The
two first tests allow the model parameters to be determined. The simple tensile tests under large deformation give the viscoplastic behaviour and formability limit of the material. Whereas the tests under tension-compression (TC) and tension-compression-tension (CT) make it possible to determine the yield stress, the asymmetry behaviour and the hardening evolution. Finally the hot forming tests provide model validation by comparing the experimental results with the FE simulations. Thus the importance of each parameter can be quantified.
2. Material
Specimens were extracted from 1.6 mm thickness sheet provided by VSMPO. The heat treatment applied to the Ti-6Al-4V alloy sheet was 790 °C/45 min air cooling. The as-received microstructure revealed equiaxed dual-phase (α + β) Ti-6Al-4V alloy with an average α grain size of 6–7μm, as presented inFig. 1(a).Fig. 1(b) and (c) shows the microstructure after a tensile test performed at 400 °C and 500 °C and a strain rate of 10−4s−1. These strain rate conditions could be favorable
to initiate microstructural growth. In the present case, SEM observa-tions showed a microstructure that remained unchanged at this tem-perature range, contrary to many research work results performed at higher temperature[6,7].
3. Experimental set-ups
3.1. Characterization in uniaxial large elongation
The material characterization was performed in the temperature range from 400 °C to 500 °C. The mechanical tensile tests were con-ducted using a servo-hydraulic testing machine (MTS 50 kN), a furnace accurate for large elongations with three independent heating zones and a DIC bench composed of:
•
lighting system,•
green light filter,•
5 Mega Pixels (MP) camera•
fixed focal length lenses 28–300 mm.Fig. 2illustrates the different components of the experimental set-up. As the use of a standard extensometer is not possible due to the large elongation, a non-linear cross head displacement u(t) (defined by Eq.(1)) is considered to achieve a constant target strain rateϵ˙at the center of the specimen[18].
=
u t( ) ϵ˙xx 0L e(ϵ˙xxt) (1) where L0is the initial gauge length and t is the time in seconds.
The longitudinal strain field measurement was conducted by non-contact techniques based on DIC and VIC-2D™ software [19]. This technique is more and more widely used[20]in this field. The image correlation requires a surface pattern of the specimen. In the present study, an innovative method based on specimen anodizing was devel-oped. To carry out this kind of speckle analysis the following steps must be taken. The specimen surfaces are polished with abrasive paper and cleaned with ethanol. Kroll chemical attack is applied to matify the
surface so as not to saturate the images during the correlation step. Then a varnish speckle is applied on the specimen surface which is anodized. The anodization process uses a stainless steel cathode, a sulphuric acid solution (H2SO4) and a voltage of 22 V. The parameters
to perform this anodization are provided from results published by the “Association de Traitement Thermique et de Traitement de Surface” (A3TS) and the review of titanium anodization by Aladjem[21]. Finally the varnish is removed with acetone. This operation obtains an ade-quate surface pattern of the part even after forming, in contrast to painting, which sticks to the material.Fig. 3 shows the result of the anodization process on a tensile specimen and include x, y and z re-spectively defined as the axial, transverse and out of plane directions. Displacement field measurements and anodization speckle analysis can then determine accurate longitudinal and transversal displacement fields between 400 °C and 500 °C. Displacement and strain fields, under large deformation conditions, were calculated by VIC-2D™ from the images given by the DIC bench. Induced axial force was recorded by a 25 kN load cell.
To characterize the anisotropy of the material, the tensile properties were evaluated along three orientations 0°(RD), 45°(DD) and 90°(TD)
with respect to the rolling direction. The viscous part was studied over three strain rates, namely 10−4s−1, 10−3s−1and 10−2s−1. Each test
was duplicated three times if the results of the two first ones were different. We observed that the experimental data were disrupted by two phenomena: the variation, even minimal, of strain rate during a test and the measurement of deformation by DIC. To reduce the measure-ment uncertainty, a Savitzky Golay filter[22]was applied. Finally, the transverse displacement field obtained by DIC gave the accurate instant at which necking appeared during the test.
3.2. Characterization in tension-compression under small strain conditions During a stamping operation, the deformation of the sheet can evolve heterogeneously. Col [23] shows the importance of the de-formation modes and the impact on the final result. Moreover, the same part of the sheet can undergo several states of deformation (bending and unbending) as identified by Simon et al.[24]leading to complex loading paths which have to be taken in account by the behaviour model.
In order to improve the mechanical testing database, tension-com-pression (TC), comtension-com-pression-tension (CT) and relaxation (RELAX) tests were performed by Faurecia Materials Laboratory.1In this case, strain controlled pull-push tests were conducted on flat specimens using a high temperature extensometer. The purpose of these tests is to analyse the strain rate sensitivity, the asymmetry behaviour and the kinematic effect (Bauschinger effect) for cyclic tests. This system is especially designed to prevent any buckling effect during the compression loading.
Tension-compression (TC) and compression-tension (CT) consider two different strain rates 10−4s−1and 10−2s−1and one solicitation
direction. Whereas the stress relaxation test (RELAX) only considers one strain rate.Table 1illustrates all the test conditions conducted at 400 °C and 500 °C along the rolling direction (RD).
3.3. Omega tests
In order to investigate the multiaxial behaviour, a simplified stamping test was developed. To validate the behavior law identified through experimental tests, an experimental set-up of the technical specimen was used. The set-up was derived from NUMISHEET '93[25] and experiments were similar to those performed by Odenberger et al. [26]. Its purpose is twofold: first, to quantify springback by three-di-mensional measurements of the work-piece after forming and,
secondly, to obtain a technical specimen able to validate the further numerical simulations.
The sheet metal forming tests were performed under hot/warm
isothermal conditions. The tool set was composed of a punch, die and blank-holder manufactured in X38-Cr-Mo-V5 tool steel with a nominal hardness of 48 HRC. The tool set was mounted on a hydraulic testing machine (MTS 50 kN). The test procedure first considered a displace-ment controlled by the hydraulic rods followed by a load controlled at the very end of the forming sequence (when the punch force reached 45 kN and up to 48 kN). For all tests, the maximum punch force was therefore 48 kN.
All tests were performed in a furnace as illustrated in Fig. 4(a). Three types of specimens were tested for the three orientations (RD, DD, TD). The dimensions of the sheet specimen were
Fig. 1. Micrography of Ti-6Al-4V titanium alloys at: initial state (a), after a tensile test at 400 °C (b), and 500 °C (c).
Fig. 2. Photograph of the experimental set-up composed of hydraulic tensile test machine MTS 50 kN, a furnace, a lens, a camera, a light filter and a light.
Fig. 3. Result of anodized speckle analysis on Ti-6Al-4V specimen. Table 1
Conditions for the tensile test in small strain in rolling direction; TC=Tension-Compression, CT=Compression-Tension and RELAX=stress relaxation test.
ϵ˙ TC CT RELAX
10−2s−1 ✓ ✓ –
205 mm × 30 mm. Those of the forming tools are described inFig. 4(b). Sheet specimens were cut by waterjet technology, cleaned with ethanol and sprayed with Boron Nitride Aerosol as a lubrication, applied in one thin layer.
The sheet specimens were placed and centered in the forming tool, after which the temperature rise sequence was applied and finally the forming operation was carried out. The lower die had a constant ve-locity of 0.5 or 1 mm/s and the gap between the specimen and the blank holder could vary between 0.05 and 0.2 mm. A displacement holding time was applied before unloading.
3.4. Anisotropy identification
The plastic strain ratio rαis defined by Eq.(2) [2]. Thus, knowledge
of longitudinalϵ˙xxpl and transverseϵ˙yypl plastic strain rates during a tensile
test is required. The plastic incompressibility assumption + + =
ϵxxpl ϵyypl ϵzzpl 0, leads to the calculation of the thickness plastic strain ϵzzpl (knowing the longitudinal ϵxxpl and transverse ϵplyy plastic strains).
These strain components can be calculated (with VIC-2D™ software) from the displacement field given by DIC. The local plastic strain ratio is written as: = = − + r ϵ˙ ϵ˙ ϵ˙ ϵ˙ ϵ˙ α yy pl zz pl yy pl xx pl yy pl (2)
withα the angle between the loading and the rolling directions and ϵ˙plxx,
ϵ˙yypl, ϵ˙zzpl respectively the strain rates along the tensile direction,
per-pendicular to the tensile direction and in the thickness.
For both test temperatures 400 °C and 500 °C and regardless of the strain rates, a significant anisotropy effect was observed, as shown in Fig. 5(a) at 400 °C, for a strain rate of 10−4s−1and three directions
(RD, DD and TD). Thus, the maximal stress is obtained forα = 0°
di-rection whereas the minimal is obtained for α = 45° direction. The
maximal deformation value corresponds to the ultimate deformation value stored before necking. It was obtained using DIC techniques and by performing a careful image analysis to identify the times when
necking appears. This deformation before necking (ϵxx) is maximal for
α = 0°and minimal forα = 90°, as illustrated inFig. 5(a).
For all graphs, stress normalization is carried out using the maximal stress level obtained before necking at T = 400 °C andϵ˙= 10−2s−1.
Similarly, strain normalization is done by using the maximal stain value before necking at T = 500 °C andϵ˙= 10−4s−1.
InFig. 5(b), the evolution of the normalized plastic strain ratio rαis
shown. The normalization was obtained from the maximum mean plastic strain ratio calculated fromr = + +
m r0 2r445 r90 such as rα=rrmα.
These results show that the anisotropy slightly decreases when the temperature increases because the mean value of rmtends to 1. The
error bar represents the error percentage (3%) between the minimum and the maximum values calculated at different strain rates.
3.5. Temperature effect and strain rate dependence
Fig. 6shows the temperature effect (a) and the strain rate depen-dence (b) for a tensile test at 10−4s−1strain rate. One can notice a
decrease in the stress level with a rise in temperature as well as a rise in the maximal elongation with temperature. Thus, a maximal stress level and a minimal strain level are obtained at 400 °C and a minimal stress level and a maximal strain level at 500 °C. Conversely, from the tem-perature effect, the stress level decreases with the strain rate. Here, the maximal stress level is obtained for 10−2s−1and the maximal strain
level is obtained for 10−4s−1at 500 °C.
3.6. Asymmetry and hardening evolution
As shown in Fig. 7, the strain–stress response under cyclic condi-tions at 400 °C and 500 °C for 10−4s−1strain rate allows the typical
loading path mentioned above to be evaluated. The yield stress level in tension and compression are substantially the same for both test tem-peratures at the maximum strain level. Thus, one can conclude that the asymmetry effect is not significant and will thus not be considered in the rest of this study. To sum up, these tests allow identification of the
Fig. 4. Photograph of the experimental device (a). Drafting with general dimensions of the forming omega tools (b).
Fig. 5. Uniaxial tensile test in three in-plane orientations showing the material's anisotropy in tension at 400 °C and 10−4s−1strain rate (a). Evolution of normalized
effects related to the Bauschinger effect, strain rate sensitivity, aniso-tropy and temperature dependence.
Next, the influence of each previous phenomenon on the forming process was analysed. For this purpose, an omega shape forming was conducted experimentally.
3.7. Forming Omega test
Since the end of the test is load controlled, the comparison of the forces is carried out at −30 mm of displacement. Fig. 8 shows the punch force evolution over specimen displacement for different test conditions. One can observe that the punch velocity and the orienta-tions (RD or TD) do not influence the force induced (−9.8 kN at −30 mm displacement). On the other hand, the gap between the blank-holder and the specimen has a slight effect. The punch force decreases when the clearance between the specimen and the blank-holder in-creases. For 0.2 mm clearance, −8.8 kN punch force is induced while for 0.1 mm clearance a punch force value of −9.8 kN is obtained. This can be explained by the fact that a small gap between the sheet and the blank holder involves a greater restraint of the sheet. In addition, the temperature has a significant effect on the punch force. The punch force evolution following the two temperatures shows an increase in the difference between the two curves. From −10 mm to −30 mm a gap of about 10% is obtained, whereas from −30 mm to −39 mm the gap increases to reach a value of about 25%. It can be noted here that when the temperature decreases the evolution of the punch force increases more rapidly.
4. Behaviour modelling
Accurate prediction of the theoretical formability of the part de-pends on the accuracy of the deformation behaviour results represented by hardening models for a particular material. Hardening models as-sociated with yield criteria describe the evolution (expansion/contrac-tion or transla(expansion/contrac-tion) of a yield surface representing material hardening. In a crystal material, the plastic strain generally results from the movement of the dislocations. The density of the latter increases due to encounters with obstacles which slow down or block their movements
[27]. This causes hardening of the material. Two mechanisms can be envisaged: isotropic hardening or kinematic hardening, as introduced by Lemaitre et al.[28]. Kinematic hardening can describe the Bau-schinger effect identified on previous cyclic tests (cf. Fig. 7). Each hardening model will have a unique effect on the evolution of the yield surface[2]. To describe the Ti-6Al-4V titanium behaviour, particular attention needs to be paid to the yield criterion. As mentioned before, the literature review[10,16,15,29]showed that the Cazacu yield cri-terion is well adapted to describing the behaviour of titanium alloys from room temperature to 750 °C, especially the asymmetry between tension and compression loadings. However, the identification of the criterion requires a large number of tests and is not easy to achieve. In their study on titanium alloy under hot/warm forming conditions, Kotkunde et al.[29]compared different hardening models and yield criteria. Their conclusion was that Hill and Cazacu yield criteria with exponential law hardening models best predict the Ti-6Al-4V beha-viour.
4.1. Constitutive equations
The present work considers an elasto-viscoplastic behaviour. For the elastic part an isotropic behaviour is considered, defined by isotropic Hooke's law. An additive decomposition of the total strain rated¯into an elasticd¯el and viscoplastic partd¯plis considered (Eq.(3)).
= +
d d¯ ¯el d¯pl (3)
The strain–stress equation within a large-strain formulation is written as a relationship between the objective derivative of Cauchy stress and the rate of the elastic deformation (Eq.(4)).
= −
▿
σ¯ C d d¯¯ : ( ¯e ¯ )pl (4)
whereC¯¯e is the fourth-order elasticity tensor defined by Young's
mod-ulus E and Poisson's ratio ν.
In the present study, the asymmetry between tension and com-pression is not obvious for the two temperature of 400 °C and 500 °C (cf. Fig. 7). Therefore, two modelling frames are considered with a Hill yield criterion either combined with an isotropic (Eq.(5)) or combined with a kinematic hardening (Eq.(6)).
Fig. 6. True stress vs true strain of Ti-6Al-4V titanium alloy: temperature effect from 400 °C to 500 °C and 10−2s−1strain rate for RD (a); strain rate dependence for
DD sampling direction at 500 °C and three strain rates: 10−2s−1, 10−3s−1, and 10−4s−1(b).
= − − = − − f σ( ) 23S M¯: ¯¯ : ¯ (Hill S R σ0) JMHill(¯) (σ R σ0) (5) = − − − = − − f σ( ) 23( ¯S X M¯ ): ¯¯ : ( ¯Hill S X¯ ) σ0 JMHill(¯σ X¯ ) σ0 (6) = ⎛ ⎝ ⎜ ⎜ ⎜ ⎜ − + + − − + + ⎞ ⎠ ⎟ ⎟ ⎟ ⎟ M F G H F G H F G H L M N ¯ 2 2 0 0 0 0 0 0 2 2 0 0 0 0 0 0 2 2 0 0 0 0 0 0 2 0 0 0 0 0 0 2 0 0 0 0 0 0 2 Hill (7) with S¯ the deviatoric part of the Cauchy stress σ¯, R the isotropic hardening,X¯the kinematic hardening andσ0the elasticity limit.M¯¯Hill
is the Hill fourth order tensor which can be reduced to the matrixM¯Hill
by using the Voigt notation (Eq.(7)). Hill criterion parameters (F, G, H, L, M, N) can be identified using two different methods. The first one uses the plastic strain ratio in three different directions. The second one uses the three yield stresses and one plastic strain ratio[30]. In this paper, only the second method is applied.
Two hardening variables are introduced in the standard way. Their evolution equations are given by Eq.(8)for isotropic hardening and by Eq.(9)for kinematic hardening. Moreover, the first one introduces a static recovery term for a better description of the stress–strain response at low strain rates, as discussed below.
⎧ ⎨ ⎪⎪ ⎩ ⎪⎪ = = ∑ = − − = − = ⎫ ⎬ ⎪⎪ ⎭ ⎪⎪ =
(
)
( )
( )
R b Q r R R r p r p i ; ˙ ˙ 1 ˙ ˙ 1 , 2, 3 i i i i i i R Q RM m i QR 1 3 1 i i 1 1 1 (8) ⎧ ⎨ ⎪⎪ ⎩ ⎪ ⎪ = = ∑ = − − = − = ⎫ ⎬ ⎪⎪ ⎭ ⎪ ⎪ = ▿ 〈 〉 ▿( )
X C α X X α d X p α d X i ¯ ¯ ; ¯ ¯ ˙¯ ¯ ¯ ˙ ˙¯ ¯ ¯ , 2, 3 i i i i i D C J XM m XJ X i DC i 2 3 31 1 pl 32 1 32 ( ¯ ) ( ¯ )¯ pl 32 ii 1 1 1 1 1 (9) with Qi, bi, Ci, Di, M and m are material parameters.p˙is the effectiveplastic strain rate defined by Eq.(10).
= − =
p˙ 23d M¯ : ¯¯pl Hill 1: ¯dpl Kf n (10)
where K and n are Norton law parameters, and〈-〉 represents the Ma-caulay brackets.
Moreover, due to the normality rule, the multiaxial plastic strain rated¯pl for viscoplastic material is given by Eq.(11)for the case of the
isotropic hardening and by Eq. (12) for the case of the kinematic hardening. = ∂ ∂ = d p f σ p MJ σS ¯ ˙ ¯ 32˙ M¯¯ : ¯(¯) pl Hill Hill (11) = ∂∂ = −− d¯ p f˙ σ¯ 32p M˙ J¯¯ : ( ¯(¯σ XS X¯ )¯ ) M pl Hill Hill (12)
This model requires the identification of several parameters, which are Young's modulus E, the hardening parameters Qiand bi, Ciand Di
(depending on the selected model formulation) and the static recovery parameters M and m, the viscoplastic flow rule coefficients K and n and the yield criterion parameters F, G, H, L. Poisson's ratio ν will be taken constant, equal to 0.3. These multiaxial constitutive equations were integrated into a large strain finite-element solver Abaqus®through the
software Zmat®in order to simulate the omega shape forming test.
4.2. Identification methodology and comparison between experiment and modelling
The identification of the model parameters was performed in five stages. These steps are presented below and summarized inFig. 9.
•
First, the RD tests were examined– the stress relaxation tests were used to determined the non-viscous stress corresponding to the stabilized stress value at the end of the holding stage. This value was then used to determine the viscous stress occurring in the large deformation tests for each strain rate considered. Thus, a first assessment of the Norton law (parameters K and n) was found.
– Next, the first kinematic hardening variable (parameters C1and
Fig. 8. Evolution of the punch force over displacement for different conditions. Key: Temperature - {RD=rolling direction, TD=transverse direction} – Punch speed [mm/s] – gap between blank-holder and specimen [mm].
D1) was determined by using the cyclic tests. The static recovery
terms (parameters M and m) were calibrated by using the re-laxation curves, allowing a better fit of the behaviour model for the low strain rates. At this stage, as only the rolling direction (α = 0°) was being investigated, a von Mises yield criterion was employed. Associated with a viscoplastic flow rule and a kine-matic hardening, the model formulation was able to reproduce the cyclic tests for several strain rates.
– Lastly, a second and a third kinematic hardening variable (para-meters Ci, Di; i = 2, 3) was added to extend the prediction to the
large deformation.
•
Secondly, the Hill yield criterion was identified by considering the tensile tests under large deformation conditions along the three orientations (RD, DD, TD).•
Finally, all the parameters were adjusted by using an optimization toolbox provided by the software Zset®[31].At the end, a unique set of parameters was determined for the entire database. In the case of a monotonic loading (tension or compression), the parameters of the isotropic hardening Qiand bifor i = 1, 2, 3 can be
deduced from the identification procedure considered for the kinematic component by the relationship given in Eq. (13). Thus, both model formulations can be studied.
⎧
⎨⎩CDi⇔i⇔Q bb i 1, 2, 3i ii ⎫⎬⎭ = (13)
For monotonic loadings, both approaches provide the same stress–strain response (tension or compression), whereas the formula-tion including the kinematic hardening gives the best predicformula-tion for cyclic loading. Fig. 10 shows the results provided at 400 °C. Good agreement was found after optimization, regardless of the test condi-tions.Fig. 10(a)–(c) illustrates computed strain–stress curves compared to the experimental results at 400 °C under small strain conditions, first in compression–tension at 10−4s−1strain rate, then in
tension-com-pression at 10−2s−1strain rate and lastly for the stress relaxation test.
For the latter test, a dwell time of 300 s was considered, and the plastic strain rate reached very low values (10−12s−1) at the end of the
re-laxation time. These conditions broadly cover the strain rate range in-duced in the forming process.
Finally, Fig. 10(d) illustrates computed strain–stress curves
compared to the experimental results at 400 °C under large deforma-tion.
In a similar way to the tests performed at 400 °C, Fig. 11(a)–(d) gives the comparison between experimental and model prediction at 500 °C. In this case the model remains in good agreement with the experimental data under small and large deformations. On the elastic part the model is perfectly accurate with respect to the experimental data. Some discrepancies are observed at the beginning of the inelastic behaviour, mainly due to the scattering of the data between tests under small and large deformation conditions coming from two different de-vices.
Fig. 12 shows the results of the model with respect to several loading directions. We can notice that experimentally the anisotropy effect is more dominant at 400 °C than at 500 °C. The results found by Chartrel[32]are confirmed.
5. FE simulation of the experimental Omega shape forming operation
In this study, the implicit FE-code Abaqus 6.14®is used in
associa-tion with the UMAT facility Zmat®[31]. In such a framework, complex
geometries in industrial applications with large deformations, non-linear materials and contacts can be effectively covered. To validate the mechanical behaviour model, the punch force and the displacement of the specimen predicted by FEM and obtained by Omega shape test were compared. The FE model used a quarter of the real Omega shape. A 3D discrete rigid tool (punch, die and blank-holder) with 4-nodes, bilinear quadrilateral elements (R3D4) and a 3D solid homogeneous deformable specimen using a 4-node shell element (S4) were used. The material behaviour was modelled by the elasto-viscoplastic models described above.
An example of the FE-model result is shown in Fig. 13. The boundary conditions are 0.5 mm/s punch velocity and the gap between blank-holder and die is about 0.1 mm. The contact between specimen and tools is described by surface-to-surface contact with a friction coefficient of 0.4 (Coulomb's law). This value is selected to be in the same order than values from the literature such as the work of Ma et al. [33]on the tribological behaviour of Ti-6Al-4V alloy in contact with AISI H13 tool steel. In this investigation, the test conditions (materials, temperatures, friction conditions) perfectly match with the test
Fig. 10. Graphs for true stress–true strain for RD, at 400 °C: push-pull at 10−4s−1strain rate (a), pull-push at 10−2s−1strain rate (b), relaxation test at 10−4s−1first
conditions of the present study. Indeed, at 400 °C the authors obtained a value of 0.425 under dry friction and a value of 0.3875 at 500 °C. The average calculation time for one forming step, with an Intel®Core™ i5
CPU @ 1.70 GHz and 8.00 GB RAM, was about 13 h.
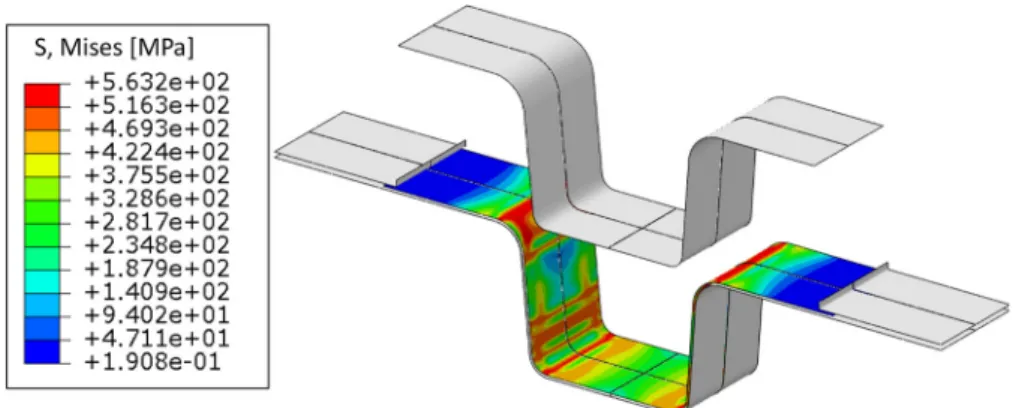
Fig. 13gives the von Mises stress map on the top of the specimen at the end of the stamping operation. At this step, the maximal stress is located at the entry at the input radius die (960 MPa).
The results of these FE simulations were compared to experimental forming tests (seeFig. 14) in terms of punch force–displacement. The punch force evolution was nearly constant from 10 mm to 35 mm. Be-yond this value, the punch force rapidly increased when the specimen came into contact with the bottom of the die.
Here, the comparison of behaviour models (kinematic and isotropic components) does not discriminate as to whether one model is more suited than the other to describe the behaviour of the material. However, the two behaviour models accurately describe the punch force evolution with a maximum average gap of 12% at −10 mm dis-placement.
In addition to the comparison of the punch force as a function of the displacement,Fig. 15illustrates the springback observed on the part after the forming operation. This springback was quantified by mea-suring the angle between the inferior horizontal plane of the sample and the wall on one hand (β angle), and between the superior hor-izontal plane and the lug of the specimen on the other hand (α angle).
Fig. 11. Graphs for true stress–true strain for RD, at 500 °C: push-pull at 10−2s−1strain rate (a), pull-push at 10−4s−1strain rate (b), relaxation test at 10−4s−1first
strain rate (c), uniaxial tensile test at 10−2s−1, 10−3s−1and 10−4s−1strain rate (d).
Fig. 12. Graphs for true stress–true strain at 10−4s−1strain rate and for RD, DD, TD and model at: 400 °C (a) and 500 °C (b).
Here we can observe that the FE simulation process including the be-haviour model with the kinematic component offers the best agreement with the experiment.
A final analysis can be made by observing the evolution of the loading path along the specimen. Three distinct regions can be identi-fied as suggested byFig. 16. The evolution of stress level as a function of strain on these regions and calculation using the different behaviour models shows that, on the wall, several locations pass through a bending-unbending cycle involving various stress responses. Indeed, the strain–stress responses predicted by the behaviour models will be different, which greatly influences the residual stress levels and con-sequently leads to modified springback effects (cf.Fig. 15). This phe-nomenon is more marked at 400 °C, where the springback gap predicted by the FE model is more visible, as shown inFig. 15.
6. Discussion
This work involves comparison of experimental and theoretical predictions of isothermal hot/warm stamping operations with various hardening models. To predict the formability of industrial parts, FE tools are widely used[34–37]. However, FE simulation of a stamping operation remains very complex because many parameters have to be determined. In particular, the sheet metal behaviour model is one of the major parameters of the FE simulation. To identify this behaviour law, a series of tests is essential and can be more or less complex to carry out [28].
In this study, the tests performed on Ti-6Al-4V titanium alloy show elastic isotropy and plastic anisotropy. The tests carried out by Odenberger et al. [5], which examined a particular Ti-6Al-4V plate, exhibit an asymmetric behavior. However, the actual values of yield
stress and Young's modulus differ from what was previously reported by Odenberger et al.[5]. This work shows the influence of several key parameters on the material behaviour in the conditions cited above. On the other hand, the strain rate sensitivity (10 s− −2 1≤ ≤ϵ˙ 10 s− −4 1) is
characterized by a decrease in the stress level and an increase in the elongation before necking as the strain rate decreases. The material also exhibits a temperature sensitivity (from 400 °C to 500 °C) with better formability and increased elongation when the temperature rises. A number of other authors report the same results, e.g. Vanderhasten[8]. The plastic anisotropy of the material is marked and can not be ignored. To this end, the evolution of the plastic strain ratio was analysed. The calculated values are in a good agreement with the results given by Odenberger et al.[16]or Chartrel et al.[10](cf.Table 2).
Depending on the complexity of the loading path, the choice of the hardening component can be important. The present approach com-pares both isotropic and kinematic hardening evolutions combined with a viscoplastic flow and an anisotropic yield criterion. This type of model is rarely used because it is complex to identify but gives a precise de-scription of the hot/warm isothermal stamping operation. The work of Kotkunde et al.[29]shows that an exponential hardening law com-bined with Hill or Cazacu yield criteria best predict titanium alloy be-haviour. The model developed in this work shows good accuracy compared with experiments and combines the same components as those proposed by Kotkunde et al.[29]. The robustness of the approach with respect to multiaxial loadings is achieved by conducting tests on technological specimens (Omega shape test) and by comparing the re-sults with FE simulations.
These analyses investigate some parameters, such as punch speed or specimen orientation. The results show that the punch force data is too macroscopic to be a discriminatory factor. Therefore, the measurement of the springback was analysed, and its prediction was found to be significantly influenced by the selected model formulation. Indeed, the analysis of the loading path given by the numerical simulation along the Omega specimen for the two hardening evolutions (Fig. 16) shows tension-compression or compression-tension loading in some regions. As discussed in the first part of the present study, kinematic hardening component is well adapted to describe such kinds of loading paths whereas isotropic hardening variable is not really adequate (Fig. 11(a) and (b)). Therefore, a better prediction of the kinematic hardening model is expected. This result can be confirmed by the comparison of the springback effect between the numerical simulations and experi-ment at the end of the forming stage as illustrated inFig. 15.
7. Conclusion
This work involves comparison of experimental and theoretical predictions of hot/warm isothermal stamping operations with various hardening models. Based on the results, the main findings can be itemized as follows:
Fig. 14. Comparison of the punch force evolution between experiments and the different isotropic and kinematic hardening models at 500 °C.
•
At the temperature considered here, the material exhibits symme-trical behaviour in tension and compression, a plastic strain ratio reduction and a higher sensitivity to strain rate when the tempera-ture rises.•
In the stamping process, the sheet passes through different loading conditions. Tests performed to identify a stamping behaviour model must take into account loading-unloading effects due to the sheet sliding between the blank-holder and the die.•
The kinematic hardening model associated with the Hill yield cri-terion correctly describe the Ti-6Al-4V mechanical behaviour under hot stamping conditions in the temperature range 400–500 °C in the case of a technical specimen (Omega test forming).Acknowledgements
The authors gratefully acknowledge the two companies Aurock and Loire Etude for their financial support. Special thanks to the ICA la-boratory's technical staff: T. Papaïx, D. Ade, J.-M. Mouys and S. Tovar for their help.
References
[1] Marciniak Z, Duncan JL, Hu SJ. Mechanics of sheet metal forming. Edition Elsevier; 2002.https://doi.org/10.1007/BF02330250.
[2] Banabic D. Sheet metal forming processes: constitutive modelling and numerical simulation. Edition Springer; 2010.https://doi.org/10.1007/978-3-540-88113-1. pp. XV, 301.
[3] Lütjering G, Williams J. Titanium. Edition Springer; 2007.https://doi.org/10.1007/ 978-3-540-73036-1.
[4] Stutz L, Beck W, Arends S, Ventzke V, Kashaev N. Material saving and cost reduction with hot forming of a U-shaped titanium part. Materialwiss Werkst
2014;45(9):841–6.https://doi.org/10.1002/mawe.201400292.
[5] Odenberger E-L, Hertzman J, Thilderkvist P, Merklein M, Kuppert A, Stöhr T, et al. Thermo-mechanical sheet metal forming of aero engine components in Ti-6Al-4V – Part 1: Material characterisation. Int J Mater Form 2013;6(3):391–402.https://doi. org/10.1007/s12289-012-1093-8.
[6] Alabort E, Putman D, Reed RC. Superplasticity in Ti-6Al-4V: characterisation, modelling and applications. Acta Mater 2015;95:428–42.https://doi.org/10.1016/ j.actamat.2015.04.056.
[7] Velay V, Matsumoto H, Vidal V, Chiba A. Behavior modeling and microstructural evolutions of Ti-6Al-4V alloy under hot forming conditions. Int J Mech Sci 2016;108-109:1–13.https://doi.org/10.1016/j.ijmecsci.2016.01.024. [8] Vanderhasten M. Ti-6Al-4V: deformation map and modelisation of tensile
beha-viour. Royal Military Academy – Katholieke Universiteit Leuven; 2007. [Ph.D. thesis].
[9] Gilles G, Hammami W, Libertiaux V, Cazacu O, Yoon J, Kuwabara T, et al. Experimental characterization and elasto-plastic modeling of the quasi-static me-chanical response of TA-6V at room temperature. Int J Solids Struct
2011;48(9):1277–89.https://doi.org/10.1016/j.ijsolstr.2011.01.011.
[10] Chartrel B, Massoni E. Deep drawing of Ti6Al4V: experiments and modeling over a wide range of strain rates and temperatures. Key Eng Mater 2013;554-557:190–5.
https://doi.org/10.4028/www.scientific.net/KEM.554-.
[11] Majorell A, Srivatsa S, Picu RC. Mechanical behavior of Ti-6Al-4V at high and moderate temperatures – Part I: Experimental results. Mater Sci Eng A 2002;326:297–305.https://doi.org/10.1016/S0921-5093(01)01507-6. [12] Nemat-Nasser S, Guo WG, Nesterenko VF, Indrakanti SS, Gu YB. Dynamic response
of conventional and hot isostatically pressed Ti-6Al-4V alloys: experiments and modeling. Mech Mater 2001;33:425–39.https://doi.org/10.1016/S0167-6636(01) 00063-1.
[13] Hill R. A theory of the yielding and plastic flow of anisotropic metals. Proc Royal Soc A 1948;193(1033):281–97.https://doi.org/10.1098/rspa.1948.0045. [14] Barlat F, Lege DJ, Brem JC. A six-component yield function for anisotropic
mate-rials. Int J Plasticity 1991;7(7):693–712.https://doi.org/10.1016/0749-6419(91) 90052-Z.
[15] Cazacu O, Plunkett B, Barlat F. Orthotropic yield criterion for hexagonal closed packed metals. Int J Plasticity 2006;22(7):1171–94.https://doi.org/10.1016/j. ijplas.2005.06.001.
[16]Odenberger E-l. Material characterisation for analyses of titanium sheet metal forming. Luleå University of Technology; 2005. [Ph.D. thesis].
[17] Tuninetti V, Gilles G, Milis O, Pardoen T, Habraken AM. Anisotropy and tension-compression asymmetry modeling of the room temperature plastic response of Ti-6Al-4V. Int J Plasticity 2015;67(1):53–68.https://doi.org/10.1016/j.ijplas.2014. 10.003.
[18] Pan W, Krohn M, Leen SB, Hyde TH, Walløe S. A sigmoidal model for superplastic deformation. J Mater Des Appl 2005;219(3):149–62.https://doi.org/10.1243/
Fig. 16. Evolution of the loading path over time for the different behaviour models. Table 2
Values of the plastic strain ratio for the two temperatures, 400–500 °C.
r(RD) r(DD) r(TD)
400 °C 0.514 1.100 0.617
146442005X10355.
[19] Correlated solutions. Non-contracting measurement solutions (2017).http:// correlatedsolutions.com/.
[20] Sutton MA, Orteu JJ, Schreier H. Image correlation for shape, motion and de-formation measurements. Springer US; 2009. https://doi.org/10.1007/978-0-387-78747-3.
[21] Aladjem A. Anodic oxidation of titanium and its alloys. J Mater Sci 1973;8(5):688–704.https://doi.org/10.1007/BF00561225.
[22] Savitzky A, Golay MJE. Smoothing and differentiation of data by simplified least squares procedures. Anal Chem 1964;36(8):1627–39.https://doi.org/10.1021/ ac60214a047.
[23] Col A. Emboutissage des tôles - Importance des modes de déformations, Techniques de l’ingénieur BM7510 (2011) 1–25.
[24] Simon P, Sabourin F, Morestin F, Phan L. Direct identification of a combined hardening with a cyclic bending test. IDDRG. 2005.
[25] Makinouchi A. International conference and workshop on numerical simulation of 3-D sheet metal forming processes, NUMISHEET '93. 1993.
[26] Odenberger E-L, Pederson R, Oldenburg M. Thermo-mechanical material response and hot sheet metal forming of Ti-6242. Mater Sci Eng A 2008;489(1-2):158–68.
https://doi.org/10.1016/j.msea.2007.12.047.
[27] Hull D, Bacon DJ. Introduction to dislocations. 5th ed. Edition Elsevier; 2011.
https://doi.org/10.1016/B978-0-08-096672-4.00011-6.
[28] Lemaitre J, Chaboche J-L, Benallal A, Desmorat R. Mécanique des matériaux
solides. Edition Dunod; 2009.
[29] Kotkunde N, Krishna G, Krishna Shenoy S. Experimental and theoretical in-vestigation of forming limit diagram for Ti-6Al-4V alloy at warm condition. Int J Mater 2017;10:255–66.https://doi.org/10.1007/s12289-015-1274-3.
[30]Decultot N. Formage incrémental de tôle d’aluminium: étude du procédé à l’aide de la mesure de champs et identification de modèles de comportement. Université Paul Sabatier – Toulouse 3; 2009. [Ph.D. thesis].
[31] Foerch R, Besson J, Cailletaud G, Pilvin P. Polymorphic constitutive equations in finite element codes. Comput Methods Appl Mech Eng 1997;141(96):355–72.
https://doi.org/10.1016/S0045-7825(96)01111-5.
[32]Chartrel B. Analyse et optimisation des procédés de formage de pièces en alliage de Titane. Université de recherche Paris Sciences et Lettres; 2016. [Ph.D. thesis]. [33] Ma J, Li H, Wang D, Fu MW, Tao ZJ. Tribological behaviors in titanium sheet and
tube forming at elevated temperatures: evaluation and modeling. Int J Adv Manuf Technol 2018;97(1):657–74.https://doi.org/10.1007/s00170-018-1985-y. [34] Tekkaya AE. State-of-the-art of simulation of sheet metal forming. J Mater Process
Technol 2000;103:14–22.https://doi.org/10.1016/S0924-0136(00)00413-1. [35]Cook RD, Malkus DS, Plesha ME, Witt RJ. Concepts and applications of finite
ele-ment analysis. Edition Wiley; 2002. ISBN: 978-0-471-35605-9.
[36]Crisfield M. Non-linear finite element analysis of solids and structures. Edition Wiley; 2000.
[37]Vince A, Askenazi A. Building better products with finite element analysis. Edition Delmar; 1999. ISBN-10: 156690160X.