OATAO is an open access repository that collects the work of Toulouse
researchers and makes it freely available over the web where possible
Any correspondence concerning this service should be sent
to the repository administrator:
tech-oatao@listes-diff.inp-toulouse.fr
This is a Publisher’s version published in:
http://oatao.univ-toulouse.fr/25062
To cite this version:
Rahmalia, Winda
and Fabre, Jean-François
and Usman, Thamrin and
Mouloungui, Zéphirin
Adsorption Characteristics of Bixin on Acid- and
Alkali-Treated Kaolinite in Aprotic Solvents. (2018) Bioinorganic Chemistry
and Applications, 2018. 1-9. ISSN 1565-3633
Research Article
Adsorption Characteristics of Bixin on Acid- and
Alkali-Treated Kaolinite in Aprotic Solvents
Winda Rahmalia,
1,2Jean-François Fabre,
1Thamrin Usman,
2and
Z´ephirin Mouloungui
1,31Universit´e de Toulouse, INP-ENSIACET, Laboratoire de Chimie Agro-industrielle (LCA), 4 All´ee Monso, 31030 Toulouse, France 2Department of Chemistry, Mathematics and Natural Science, Tanjungpura University, Jl. Ahmad Yani, Pontianak 78124,
West Kalimantan, Indonesia
3INRA, UMR 1010 CAI, 31030 Toulouse, France
Correspondence should be addressed to Z´ephirin Mouloungui; zephirin.mouloungui@ensiacet.fr Received 29 August 2017; Accepted 31 October 2017; Published 18 January 2018
Academic Editor: Spyros P. Perlepes
Copyright © 2018 Winda Rahmalia et al. This is an open access article distributed under the Creative Commons Attribution License, which permits unrestricted use, distribution, and reproduction in any medium, provided the original work is properly cited. The adsorption of bixin in aprotic solvents onto acid- and alkali-treated kaolinite was investigated. Kaolinite was treated three times, for 6 h each, with 8 M HCl or 5 M KOH. The adsorbents were characterized by XRD, FT-IR, EDS, and BET-N2. The effects of
contact time and dye concentration on adsorption capacity and kinetics, electronic transition of bixin before and after adsorption, and also mechanism of bixin-kaolinite adsorption were investigated. Dye adsorption followed pseudo-second order kinetics and was faster in acetone than in dimethyl carbonate. The best adsorption results were obtained for KOH-treated kaolinite. In both of the solvents, the adsorption isotherm followed the Langmuir model and adsorption capacity was higher in dimethyl carbonate (qm�0.43 mg/g) than in acetone (0.29 mg/g). The adsorption capacity and kinetics of KOH-treated kaolinite (qm�0.43 mg/g, k2�3.27 g/mg·min) were better than those of HCl-treated kaolinite (qm�0.21 mg/g, k2�0.25 g/mg·min) and natural kaolinite
(qm�0.18 mg/g, k2�0.32 g/mg·min). There are shift in the band position of maximum intensity of bixin after adsorption on this
adsorbent. Adsorption in this system seemed to be based essentially on chemisorption due to the electrostatic interaction of bixin with the strong basic and reducing sites of kaolinite.
1. Introduction
Bixin (methyl hydrogen 9′-cis-6,6′-diapocarotene-6,6′-dio-ate, C25H30O4) is a carotenoid dye extracted from the seeds
of the tropical shrub annatto (Bixa orellana L.) [1]. It is widely used in industry, cosmetics, and pharmaceutical products and as a food colouring and textile dye [2–5]. Bixin has photoactive properties and was recently explored as a sensitizing dye in solar cells [6–8] and for photodynamic therapy [9]. The potential uses of bixin in these applications are based on the conjugated double bond which can absorb energy in the visible region (400–500 nm), yielding colours in the yellow, orange, and red range. However, as other carotenoids, this double bond renders bixin unstable to light, temperature, and oxygen exposure [10, 11].
The poor heat and light stability of carotenoids in vitro is problematic when trying to construct photofunctional materials,
such as photosensitized semiconductors and nonlinear optical materials [12]. There have been reports of efforts to increase the stability of bixin to render it suitable for a broader range of applications, by incorporating this molecule into the surface or interlayer space of clay minerals. Kohno et al. [13] showed that annatto dye/organo-montmorillonites were more pho-tostable than pure annatto dye because the layered structure of the montmorillonite protected the dye molecules from external oxygen. Rahmalia [14] reported the immobilization of bixin on natural kaolinite. The resulting product had slower degradation kinetics in acetone than pure bixin. Furthermore, solar cells sensitized with bixin immobilized on acid-activated kaolinite [7] had a higher energy conversion efficiency than cells sensitized with pure bixin [6].
The incorporation of various organic compounds into clays and clay minerals has been reported, due to the surface properties of these minerals, such as their adsorption
Hindawi
Bioinorganic Chemistry and Applications Volume 2018, Article ID 3805654, 9 pages https://doi.org/10.1155/2018/3805654
capacities, surface charges, their large surface area, charge density, types of exchangeable cations, hydroxyl groups on the edges, silanol groups of crystalline defects or broken surfaces, and Lewis and Br¨onsted acidity [15–17]. Kaolinite (Al2Si2O5(OH)4) is a relatively inexpensive clay mineral that
is highly effective as a carrier material. This behaviour is governed by the extent and nature of the external surface, which can be modified by appropriate treatment techniques [18–20]. Activation with acid or alkali has been widely studied as a chemical treatment for improving the surface characteristics of natural kaolinite in terms of its interactions with adsorbate [21–23]. Kaolinite is also hydrophobic and could therefore easily adsorb hydrophobic organic mole-cules, such as bixin [24–27]. The use of an activation process without heating for the ultimate enhancement of energy economics for bixin was investigated.
Clay minerals have been used as solid matrices to en-hance the stability of bixin, but no systematic study has described the mechanism of bixin adsorption onto kaolinite. Rapid and efficient dye adsorption is important for in-dustrial applications. The isotherm and adsorption kinetics of bixin were therefore determined on acid- and alkali-treated kaolinite. Unalkali-treated kaolinite was also tested for the purpose of comparison. Acetone and dimethyl carbonate were used as solvents because bixin was highly soluble in both these aprotic solvents. We previously reported that the transition energy and molar attenuation coefficient of bixin in dimethyl carbonate were similar to those in acetone [28]. Dimethyl carbonate would therefore be an appropriate al-ternative to volatile organic solvents like the nonpolar aprotic solvent acetone. Dimethyl carbonate is widely used as dialkyl carbonate with many applications in novel green chemistry [29]. It is a valuable chemical for industrial chemical engineering, due also to its low toxicity [30]. This study identified appropriate ketone and carbonate solvents for use in applications of bixin. Such applications, including the synthesis of a new sensitizing kaolinite-bixin dye, have become important in several fields.
2. Materials and Methods
2.1. Materials. Bixin crystals containing 88.11% cis-bixin and 11.75% di-cis-bixin and an unknown compound (0.14%) were obtained by the extraction and purification processes described by Rahmalia et al. [31]. Kaolinite (Al2O7Si2.2H2O),
CAS Number 1318-74-7, was supplied by Sigma-Aldrich (Germany), together with analytical grade hydrochloric acid (HCl, 37%) and potassium hydroxide (KOH), and the HPLC grade solvents acetone (≥99.5%) and dimethyl car-bonate (99%) were supplied by Sigma-Aldrich (Germany). 2.2. Methods
2.2.1. Preparation of Acid- and Alkali-Treated Kaolinite. Activation was achieved by adding 10 g of kaolinite to 100 mL 8 M HCl or 100 mL 5 M KOH separately. The mixtures were incubated at room temperature for 6 h, with constant shaking (300 rpm). The suspension was filtered, and the residue was washed with distilled water until neutral
and then dried in an oven at 103°C for 24 h. This process was repeated three times to optimize activation. The final products obtained are referred to as KA for HCl-treated kaolinite and KB for KOH-treated kaolinite. The untreated sample is referred to as KN.
2.2.2. Characterization of the Adsorbent. X-ray diffraction (XRD) patterns for the samples were obtained with a Bruker X-ray diffractometer (CuKα, λ � 1.54 ˚A, step scan size of 0.02° and a count time of 0.5 seconds, 25°C). Samples were prepared by allowing the particles of kaolinite to settle in water to obtain 2 μm particles. They were then treated with ethylene glycol and prepared as oriented mounts on a glass slide.
Fourier transform infrared spectroscopy (FT-IR) was carried out on a Shimadzu FT-IR spectrophotometer, over a spectral region of 400–4000 cm−1, with a resolution of 1 cm−1, and samples were evaluated in powder form mixed with KBr powder.
The BET surface area of the samples was determined by the multipoint N2 adsorption-desorption method at the
temperature of liquid nitrogen (−196°C), with an ASAP 2010 (Micrometrics) instrument.
Changes in elemental composition after treatment were assessed with an Edax Ametek high-resolution energy dis-persive X-ray spectroscopy (EDS) detector.
2.2.3. Adsorption Experiment. Stock solutions of bixin (20 mg/L) were prepared in acetone and dimethyl carbonate separately. Solutions of the required concentration (3–18 mg/L) were prepared by diluting the stock solution. Adsorbent (0.05 g) was then added to 5 mL bixin solution (3–18 mg/L). The mixtures were incubated at room temperature (∼22°C), with shaking at 300 rpm. The samples were withdrawn after 4 h (predetermined equilibrium time), and small aliquots of the supernatant were removed and diluted to an appropriate concentration if required. The absorption spectrum was de-termined immediately with a Shimadzu UV-1800 UV-Vis spectrophotometer. The bixin concentration of the solutions was determined with a UV spectrophotometer calibrated at 457 nm for acetone and 456 nm for dimethyl carbonate [28]. For the contact time studies, the residual concentration of the 5 mL bixin solution (±10 mg/L) with kaolinite (0.1 g) was de-termined at various time points, from 5 to 360 min. The ex-periments were carried out in triplicate.
3. Results and Discussion
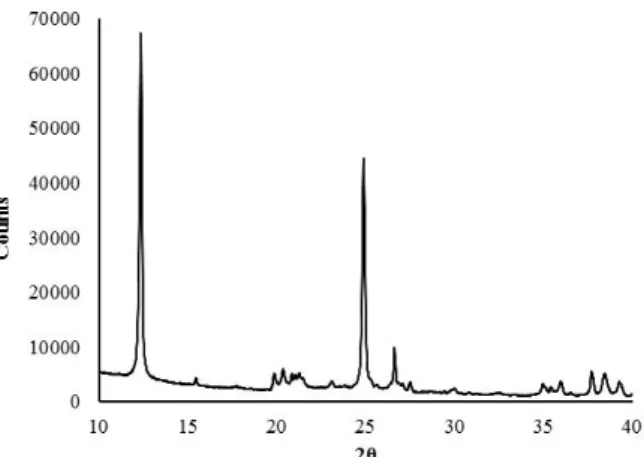
3.1. Characterization of Adsorbents. The XRD patterns of KN (Supporting Information Figure S1) showed two in-tense diffraction reflections at 2θ values of 12.3 and 24.9°, less intense reflections at 2θ values of 23.2 and 26.6°, and a hump at 2θ values of 19.8–21.5°, associated with kaolinite (PDF 00-058-2001). The diffraction reflections of orthoclase were found at 2θ values of 15.4, 21.0, 25.7, 27.5, and 30.1° (PDF 00-022-1212), whereas the diffraction reflections of muscovite were found at a 2θ value of 18.0°(PDF 00-058-2036). After treatment with KOH, the reflection width and intensity of kaolinite decreased at 2θ values of 12.3 and
24.9°. This decrease was attributed to a minor structural disorder resulting from alkali treatment, which affects the crystalline nature of the clay [32].
A diffractogram for KA showed no significant differ-ence with respect to KN, but 2θ values of 15.4 and 30.1° were unobservable, and the reflection increased at a 2θ of 12.3°(Figure 1). This finding may reflect the greater re-sistance to acid attack of the structure of kaolinite than that of orthoclase. The resistance of clay minerals to acid attack depends strongly on their crystallinity, with more regular crystals associated with greater resistance to acid attack [33]. It may also be due to the elimination of mineral impurities by acid leaching. The higher peak intensity may reflect the presence of larger crystallites or a decrease in mean lattice strain [32, 34].
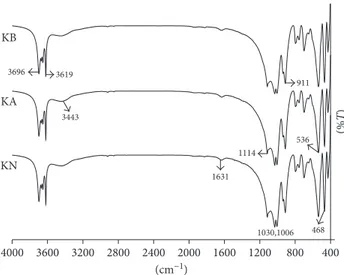
The FT-IR spectra of KN, KA, and KB (Figure 2) revealed bands at 3696, 3669, 3652, and 3619 cm−1 cor-responding to the stretching of inner-surface hydroxyl groups, at 3443 cm−1 corresponding to stretching of the hydroxyl group of water, 1631 cm−1corresponding to the O–H deformation of water, 1114 cm−1 corresponding to Si–O stretching (longitudinal mode), 1030 and 1006 cm−1 corresponding to in-plane Si–O stretching, 937 cm−1 corresponding to the OH deformation of inner-surface hydroxyl groups, 911 cm−1 corresponding to Al–OH de-formation, 794 cm−1corresponding to Si–O vibration, 755 and 696 cm−1 corresponding to Si–O perpendicular vi-brations, 536 cm−1corresponding to Al–O–Si deformation, 468 cm−1 corresponding to Si–O–Si deformation, and 428 cm−1corresponding to Si–O deformation [35, 36]. The FT-IR spectra patterns of KN, KA, and KB showed no significant differences between kaolinite before and after treatment, indicating an absence of significant change in
the kaolinite samples. Infrared absorption spectra, which displayed a fairly sharp absorption band at wave numbers around 911 cm−1 for both samples, showed an absence of change in the composition of the octahedral Al atoms following treatment with acid and alkali in the experi-mental conditions used.
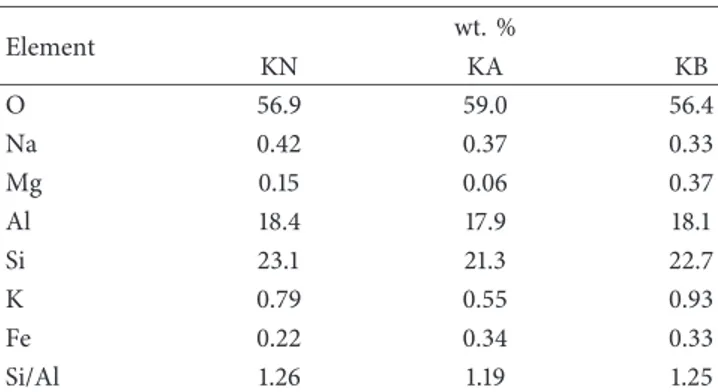
Changes in elemental composition were investigated by EDS (Table 1). The samples of kaolinite tested were rich in silicon and aluminium. Their composition in terms of impurities, such as Na, Mg, K, and Fe, depended on the type of reagent used. Si and Al contents only slightly decreased after treatment. This shows the re-sistance of natural kaolinite minerals to acid and alkali attack. 0 30,000 60,000 90,000 12.2 12.5 Counts 2 theta 3000 4000 5000 15.3 15.6 Counts 2 theta 0 30,000 60,000 24.5 25.2 Counts 2 theta 1500 2100 2700 29 30.5 Counts 2 theta 1000 3000 5000 7000 37.4 38 Counts 2 theta
Figure 1: X-ray diffraction (XRD) patterns of KN (—), KA (....), and KB (----).
400 800 1200 1600 2000 2400 2800 3200 3600 4000 (% T) (cm−1) KB KA KN 3696 3619 3443 911 1114 1631 536 1030,1006 468
Figure 2: FT-IR spectra of KN, KA, and KB.
The results of nitrogen sorption isotherm analysis are summarised in Table 2. The surface area, pore volume, and mean diameter of the untreated kaolinite sample were 7.65 m2/g, 3.62 × 10⁻²cm3/g, and 18.9 nm, respectively, indicating that the porosity of the original kaolinite was low. Pore volume and mean diameter increased after acid treatment, possibly due to the dissolution of metal ions present in the kaolinite and the rearrangement of its crystal structure, as a result of a reaction between the acid and the clay mineral. Treatment with 5 M alkali at room temper-ature has been shown to increase specific surface area but to decrease total pore volume and mean diameter. Belver et al. [21] reported an increase in specific surface area, pre-sumably because of the disaggregation/separation of kao-linite particles. The decrease in specific surface area observed for KA may be due to an increase in crystallinity, as indicated by XRD.
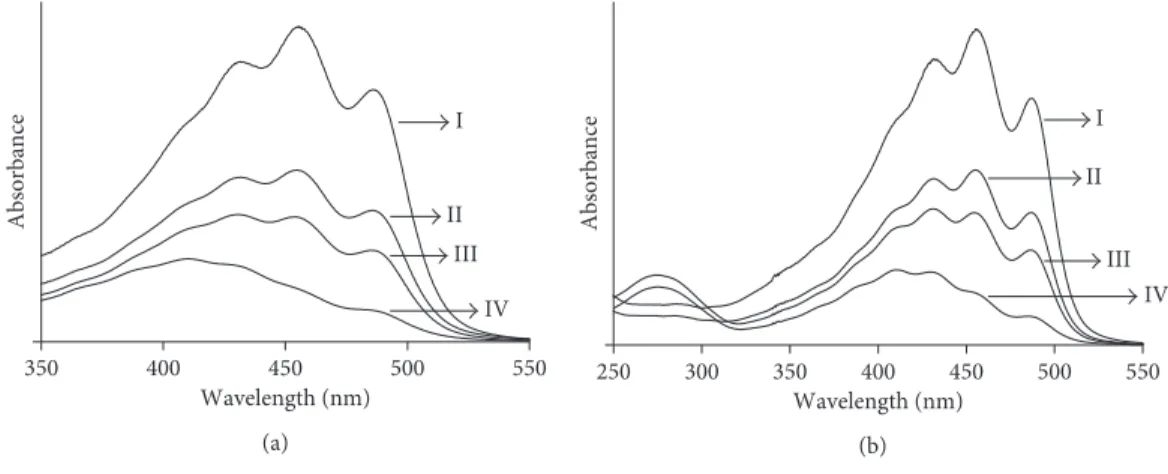
3.2. Electronic Transition of Bixin. The absorption spectrum of the supernatant of bixin in acetone and dimethyl carbonate was in the visible region, with peaks at 457 nm and 456 nm, respectively (Figure 3), associated with the 0-1 vibration band position, consistent with the finding of Rahmalia et al. [28]. After adsorption onto KA, the maximum intensity (λmax) of the bixin spectrum was still in the 0-1 band position. However, after adsorption onto KN and KB, the maximum wavelength shifted to shorter wavelengths, associated with a band position of 0–2 for KN and of 0–3 for KB, and intensity decreased. Schoonheydt and Johnston [37] reported that the ab-sorption maxima of dye molecules in nonpolar solvents adsorbed onto the surface of clay minerals could shift to shorter wavelengths because the solvent-molecule in-teraction was stronger in the ground state than in the excited state. Yariv and Cross [38] suggested that the absorption band of the adsorbed dye displayed a blue shift due to interactions between the π-electrons of the dye and the hybridised orbitals of the surface oxygen atoms, leading to a stabilisation of the π-orbitals and a destabi-lisation of the π∗-orbitals.
3.3. Effect of Contact Time. The effects of contact time on the amount of bixin adsorbed onto kaolinite were investigated (Figure 4). Kaolinites adsorb bixin with different efficiencies,
and bixin was rapid and strong during the initial period of contact, between 5 and 60 minutes. During this period, the tendency towards adsorption was high, and the slope of the adsorption curve was steep. This early phase of steep increase was followed by a phase of slow increase between 120 and 360 minutes. During this period, the slope of the adsorption curve gradually flattened out, and the bixin adsorption gradually decreased eventually reaching zero. This corre-sponded to equilibrium being reached due to the saturation of adsorption sites.
The single, smooth, and continuous nature of the curves suggested that the bixin might cover the kaolinite as a monolayer. The percentage dye adsorption was highest on KB, consistent with the BET specific surface area analysis, which indicated that adsorption was most likely to occur on the external surface of kaolinite. It took 180 minutes to reach equilibrium for bixin in acetone with KN as the adsorbent and 240 minutes for the same mixture but with KA or KB as the adsorbent. It took 240 minutes to reach equilibrium for bixin in dimethyl carbonate, with KN or KB as the adsor-bent, and 300 minutes for the same mixture but with KA as the adsorbent. This phenomenon is influenced by the surface properties of the adsorbent and the chemical and physical constants of the solvents.
3.4. Effect of Initial Dye Concentration. The effect of initial dye concentration on equilibrium adsorption was in-vestigated at different initial bixin concentrations. Initial bixin concentration affected the amount of bixin adsorbed at equilibrium (Figure 5). At low initial bixin concen-trations, the adsorption capacity of KN, KA, and KB increased with initial bixin concentration. It therefore seems likely that an increase in adsorption with initial dye concentration leads to an increase in mass gradient be-tween the solution and adsorbent, thereby driving the transfer of additional dye molecules from the bulk so-lution to the particle surface [39].
3.5. Adsorption Isotherm. Adsorption properties and equilibrium parameters, commonly known as adsorption isotherms, describe the interaction of the adsorbate with the adsorbents, improving understanding of the nature of the interaction. Isotherms provide information about the optimal use of adsorbents. When optimizing the design of an adsorption system, it is essential to establish the most appropriate correlation for the equilibrium curve. Several isotherm equations are available for analysis of experimental sorption equilibrium parameters. However, Langmuir and Freundlich models are the most widely
Table 1: EDS analysis data.
Element wt. % KN KA KB O 56.9 59.0 56.4 Na 0.42 0.37 0.33 Mg 0.15 0.06 0.37 Al 18.4 17.9 18.1 Si 23.1 21.3 22.7 K 0.79 0.55 0.93 Fe 0.22 0.34 0.33 Si/Al 1.26 1.19 1.25
Table 2: Nitrogen sorption isotherm data.
Sample BET specific surface area, asBET (m2g−1) Total pore volume (10−2cm3g−1) Mean pore diameter, dp(nm) KN 7.65 3.62 18.9 KA 7.28 3.74 20.6 KB 8.16 2.85 14.0
used type of isotherm [15, 23–25, 33, 40]. These models were used to explain the interaction between bixin and kaolinite in this study. They are the best models for explaining adsorption trends and are based on the ra-tionale that the adsorbents become saturated with ad-sorbate after sufficiently long contact times.
The Freundlich isotherm describes the nonspecific ad-sorption of a heterogeneous system and reversible adsorp-tion. The linear form of the Freundlich equation (1) is expressed as follows [41]:
log qe�log KF+1
nlog Ce, (1)
where 1/n is a combined measurement of the relative magnitude and diversity of energies associated with a par-ticular sorption process.
In the Langmuir model, the mass of solute adsorbed per unit mass of adsorbent increases linearly with solute concentration at low surface coverage, approaching an asymptote as the adsorption sites become saturated. Equation (2) is based on three important assumptions: (1) the energy of adsorption is identical for all sites and is independent of surface coverage, (2) adsorption occurs only at localised sites, with no interaction between ad-joining adsorbed molecules, and (3) the sorption maximum represents monolayer coverage. The linear form of the Langmuir equation (2) can be expressed as follows [42]:
Ce qe � 1 KL· qm + 1 qm Ce. (2)
We calculated the values of the parameters of the Freundlich and Langmuir model (Table 3). The equilib-rium data were not consistent with the Freundlich equation for all adsorbents, in either of the two solvents. The poor fit of this model was demonstrated by the very low correlation coefficient (r2< 0.95). The values of 1/n < 1 indicates a nonlinear adsorption of the Freundlich model and corresponds to a Langmuir-type isotherm curve, in which marginal sorption energy decreases with increasing surface concentration. The Langmuir equation
gave a better fit, with r2> 0.95, indicating a homogeneous active site and the coverage of the adsorbent surface with a monolayer of bixin. Based on qm values, bixin ad-sorption to KB was more favourable than its adad-sorption to KA and KN.
The adsorption capacity of the adsorbents appeared to increase with specific surface area. The capacity of bixin to adsorb to adsorbents may reflect the extent to which the kaolinite was able to swell. The physical swelling of the kaolinite probably depended on the bulk properties of the intervening solvent molecules. In nonpolar solvents, increase in dielectric constant function (R(ε)) is associated with decreases in the volume of the kaolinite, due to lower levels of physical swelling [43]. Adsorption ca-pacity was therefore greater when dimethyl carbonate (R(ε) � 0.412) was used as a solvent, because this solvent has lower dielectric constants than acetone (R(ε) � 0.872). The dimethyl carbonate also has several conformations (at least 3) against acetone which has only one confor-mation (Figure 6), causing the possibility of DMC molecules in the highly aggregated solvate. Two structure conformations of DMC (Figure 6b) are favourable be-tween DMC and KB which oxygen of DMC interact with metal atom of Si and Al of KB [44–46].
3.6. Adsorption Kinetics. Lagergren’s pseudo-first order and pseudo-second order models were used to investigate the dynamics of bixin adsorption onto kaolinite. The pseudo-first order model assumes that the rate of change of solute uptake over time is directly proportional to the difference in saturation concentration and the amount of solid uptake over time. In most cases, the adsorption reaction involves diffusion across a boundary (3) [47]. The adsorption process with chemisorptions controls the rate, according to the pseudo-second order model (4) [48].
log qe− qt �log qe− k1· t (2.303), (3) t qt� 1 k2q2 e + 1 qe · t. (4) 350 400 450 500 550 Absorbance Wavelength (nm) I II III IV (a) 250 300 350 400 450 500 550 Absorbance Wavelength (nm) I II III IV (b)
Figure 3: Absorption spectra of bixin in acetone (a) and dimethyl carbonate (b) before adsorption (I) and supernatant solution of bixin after adsorption on KN (III), KA (II), and KB (IV).
k1 and k2 were calculated from the intercept of the
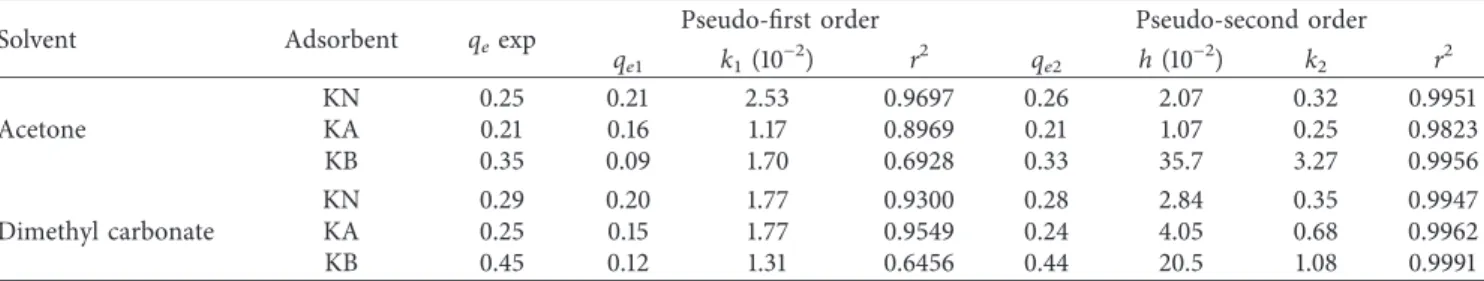
corresponding plots of log (qe–qt) against t and t/qtagainst t. They are shown in Table 4, along with the values for the correlation coefficients, qe1and qe2(calc.) and qe(exp.). The correlation coefficient values for the pseudo-second order rate equation were higher than those for the pseudo-first order rate equation (Table 4). The r2values for the plots were in the range 0.65–0.97 after application of the pseudo-first order model, but the calculated qe1values obtained with this model did not give reasonable values because they were lower than the experimental qevalues. The qe2and qevalues were very similar for the pseudo-second order model.
The adsorption process on all adsorbents in both solvents was found to follow the pseudo-second order kinetic model. These results suggest that chemisorption predominated in the adsorption occurring in this work [17]. The best results were obtained for KOH-treated kaolinite. Adsorption ki-netics was faster with acetone (k2�3.27) than with dimethyl
carbonate (k2�1.08) as the solvent. The smaller size of
ac-etone molecules than of dimethyl carbonate molecules and the lower viscosity of acetone (0.295 cP) than of dimethyl carbonate (0.585 cP) may facilitate the diffusion of bixin into the interlayer region of kaolinite.
3.7. Mechanism of Bixin-Kaolinite Adsorption. The FT-IR spectra of bixin dye and of bixin-KB following adsorption for different times were obtained (Figure 7). The spectrum of bixin dye may be assigned as follows: the –O–H stretching vibration at 3420 cm−1, the H–C–H bending vibration at 2957, 2917, and 2850 cm−1, the C�O ester group at 1731 cm−1, the O–H bending vibration at 1620 cm−1, the alkene C�C stretching at 1469 cm−1, C–H bending of the methyl groups at 1378, C�O stretching at 1220 cm−1, symmetric and asymmetric vibrations of the C–O–C ester group at 1180 cm−1, and the methylene rocking vibration of cis-carotenoid at 720 cm−1[49].
Figure 7 shows significant frequency modifications of the absorption bands from bixin in low frequency areas between 3400 and 3700 cm−1 and in high frequency areas between 1600 and 1750 cm−1. Functional groups COOH and COOR from bixin strongly absorb at strong basic and reducing sites of KN through electrostatic interactions. The frequency of bands at 3420 cm−1 disappears in favour of frequency of bands at 3619 cm−1. The same phenomenon was observed in high frequency areas; the frequency of bands at 1731 cm−1 disappears in favour of frequency of bands at 1620 cm−1. This indicated strong interactions between two types of metal 0
30 60 90
0 60 120 180 240 300 360
Percentage bixin adsorbed (%)
t (min) (a) 0 30 60 90 0 60 120 180 240 300 360 t (min)
Percentage bixin adsorbed (%)
(b)
Figure 4: Effect of contact time on adsorption of bixin using KN (◇), KA (□), and KB (○) in acetone (a) and dimethyl carbonate (b).
0 0.2 0.4 0.6 0 0.005 0.01 0.015 qe (mg/g) Co (g/L) (a) 0 0.2 0.4 0.6 0 0.006 0.012 0.018 qe (mg/g) Co (g/L) (b)
Figure 5: Effect of initial dye concentration on adsorption of bixin using KN (◇), KA (□), and KB (○) in acetone (a) and dimethyl carbonate (b).
carboxylate groups, which result from a part of the in-teraction between the carboxylic group of the bixin and the other part of the carboxyester group of bixin, respectively, with Si and Al.
4. Conclusion
The adsorption characteristics of bixin onto kaolinite, es-pecially for constructing photofunctional materials based on
kaolinite-bixin organoclay, have been investigated. This adsorption is more dependent on the specific surface area of the adsorbent. The adsorption capacity of the kaolinite was considerably improved by an increase in the surface specific area. Alkali treatment (BET specific surface area � 8.16 m2g−1) was therefore more suitable than acid treatment for increasing the capacity of kaolinite to adsorb organic molecules, such as bixin. Selection of the most appropriate aprotic solvent also increased the efficiency of bixin ab-sorption onto kaolinite. Based on UV-visible spectroscopy data, the solvent-molecule interaction was stronger in the ground state than in the excited state. The adsorption iso-therm was of the Langmuir-type and was higher in acetone than in dimethyl carbonate. Dye adsorption followed pseudo-second order kinetics and was faster in dimethyl carbonate complex solvate than in acetone. Adsorption in this system appears to be mostly due to chemisorption mediated by the electrostatic interaction of bixin with the strong basic and reducing sites of kaolinite. Finally, dimethyl carbonate has potential as a good solvent with no compound organic volatile for increasing bixin adsorption onto kaolinite.
Nomenclature and Units
qe: Amount of dye adsorbed per unit of adsorbent at equilibrium (mg/g) O C H3C CH3 (a) O O O CH3 CH3 O O O CH3 CH3 O O O H3C CH3 (b)
Figure 6: Structure conformations of acetone (a) and dimethyl carbonate (b). Table 3: Adsorption isotherm parameters for the adsorption of bixin on kaolinite.
Solvent Adsorbent Freundlich Langmuir
KF 1/n r2 KL qm r2 Acetone KN 0.13 0.25 0.7043 1.16 0.24 0.9747 KA 0.14 0.17 0.7107 1.22 0.22 0.9691 KB 0.23 0.10 0.6005 4.00 0.29 0.9893 Dimethyl carbonate KN 0.14 0.10 0.5600 2.03 0.18 0.9915 KA 0.11 0.19 0.8362 0.48 0.21 0.9807 KB 0.32 0.14 0.5701 5.00 0.43 0.9927
Table 4: Adsorption kinetics parameters for the adsorption of bixin on kaolinite.
Solvent Adsorbent qeexp Pseudo-first order Pseudo-second order qe1 k1(10−2) r2 qe2 h (10−2) k2 r2 Acetone KN 0.25 0.21 2.53 0.9697 0.26 2.07 0.32 0.9951 KA 0.21 0.16 1.17 0.8969 0.21 1.07 0.25 0.9823 KB 0.35 0.09 1.70 0.6928 0.33 35.7 3.27 0.9956 Dimethyl carbonate KN 0.29 0.20 1.77 0.9300 0.28 2.84 0.35 0.9947 KA 0.25 0.15 1.77 0.9549 0.24 4.05 0.68 0.9962 KB 0.45 0.12 1.31 0.6456 0.44 20.5 1.08 0.9991 400 800 1200 1600 2000 2400 2800 3200 3600 4000 ( % T ) (cm−1) 0 minutes (bixin) 60 minutes 180 minutes 240 minutes 30 minutes (KB−bixin) 2850 1731 1620 3619 2917 3420 3696 911 536
Figure 7: FT-IR spectra of bixin dye and bixin-KB obtained from the processes of adsorption in different times.
Co: Initial concentration of the dye solution (mg/L) Ce: Concentration of the dye solution at adsorption
equilibrium (mg/L)
KF: Freundlich adsorption isotherm constant (mg1-1/nL1/ng) N: Freundlich adsorption isotherm constant
KL: Langmuir constant (L/mg)
qm: Maximum adsorption resulting in monolayer coverage on the adsorbent surface (mg/g)
qt: Amount of dye adsorbed per unit mass adsorbent at any time t (mg/g)
k1: Pseudo-first order adsorption rate constant (1/min)
k2: Pseudo-second order adsorption rate constant
(g/mg·min)
H: Initial adsorption rate at any time approaching 0 (mg/g·min)
R(ε): Dielectric constant function.
Conflicts of Interest
The authors declare that there are no conflicts of interest.
Acknowledgments
This study received financial support from the Direktorat Jenderal Pendidikan Tinggi. The authors thank Cedric Char-villat (Centre Inter-universitaire de Recherche et d’Ing´enierie des Mat´eriaux), Gw´ena¨elle Raimbeaux (Laboratoire de Genie Chimique), and Deni Ferdian (University of Indonesia) for assistance with the analysis of kaolinite samples by XRD, BET-N2, and EDS, respectively.
Supplementary Materials
Figure S1. XRD patterns of KN. (Supplementary Materials)
References
[1] G. Giuliano, C. Rosati, and P. M. Bramley, “To dye or not to dye: biochemistry of annatto unveiled,” Trends in Bio-technology, vol. 21, no. 12, pp. 513–516, 2003.
[2] C. R. Cardarelli, M. de Toledo Benassi, and A. Z. Mercadante, “Characterization of different annatto extracts based on an-tioxidant and colour properties,” LWT-Food Science and Technology, vol. 41, no. 9, pp. 1689–1693, 2008.
[3] D. Das, “Dyeing of wool and silk with Bixa orellana,” Indian Journal of Fibre and Textile Research, vol. 32, pp. 366–372, 2007.
[4] G. C. dos Santos, L. M. Mendonça, G. A. Antonucci, A. C. dos Santos, L. M. G. Antunes, and M. de Lourdes Pires Bianchi, “Protective effect of bixin on cisplatin-induced genotoxicity in PC12 cells,” Food and Chemical Toxicology, vol. 50, no. 2, pp. 335–340, 2012.
[5] A. Venugopalan, P. Giridhar, and G. A. Ravishankar, “Food, ethanobotanical and difersified applications of Bixa orellana L.: a scope for its improvement through biotechnological mediation,” Indian Journal of Fundamental and Applied Life Science, vol. 1, pp. 9–31, 2011.
[6] N. M. G´omez-Ort´ız, I. A. V´azquez-Maldonado, A. R. P´erez-Espadas, G. J. Mena-Rej´on, J. A. Azamar-Barrios, and G. Oskam, “Dye-sensitized solar cells with natural dyes
extracted from achiote seeds,” Solar Energy Materials and Solar Cells, vol. 94, no. 1, pp. 40–44, 2010.
[7] A. Hiendro, F. Hadary, W. Rahmalia, and N. Wahyuni, “Enhanced performance of bixin sensitized TiO2solar cells
with activated kaolinite,” International Journal of Engineering Research, vol. 4, pp. 40–44, 2012.
[8] T. Ruiz-Anchondo, N. Flores-Holgu´ın, and D. Glossman-Mitnik, “Natural carotenoids as nanomaterial precursors for molecular photovoltaics: a computational DFT study,” Mol-ecules, vol. 15, no. 7, pp. 4490–4510, 2010.
[9] M. Olson and N. D. Allen, “Natural photodynamic agents and their use,” U.S. Patent 60, vol. 982, p. 419, 2010.
[10] M. A. Montenegro, A. d. O. Rios, A. Z. Mercadante, M. A. Nazareno, and C. D. Borsarelli, “Model studies on the photosensitized isomerization of bixin,” Journal of Agricul-tural and Food Chemistry, vol. 52, no. 2, pp. 367–373, 2004. [11] A. d. O. Rios, C. D. Borsarelli, and A. Z. Mercadante, “Thermal degradation kinetics of bixin in an aqueous model system,” Journal of Agricultural and Food Chemistry, vol. 53, no. 6, pp. 2307–2311, 2005.
[12] T. Keinonen, “Investigation of grating recording in betacarotene-polystyrene film,” Journal of Modern Optics, vol. 44, no. 3, pp. 555–562, 1997.
[13] Y. Kohno, M. Inagawa, S. Ikoma et al., “Stabilization of a hydrophobic natural dye by intercalation into organo-montmorillonite,” Applied Clay Science, vol. 54, no. 3-4, pp. 202–205, 2011.
[14] W. Rahmalia, “Synthesis of kaolinite-bixin organoclay and their photostability test,” Ph.D. thesis, Magister of Biology, Christian University of Satya Wacana, Salatiga, Indonesia, 2009. [15] M. B. Abdul Rahman, S. M. Tajudin, M. Z. Hussein,
R. N. Z. R. Abdul Rahman, A. B. Salleh, and M. Basri, “Application of natural kaolin as support for the immobili-zation of lipase from Candida rugosa as biocatalsyt for ef-fective esterification,” Applied Clay Science, vol. 29, no. 2, pp. 111–116, 2005.
[16] C. R. Reddy, Y. S. Bhat, G. Nagendrappa, and B. S. Jai Prakash, “Brønsted and Lewis acidity of modified montmorillonite clay catalysts determined by FT-IR spectroscopy,” Catalysis Today, vol. 141, no. 1-2, pp. 157–160, 2009.
[17] V. Vimonses, S. Lei, B. Jin, C. W. K. Chow, and C. Saint, “Adsorption of congo red by three Australian kaolins,” Ap-plied Clay Science, vol. 43, no. 3-4, pp. 465–472, 2009. [18] R. L. Frost, ´E. Mak´o, J. Krist´of, and J. T. Kloprogge,
“Mod-ification of kaolinite surface through mechanochemical treatment-a mid-IR and near-IR spectroscopic study,” trochimica Acta Part A: Molecular and Biomolecular Spec-troscopy, vol. 58, no. 13, pp. 2849–2859, 2002.
[19] R. L. Frost, J. Krist´of, E. Mak´o, and E. Horv´ath, “A DRIFT spectroscopic study of potassium acetate intercalated mechanochemically activated kaolinite,” Spectrochimica Acta Part A: Molecular and Biomolecular Spectroscopy, vol. 59, no. 6, pp. 1183–1194, 2003.
[20] T. A. Khan, E. A. Khan, and Shahjahan, “Removal of basic dyes from aqueous solution by adsorption onto binary iron-manganese oxide coated kaolinite: nonlinear isotherm and ki-netics modeling,” Applied Clay Science, vol. 107, pp. 70–77, 2015. [21] C. Belver, M. A. Bañares Muñoz, and M. A. Vicente, “Chemical activation of a kaolinite under acid and alkaline conditions,” Chemistry of Materials, vol. 14, no. 5, pp. 2033– 2043, 2002.
[22] F. Slaty, H. Khoury, J. Wastiels, and H. Rahier, “Character-ization of alkali activated kaolinitic clay,” Applied Clay Sci-ence, vol. 75-76, pp. 120–125, 2013.
[23] Y. Hai, X. Li, H. Wu, S. Zhao, W. Deligeer, and S. Asuha, “Modification of acid-activated kaolinite with TiO2and its use
for the removal of azo dyes,” Applied Clay Science, vol. 114, pp. 558–567, 2015.
[24] Y. H. Chen and D. L. Lu, “CO2capture by kaolinite and its
adsorption mechanism,” Applied Clay Science, vol. 104, pp. 221–228, 2015.
[25] F. El Berrichi and S. Zen, “Removal of anionic dyes from aqueous solutions using local activated kaolins as adsorbers,” in Proceedings of 2014 International Conference on Power Systems, Energy, Environment, pp. 191–196, Interlaken, Swit-zerland, February 2014.
[26] J. Fafard, O. Lyubimova, S. R. Stoyanov et al., “Adsorption of indole on kaolinite in nonaqueous media: organoclay prep-aration and characterization, and 3D-RISM-KH molecular theory of solvation investigation,” Journal of Physical Chemistry C, vol. 117, no. 36, pp. 18556–18566, 2013. [27] T. A. Khan, S. Dahiya, and I. Ali, “Use of kaolinite as
ad-sorbent: equilibrium, dynamics and thermodynamic studies on the adsorption of Rhodamine B from aqueous solution,” Applied Clay Science, vol. 69, pp. 58–66, 2012.
[28] W. Rahmalia, J. F. Fabre, T. Usman, and Z. Mouloungui, “Aprotic solvents effect on the UV-visible absorption spectra of bixin,” Spectrochimica Acta Part A: Molecular and Bio-molecular Spectroscopy, vol. 131, pp. 455–460, 2014. [29] P. Tundo and M. Selva, “The chemistry of dimethyl
car-bonate,” Accounts of Chemical Research, vol. 35, no. 9, pp. 706–716, 2002.
[30] B. A. V. Santos, V. M. T. M. Silva, J. M. Loureiro, and A. E. Rodrigues, “Adsorption of H2O and dimethyl carbonate
at high pressure over zeolite 3A in fixed bed column,” In-dustrial & Engineering Chemistry Research, vol. 53, no. 6, pp. 2473–2483, 2014.
[31] W. Rahmalia, J. F. Fabre, and Z. Mouloungui, “Effect of cyclohexane/acetone ratio on bixin extraction yield by accelerated solvent extraction method,” Procedia Chemistry, vol. 14, pp. 455–464, 2015.
[32] S. Kumar, A. K. Panda, and R. K. Singh, “Preparation and characterization of acid and alkaline treated kaolin clay,” Bulletin of Chemical Reaction Engineering & Catalysis, vol. 8, no. 1, pp. 61–69, 2013.
[33] S. Sunardi, Y. Arryanto, and S. Sutarno, “Adsorption of giberellic acid onto natural kaolin from Tatakan, South Kalimantan,” Indonesian Journal of Chemistry, vol. 9, no. 3, pp. 373–379, 2010.
[34] R. Delhez, Th. H. Keijser, and E. J. Mittemeijer, “De-termination of crystallite size and lattice distortions through X-ray diffraction line profile analysis,” Fresenius’ Zeitschrift fuer Analytische Chemie, vol. 312, no. 1, pp. 1–16, 1982. [35] P. A. Schroeder, “Infrared spectroscopy in clay science:
in CMS workshop lectures,” in Teaching Clay Science, A. Rule and S. Guggenheim, Eds., pp. 181–206, The Clay Mineral Society, Aurora, CO, USA, 2002.
[36] M. A. Qtaitat and I. N. Al-Trawneh, “Characterization of kaolinite of the Baten El-Ghoul region/south Jordan by in-frared spectroscopy,” Spectrochimica Acta Part A: Molecular and Biomolecular Spectroscopy, vol. 61, no. 7, pp. 1519–1523, 2005.
[37] R. A. Schoonheydt and C. T. Johnston, “Surface and interface chemistry of clay minerals,” in Developments in Clay Science, Chapter 3, pp. 87–113, Elsevier, Amsterdam, Netherlands, 2006.
[38] S. Yariv and H. Cross, Organo-Clay Complexes and In-teractions, CRC Press, Boca Raton, FL, USA, 2001.
[39] N. Sarier and Ç. G¨uler, “β-carotene adsorption on acid-activated montmorillonite,” Journal of the American Oil Chemists Society, vol. 65, no. 5, pp. 776–779, 1988.
[40] L. F. M. Ismail, H. B. Sallam, S. A. Abo Farha, A. M. Gamal, and G. E. A. Mahmoud, “Adsorption behaviour of direct yellow 50 onto cotton fiber: equilibrium, kinetic and ther-modynamic profile,” Spectrochimica Acta Part A: Molecular and Biomolecular Spectroscopy, vol. 131, pp. 657–666, 2014. [41] H. Freundlich, “Adsorption in solution,” Zeitschrift f¨ur
Physikalische Chemie, vol. 57, pp. 384–470, 1906.
[42] I. Langmuir, “The constitution and fundamental properties of solids and liquids. Part I. Solids,” Journal of the American Chemical Society, vol. 38, no. 11, pp. 2221–2295, 1916. [43] S. M. Rao, “Mechanism controlling the volume change
be-havior of kaolinite,” Clays and Clay Minerals, vol. 33, no. 4, pp. 323–328, 1985.
[44] R. Boussessi, S. Guizani, M. L. S. Senent, and N. Ja¨ıdane, “Theoretical characterization of dimethyl carbonate at low temperatures,” Journal of Physical Chemistry A, vol. 119, no. 17, pp. 4057–4064, 2015.
[45] T. Afroz, D. M. Seo, S. D. Han, P. D. Boyle, and W. A. Henderson, “Structural interactions within lithium salt solvates: acyclic carbonates and esters,” Journal of Physical Chemistry C, vol. 119, no. 13, pp. 7022–7027, 2015.
[46] B. P. Kar, N. Ramanathan, K. Sundararajan, and K. S. Viswanathan, “Conformations of dimethyl carbonate and its complexes with water: a matrix isolation infrared and ab initio study,” Journal of Molecular Structure, vol. 1024, pp. 84–93, 2012.
[47] S. Lagergren, “About the theory of so-called adsorption of soluble substances,” Kungliga Svenska Vetenskapsakademiens, Handlingar, Band, vol. 24, pp. 1–39, 1898.
[48] Y. Ho and G. McKay, “Pseudo-second order model for sorption processes,” Process Biochemistry, vol. 34, no. 5, pp. 451–465, 1999.
[49] T. L´or´and, P. Moln´ar, J. Deli, and G. T´oth, “FT-IR study of some seco- and apocarotenoids,” Journal of Biochemical and Biophysical Methods, vol. 53, no. 1–3, pp. 251–258, 2002.