Open Archive TOULOUSE Archive Ouverte (OATAO)
OATAO is an open access repository that collects the work of Toulouse researchers and
makes it freely available over the web where possible.
This is an author-deposited version published in :
http://oatao.univ-toulouse.fr/
Eprints ID : 16797
To link to this article : DOI : 10.1016/j.nanoen.2014.12.017
URL :
http://dx.doi.org/10.1016/j.nanoen.2014.12.017
To cite this version :
Gao, Peng-Cheng and Tsai, Wan-Yu and
Daffos, Barbara and Taberna, Pierre-Louis and Pérez, Carlos R. and
Gogotsi, Yury and Simon, Patrice and Favier, Frédéric
Graphene-like carbide derived carbon for high-power supercapacitors. (2015)
Nano Energy, vol. 12. pp. 197-206. ISSN 2211-2855
Any correspondence concerning this service should be sent to the repository
administrator:
[email protected]
Graphene-like carbide derived carbon
for high-power supercapacitors
Peng-Cheng Gao
a,c,1, Wan-Yu Tsai
b,c, Barbara Daffos
b,c,
Pierre-Louis Taberna
b,c, Carlos R. Pérez
d, Yury Gogotsi
d,
Patrice Simon
b,c,n, Frédéric Favier
a,c,naInstitut Charles Gerhardt, UMR 5253 CNRS Université Montpellier 2 34095 Montpellier cedex 05, France bCIRIMAT, UMR 5085 CNRS Université Paul Sabatier 118 route de Narbonne, 31062 Toulouse, France c
Réseau sur le Stockage Electrochimique de l’Energie (RS2E), FR CNRS 3459, France
dDepartment of Materials Science and Engineering & A.J. Drexel Nanotechnology Institute Drexel University 3141 Chestnut St., Philadelphia, PA 19104, United States
Abstract
Two graphene-like carbide derived carbons (CDC-Gs) were produced by chlorination of SiC nanosheets obtained by magnesio-thermal reduction at moderate temperature of silica/graphene oxide nanocomposites. These CDC-Gs were evaluated as supercapacitor electrode materials in an organic electrolyte. Starting from a low SiO2/GO ratio in the precursor, the resulting CDC-G
nanosheets are composed of a few layers of graphite, partially coated with microporous CDC. In contrast, a high SiO2/GO ratio leads to micropores generated on the basal plane of individual
carbon nanosheets. The latter CDC-G shows a remarkable high power capability with 76 % of retention of the initial capacity at scan rates up to 3 V s! 1. Notably, the equivalent series
resistance (ESR) and time constant of the cell were found to be extremely low at 0.45 Ω " cm2and
0.4 s, respectively, thanks to the unique 2D open surface and enhanced access to micropores. These features were attributed to the unique nanostructure of the microporous graphene.
Introduction
Carbon-based materials with high specific surface area (SSA) have been widely studied as supercapacitor electrode materials. This choice is led by their balanced electrochemical performances (including specific capacitance and long-term cyclability), good (electro) chemical stability, reasonable electronic conductivity,
http://dx.doi.org/10.1016/j.nanoen.2014.12.017
n
Corresponding authors.
E-mail addresses:[email protected](P. Simon),
[email protected](F. Favier).
1Current address: School of Chemistry and Chemical Engineering,
Huazhong University of Science and Technology Wuhan 430074 (P.R. China).
ease of production and processability, low cost, and so on. While activated carbon is the material of choice for commercial supercapacitors, carbide-derived carbons (CDCs), [1,2] onion-like carbons (OLCs), [3,4] carbon nanotubes (CNTs), [5,6] and grapheme[7,8]are currently considered for designing the next generation of pure carbon-based supercapacitors. Among these materials, CDCs are highly attractive as their microporous structure leads to high capacitance, high power and high energy performances. [2,9,10] The reported CDCs, however, mainly derive from commercial and/or bulk powders of metal carbides. Chlorination of these carbides results in carbons showing a microporous structure with a very narrow pore size distribution which can be tuned in the subnanometer range by the chlorina-tion temperature. CDC-based electrodes however suffer from limited power capabilities at high current densities, especially when operated at low temperature or in viscous electrolytes. On the other hand, the chlorination procedure has a limited impact on the carbide powder morphology and the resulting microporous carbons retain most of the original shape and morphology of their carbide precursors (through a conformal or topotactic transfor-mation)[1].
Graphene is another attractive carbon-based material thanks to its open 2D structure and amazing electronic conductivity
[11,12]. Moreover, because of its high accessible surface area and good electrochemical stability, graphene and more speci-fically Reduced Graphene Oxide (RGO), is widely used as active material or conductive substrate/additive in energy storage devices[7,8,12]. In supercapacitors, graphene-based materials have shown remarkable specific capacitances as high as #200 F " g! 1in aqueous electrolytes[13,14], #120 F " g! 1in organic electrolytes[15,16]and #75 F " g! 1in ionic liquids[16]. More-over, their low equivalent series resistances (ESR) and good electrochemical stabilities make graphene and RGO efficient substrates for pseudocapacitive [17–19] and battery [20,21]
materials, by significantly improving both energy and power capabilities of the resulting composite electrodes. Recently, Ruoff et al. “drilled” micropores in the basal planes of graphene nanosheets by potassium hydroxide chemical activation[22]. The specific surface area (SSA) of the resulting activated graphene reached up to 3100 m2
" g! 1. The specific capacitance of the resulting activated graphene was also enhanced to 160 F " g! 1 in an organic electrolyte demonstrating the effi-ciency of this approach with respect to specific capacitance as well as energy density[22]. However, through the activation process, alkaline species and oxygen functional groups are regenerated at the graphene surface with a detrimental effect on the material electronic conductivity. The ESR of symmetric cells assembled with activated graphene-based electrodes was high (2.5 Ω " cm2) thus limiting the power performance.
In previous works,[23,24]we introduced an efficient route to synthesize mesoporous silicon carbides (SiCs) through a mag-nesio-thermal treatment of mesoporous silica/carbon compo-sites at #800 1C. In contrast with the actual carboreduction proceeding at temperatures above 1400 1C, such synthetic route does not consume any carbon from the pristine composite, preventing any material structure collapsing or sintering[25]. As a consequence, as-prepared carbides perfectly inherit the mesoporosity from their silica/carbon precursors. The corre-sponding CDC was further synthesized by chlorination of the prepared ordered mesoporous silicon carbide and electroche-mically tested in a 1.5 M tetraethylammonium tetrafluoroborate (NEt4BF4) in acetonitrile (AN) electrolyte [26]. Its hierarchical
micro/mesoporous structure promoted very promising super-capacitive capabilities, especially power and energy densities, such as an outstanding rate capability (90% of capacity retention at 1 V s! 1and a time constant of 1 s) and a high specific areal capacitance (0.5 F cm! 2of electrode).
Recently, Yang et al. reported on a bottom-up approach to synthesize a 2D graphene-based material consisting in alternating layers made of mesoporous silica thin film and grapheme [27]. Cetyltrimethylammonium bromide (CTAB), used as cationic surfactant, electrostatically adsorbs and self-assembles onto the surface of highly negatively charged graphene oxide (GO) in alkaline solution. Simultaneously, amphiphilic CTAB micelles strongly interact with tetra-ethoxysilane (TEOS) molecules, and provide the template for nucleation and growth of mesoporous silica at the surface of graphene oxide sheets. Furthermore, the porous silica film efficiently prevents the irreversible restacking of graphene. This sandwich-like silica and carbon nanocompo-site is potentially an ideal precursor for the synthesis of nanosheet-like SiC by magnesio-thermal reduction. In the present work, the synthetic details and structural/morpho-logical characteristics are given for 2D SiC prepared by magnesio-thermal reduction of silica/carbon nanosheets. CDCs obtained by chlorination of the prepared silicon carbide nanosheets are evaluated as supercapacitor elec-trode materials in 1.5 M NEt4BF4/AN organic electrolyte.
Materials and methods
Material synthesis
2D silica/carbon composites were prepared by electrostatic interactions between negatively charged GO and cationic CTAB, and further self-assembling in presence of TEOS[27]. GO was synthesized from graphite powder following a modified Hummers’ method as described in a recent work
[28]. In a typical synthesis of silica/carbon composite, 30 mg GO was exfoliated and dispersed in an aqueous solution containing 1 g CTAB (99%, Aldrich) and 40 mg NaOH (98%, Aldrich) under ultrasonic treatment for 3 h. The suspension was homogenized by vigorous stirring for 2 h at 40 1C. Then, 2 ml TEOS (98%, ACROS Organics) was added in, and the suspension aged by stirring for 12 h. The resulting solid was recovered by filtration, washed with warm ethanol (EtOH, denatured with 5% MEK, ACRO Organics), and dried. The dry powder was carbonized under argon flow at 800 1C for 3 h. The final composite was named CS-G-1. A second sample was prepared following the same synthetic route but using half the quantities of TEOS and CTAB, and named as CS-G-2.
The CS-G-1 and CS-G-2 samples successively underwent magnesio-thermal reduction and chlorination following the as previously described preparation routes [23,24,26]. The products from the magnesio-thermal treatment were named SiC-G-1 and SiC-G-2 and the corresponding chlorination products were named CDC-G-1 and CDC-G-2, respectively.
Material characterization
Transmission Electronic Microscopy (TEM) images were obtai-ned using a JEOL 1200 EX2 TEM operated at 100 kV, and high resolution TEM (HR-TEM) images were taken using a JEOL JEM
2200 FS microscope operated at 200 kV. X-ray diffraction (XRD) measurements were performed on a Philips X’Pert diffract-ometer using CuKα1 radiation (λ=1.5405 Å). Raman spectra of the raw powders were recorded by using a LabRAM ARAMIS IR2 spectrometer with a He/Ne laser (λ=633 nm). The samples were ground with a mortar and suspended in ethanol by ultrasonic treatment for 10 min (25 kHz D-78224 Singen). For TEM sampling, a droplet of the suspension was dropped onto a 200-mesh copper grid and left to dry in air. For HR-TEM sample, a 300-mesh carbon-coated copper grid was used instead. Porosity characteristics were calculated from nitrogen (SiC-Gs) and argon (CDC-Gs) sorption isotherms measured at 77 K and 87 K, respectively, with a Micromeritics ASAP 2020 porosimeter. The specific surface area was estimated by using BET for each gases while the pore volumes and the pore size distributions were calculated from adsorption isotherms by using the QSDFT method[29].
Electrochemical characterization
A slurry was obtained by mixing 95 wt% of CDC-G powder with 5 wt% of polytetrafluoroethylene (PTFE; 60 wt% dispersion in water) using ethanol as the medium. Electrode films of CDC-G-1 (thickness of ca. CDC-G-150 μm) and CDC-G-2 (thickness of 300 μm) were fabricated with a mass loading of 2.6 mg " cm! 2 and 6.2 mg " cm! 2, respectively. The apparent electrode density of CDC-G-1 and CDC-G-2 were calculated at 0.17 g " cm! 3 and 0.20 g " cm! 3. The electrochemical characterization of the prepared CDC electrodes was conducted in 1.5 M NEt4BF4, (Acros Organics, CAS #429-06-1) in AN (Acros organics, CAS #75-05-8, H2O below 10 ppm) in a two-electrode Swagelok cell
[30,31]assembled in a glove box under argon atmosphere, at room temperature. The electrode films were laminated onto pre-treated aluminum current collectors,[32]and two layers of 25 μm-thick porous cellulose were used as separator.
Electrochemical tests were performed using a multichan-nel VMP3 potentiostat/galvanostat (Bio-Logic, France). CVs were recorded in a potential window from 0 to 2.3 V at various scan rates. EIS measurements were performed at the rest potential, using a sinusoidal signal of 75 mV from 50 kHz to 10 mHz.
Results and discussion
The crystallographic characteristics of prepared SiC pow-ders, SiC-G-1 and SiC-G-2, were evaluated by XRD diffrac-tion as shown inFig. 1.
In the pattern depicted inFig. 1(a), the XRD diffractions of SiC-G-1 can be assigned to two sets of diffraction planes. A first set of five peaks located at 35.51, 41.41, 60.01, 65.51, 71.71 and 75.11 (2θ), correspond to the [002], [220], [110], [103], [112] and [004] characteristic diffractions of the 3C-SiC F43m cubic structure, (PDF ref. pattern: Silicon carbide, #01-075-0254). Another set of diffractions centered at 26.31, 41.31, 75.21 and 89.71 (2θ) is assigned to the [111], [100], [110] and [200] silicon Bragg diffractions (PDF ref. pattern: Silicon, #00-026-1481). Silicon impurities are due to an excess of TEOS as precursor and, as a matter of fact, the silica in the SiO2/GO composite (CS-G-1, see experimental section for synthetic details) is approximately in a twofold molar excess versus GO. At the reaction temperature
(800 1C), parts of silica and GO in CS-G-1 are reduced by Mg as SiOxvapors and solid RGO, respectively. These reduced species react according to Reaction (1) to give SiC. Mean-while, the silica excess is directly converted to silicon (Reaction (2)).
SiO2/GO+2Mg-SiC+2MgO (1)
SiO2(excess)+2Mg-Si+2MgO (2)
SiC +2Cl2-SiCl4+C (3)
For the SiC-G-2 sample (Fig. 1(b)), one group of XRD diff-ractions centered at 33.61, 35.51, 38.11, 41.41, 60.01, 65.51, 71.71 and 75.11 (2θ) is assigned to the characteristic diffractions of the P63mc hexagonal structure of 6 H-SiC for [100], [002], [101], [200], [110], [103], [112] and [004] planes, respectively (PDF ref. pattern: silicon carbide, #01-031-1232). An extra diffraction, observed at 28.31 (2θ), is assigned to the (002) peak of graphite, mainly coming from the excess of GO in CS-G-2. Graphite is formed by reduction of GO and restacking of the resulting graphene during the magnesio-thermal reduction. The distinct crystal structures of the SiCs in the SiC-G-1 and SiC-G-2 samples can be assigned to the various SiC polytypes. In our previous report, SiC polytypes were revealed to alter from 3C-SiC to 6 H-SiC along with the carbon/silica molar ratio in the composite precursor [24]. When the C/SiO2 ratio is less than 1, SiC preferentially crystallizes in the 3C-SiC structure together with silicon impurities. 6 H-SiC crystal structure appears when the C/SiO2ratio is close or equal to 1.
After chlorination (Reaction (3)), only the characteristic peaks of carbon are shown in both XRD patterns of CDC-G-1 and CDC-G-2 (Fig. 1(a) and (b)). For CDC-G-1, the broad peak in the 201 to 301 (2θ) range is assigned to amorphous carbon, and the small peaks located at 42.81, 43.91 and 61.81 (2θ) are characteristic of graphite (PDF ref. pattern: carbon, #01-079-1469). Considering the integral area of the observed XRD features, the CDC-G-1 sample is mostly composed of amor-phous carbon together with a few graphite impurities. The XRD peaks of CDC-G-2 located at 26.21, 44.41, 54.01 and 83.21 (2θ) are [002], [101], [004] and [112] graphite peaks, respectively (PDF ref. pattern: carbon, #01-075-1621). Unlike CDC-G-1, the whole CDC-G-2 sample presents some level of graphitization. Raman spectra of the prepared SiC-G-1 and SiC-G-2 samples are shown inFig. 1(c) and (d), and inFigure S1(a) in the wave number ranges from 1250 to 2000 cm! 1and from 700 to 1000 cm! 1, respectively. For SiC materials, two active modes are expected in the 700–1000 cm! 1range[33]; they correspond to transverse (TO) and longitudinal (LO) modes, in the 750–850 cm! 1 and 950–1000 cm! 1 ranges, respectively. While the LO mode peak remains unchanged in shape and wave number, the TO mode range depends on the SiC allotrope considered[33]. From 3C-SiC to 6H-SiC, the TO peak is shifted toward lower wave numbers and split in two different peaks. Despite the unfavorable signal to noise ratio, Raman spectra presented in Figure S1(a) show the expected discrepancies and confirm SiC-G-1 and SiC-G-2 as 3C-SiC and 6H-SiC, respectively. For graphene-based materi-als, the ID/IGintensity ratio of the D and G bands observed in the 1200–1700 cm! 1range reflects the defect degree of the graphene sheet either from C-C dangling bonds or chemi- or physisorbed surface groups. In the present case, SiC or Si
moieties were actually probed by Raman spectroscopy as defects at the graphene surface. For both SiC-G materials, the ID/IGratios were calculated from the peak integrals of D and G bands. The ID/IGratio of SiC-G-1 calculated at 2.15 is higher than that of SiC-G-2 at 1.02. This higher defect degree for SiC-G-1 is consistent with the lower graphite content in this material as demonstrated by XRD analysis. In contrast, because of a lower SiC content and higher graphite content, Raman spectroscopy evidences SiC-G-2 is less defective. As shown in
Figure S1(b), in the high energy range (from 2500 to 2750 cm! 1), the 2D band of SiC-G-1 is broad and located at 2618 cm! 1while the corresponding band is expected at about 2670 cm! 1for graphite. This lower wave number is indicative of SiC-G-1 to be composed of monolayers or a few layers of (re) stacked graphene kept apart thanks to the decoration by SiC or Si films (or deposits). The 2D band of SiC-G-2 is measured at 2661 cm! 1. This value, close to that for pure graphite, suggests SiC-G-2 to be built, in a large extent, on restacked layers. The low silica content in the CS-G-2 composite leads to surfaces of graphene only partially covered with SiC resulting from magnesio-thermal reduction. At the temperature of chlorina-tion (800 1C), these open surface graphitic layers tend to restack: compared to their SiC precursors, the ID/IG ratio of CDC-G-1 and CDC-G-2 decline, from 2.15 (SiC-G-1) to 1.85 (CDC-G-1) and from 1.02 (SiC-G-2) to 0.91 (CDC-G-2), respec-tively. The chlorination extensively consumes silicon as well as oxygen-containing functional groups leading to an overall decrease of the defect degree. Additionally, the G band of CDC-G-1 obviously shifts to higher energy compared to its precursor, SiC-G-1. This shift is an indication of the thickness
decrease of the carbonaceous layer after conversion of the superficial SiC coating to the CDC film, and of the concurrent silicon dedoping. Meanwhile, the G band of CDC-G-2 keeps almost the same position as for its precursor, SiC-G-2. Con-sidering the restacked structure of SiC-G-2, the impact of a skin layer change on the overall thickness of carbonaceous stacked layers is not probed by Raman spectroscopy.
TEM images of CDC-G-1 and CDC-G-2 in Fig. 2 exhibit distinct morphologies through the SiO2/GO ratio in their precursor. Fig. 2(a), as TEM image of CDC-G-1, shows the surface of a carbon nanosheet resulting from the chlorination of SiC-G-1. The whole surface is homogeneously covered by pores building a vermicular network. This porous structure is consistent with the mechanism of micropore formation in CDCs upon chlorination [34,35]. Through a systematic exploration of the material surface at higher magnification, the vermicular structure of the CDC-G-1 porosity was con-firmed (Fig. 2(c)), without any sign of graphene restacking or mesopore ordering. This absence agrees with the Raman results showing that CDC-G-1 is built from a single or a few graphene layers. The average pore size sampled by 20 spots is 0.9 nm (70.05 nm). The TEM image of CDC-G-2 in Fig. 2
(b) shows a less homogeneous surface as compared to CDC-G-1, exhibiting both porous and smooth areas. Although the structure of the porous parts is highly vermicular, the smooth skin of graphene underneath is also easily recognizable. As shown inFig. 2(d), the borders of stacked layers are clearly visible in both the porous areas and the smooth surface. In agreement with Raman and XRD results, these images support the graphitic character of CDC-G-2. In the basal plane of CDC Fig. 1 XRD patterns of SiC-G-1 (in black), CDC-G-1 (in red) (a) and SiC-G-2 (in black), CDC-G-2 (in red) (b). Raman spectra of SiC-G-1
nanosheets (as shown in spot 1 ofFig. 2(d)), the average size of the crystal lattices sampled over 20 spots is about 0.3 nm (70.05 nm) which fits well with the size of the graphitic crystal lattice (0.335 nm). Furthermore, in the lateral plane of CDC nanosheets (as shown in spot 2 of Fig. 2(d)), the measured interlayer spacing is about 0.42 nm, in agreement with those previously reported for a limited number of stacked graphene layers[36]. Additionally, the average pore size of CDC-G-2 sampled over 20 spots is about 0.8 nm (70.05 nm) which is approximately equal to the pore size measured for CDC-G-1 and consistent with similar chlorination conditions used for both pristine carbides.
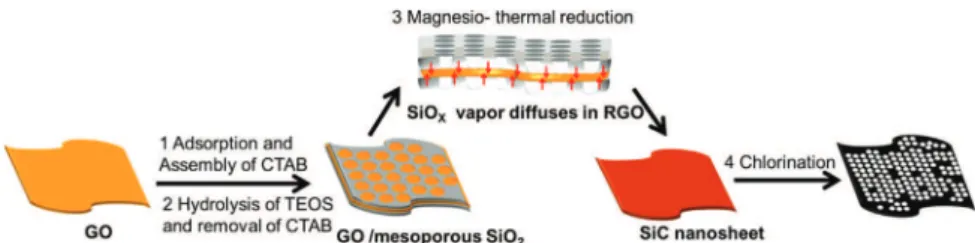
The above analyses of XRD, Raman and TEM data allow an overall synthetic mechanism to be established as depicted in
Fig. 3. The adsorption onto GO and self-assembling of CTAB/ TEOS moieties lead, by hydrolysis of TEOS, to 2D sandwiched SiO2/GO nanosheets. During the magnesio-thermal reaction, generated SiOx vapors diffuse either perpendicularly and laterally into RGO layers [24]. The resulting SiCs inherit the nanosheet structure from their silica/GO composite precursors. Through the silicon oxidation/extraction by chlorination, mas-sive micropores are opened in SiC to give CDC nanosheets.
Textural structures of SiC-G and CDC-G materials were characterized by N2 and Ar adsorption/desorption measure-ments, respectively. InFigure S2(a), N2sorption isotherms of
SiC-G-1 and SiC-G-2 exhibit a type-III behavior with a H3-type hysteresis, characteristic of macroporous materials with a small amount of slit-shaped mesopores. The pore size distribu-tions (PSDs) of SiC-G-1 and SiC-G-2 were calculated from their adsorption branch as shown inFigure S2(b). Both the PSDs of SiC-G-1 and SiC-G-2 are broadly ranging from 7 to 100 nm. These pores are assigned to a random porous structure built on exfoliated nanosheets. In the low PSD region, for both SiC-G-1 and SiC-G-2, a weak adsorption peak appears at about 2.5 nm corresponding approximately to the pore size of mesoporous silica prepared by using CTAB as molecular template[27]. The presence of mesopores of this size originates from the localized conversion, through the magnesio-thermal reduction, of car-bon located underneath the CTAB-templated mesoporous silica. However, most of the porous volume comes from the macropores formed by the random aggregation of the SiC graphene-like particles. As such, the SSAs of 1 and SiC-G-2 calculated from BET method are limited to 68 m2
" g! 1and 56 m2
" g! 1, respectively.
The Ar adsorption/desorption isotherms and PSDs calcu-lated by the quenched solid density functional theory (QSDFT) method[29]of CDC-G-1 and CDC-G-2 are shown inFig. 4. For both CDCs, isothermal curves exhibit type II curves with H3 or H4 hysteresis loops characteristic of a combination of a large number of micropores together with a small number of Fig. 2 TEM images of CDC-G-1 (a) and CDC-G-2 (b). The partial enlarged images of CDC-G-1 (c) and CDC-G-2 (d).
mesopores. In the low relative pressure range (p/p0=0.0–0.1), the strong adsorption comes from micropores opened in the graphene-like CDCs through chlorination treatments. Due to the generated micropores, the SSAs of CDC-G-1 and CDC-G-2 calculated by the BET method at 913 m2
" g! 1 and 872 m2
" g! 1, respectively, were significantly enhanced com-pared to those of SiC-G-1 and SiC-G-2. In the PSD of both CDC-G-1 and CDC-G-2, a strong adsorption is centered at about 1 nm. This approximately corresponds to the pore size mea-sured by TEM imaging for both samples. Moreover, there are two other adsorptions centered at 2.5 and about 0.5 nm, respectively. The mesoporosity at 2.5 nm corresponds to the weak adsorption measured for SiC-Gs as previously mentioned. Usually, the applicable pore diameter range of argon-sorption using QSDFT method is 0.35-8 nm[29]. Although there are no reports on the interlayer distance of graphene or
graphene-based materials measured by argon-sorption using QSDFT method, in the present case, the PSD of CDC-G-1 centered at 0.53 nm is speculated as the distance between nanosheets. This extended interlayer distance in CDC-G-1 is in good agreement with the Raman conclusions demonstrating the low restacking degree of the nanosheets despite both magnesio-thermal reduction and chlorination. The PSD of CDC-G-2 locates at a smaller diameter of about 0.45 nm, also matching with the observed results from the TEM image (at 0.42 nm). These sorption results support the higher graphitic degree of CDC-G-2 compared to that of CDC-G-1.
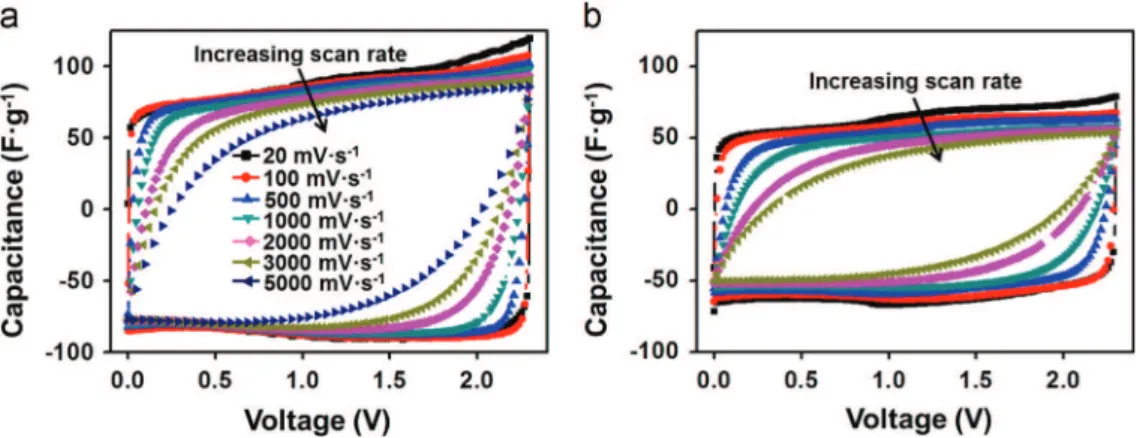
The electrochemical behaviors of CDC-G-1 and CDC-G-2 were studied by cyclic voltammetry (CV) measurements and electrochemical impedance spectroscopy (EIS) in 1.5 M NEt4BF4/AN electrolyte. CV tests were performed between 0 and 2.3 V at various scan rates from 20 mV " s! 1to 5 V " s! 1.
Fig. 3 Synthetic mechanism from 2D sandwiched SiO2/C nanocomposites to SiC nanosheets and finally graphene-like CDCs: The
self-assembling and hydrolysis (1 and 2) of CTAB/ TEOS moieties at GO surface leading to 2D sandwiched SiO2/GO nanosheets, the
topotactic conversion as SiC nanosheets by magnesio-thermal reduction (3) thanks to SiOxvapors diffusion into RGO layers, and the
silicon oxidation/ extraction by chlorination (4) opening micropores in corresponding graphene-like CDCs.
Fig. 4 Argon sorption isotherm curves (a) and corresponding pore size distributions (b) of CDC-G-1, and argon sorption isotherm curves (c) and corresponding pore size distribution (d) of CDC-G-2. The dashed area under the curves corresponds to the pore volume of CDC-G-1 and CDC-G-2 ranging from 0.7 to 2 nm, respectively.
CV curves of both the CDC-G-1 and CDC-G-2 electrodes, as depicted inFig. 5 (specific capacitance versus cell voltage) andFigure S3(current versus cell voltage), show rectangular shapes characteristic of electrochemical double layer capa-citor (EDLC) behaviors. The specific capacitance of the CDC-G-1 electrode calculated by using the integral area of the CV curve at 20 mV " s! 1is 80 F " g! 1. That of CDC-G-2 is lower, at 65 F " g! 1 for the same scan rate. For porous carbonaceous materials, most of the capacitance (more than 80%) comes from the volume developed by pores ranging from 0.7 to 2 nm. The pore volumes of CDC-G-1 and CDC-G-2 in this pore size range (the dashed area under the curves inFig. 4(b) and (d)) occupy 55% and 38% of total pore volumes (calculated from 0.45 to 10 nm), respectively. The specific capacitances presently measured for CDC-G-1 and CDC-G-2 agree these porous volume discrepancies. These values are however slightly lower than those reported for CDCs in the literature
[2,9,37,38], but considering carbon loadings of 2.6 mg " cm! 2 and 6.1 mg " cm! 2, the areal capacitances of the electrodes using either CDC-G-1 or CDC-G-2 as active materials are quite
attractive at 0.21 F " cm! 2 and 0.4 F " cm! 2, respectively. To emphasize this point, a CDC-G-1 cell with a higher mass loading of 5.5 mg " cm! 2was tested in the same experimental conditions. The areal capacitance of this high-loading CDC-G-1 cell reaches up to 0.39 F " cm! 2(as shown inFigure S4). This areal capacitance, nearly double that of the low-loading cell, is quite promising from the practical application point of view. However, due to the low bulk density of graphene-derived materials, the volumetric capacitance of the CDC-G electrodes are not that impressive, measured at 14 F " cm! 3 and 10 F " cm! 3, respectively. By increasing the scan rate, the capacitive electrochemical signature of the CDC-G-1 elec-trode is preserved even at a very high rate of 3 V " s! 1. At such scan rate, despite a marked ohmic behavior, the specific capacitance of the CDC-G-1 electrode is still 59 F " g! 1, a 76% retention of the capacitance at low scan rate (20 mV " s! 1).
Fig. 6 shows a comparison of the power capabilities of sel-ected carbonaceous materials, either CDC-based or graphene-like materials, from the change in relative capacitance (C/C0) upon scan rate for electrodes with similar mass loading. The progressive decay observed for both CDC-G-1 and CDC-G-2 relative capacitances is almost the same, demonstrating similar power performances. Except for the ordered meso-porous CDC which take an obvious advantage of its hierarch-ical porosity, C/C0decays of CDC-Gs are less than that of their homologous materials at the same scan rates[14,22,26]. The EDLC behavior of both electrodes is well kept at scan rates up to 500 mV " s! 1 as they behave as efficiently as previously reported activated graphene (Fig. 6)[22].
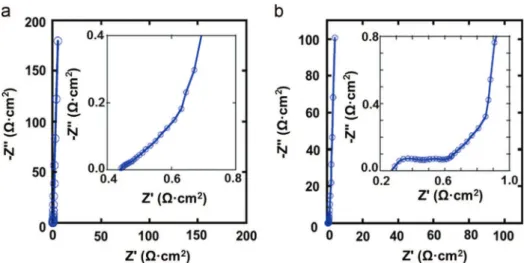
The Nyquist plots of the CDC-G-1 and CDC-G-2 electrodes depicted inFig. 7show distinct capacitive behaviors of porous block electrodes. From the high frequency range data analysis, the ESR of CDC-G-1 is measured at 0.45 Ω " cm2, close to those previously reported for CDC electrodes tested in similar condi-tions[2,14]. It is also smaller than those found in the literature for graphene, activated graphene and other CDCs[2,9]. The low ESR as well as the decent specific capacitance of the CDC-G-1 electrode can be assigned to the remarkable nanostructure of CDC-G-1 with micropores about 1 nm in diameter, highly accessible to the electrolyte ions thanks to the 2D graphene-like open surface. For CDC-G-2, the high frequency range shows two loops which are related to charge transport phenomena, in the present case, more likely to the electron diffusion at the CDC-G2 grain boundaries. The corresponding ESR was measured at the intercept of the second high frequency loop at 0.55 Ω " cm2. As compared to CDC-G-1, the high frequency part
Fig. 5 CVs at various scan rates for CDC-G-1 (a) and CDC-G-2 (b) electrodes in 1.5 M NEt4BF4/AN.
Fig. 6 Relative capacitance C/C0versus scan rate from cyclic
voltammogram curves (or equivalent conversion from current density of galvanostatic cycling measurements) in 1.5 M NEt4BF4/AN for graphene-like CDCs (this work, loading at
5.5 mg " cm! 2 for CDC-G-1 and 6.1 mg " cm! 2 for CDC-G-2),
ordered mesoporous CDC with microporous/ mesoporous dual distribution from Ref. [26] (7.3 mg " cm! 2 loading), reduced
graphene oxide in 1 M TEABF4/PC from Ref.[14](3.8 mg " cm! 2
loading), and activated graphene in 1 M BMIM BF4/AN from Ref.
[22] (2.5–4.0 mg " cm! 2 loading). C
0was taken as the specific
capacitance measured at lowest scan rate or current density. In this series, materials were tested in two-electrode test cells.
of the Nyquist plot for CDC-G-2 shows a shift of the real part of the impedance witch fit the observed more resistive CV. Nevertheless, EIS results for both CDC-G-1 and CDC-G-2 elec-trodes fit well with their capabilities at high scan rates, and support the potentially high power capability of these graphene-like CDC materials.
A complex capacitance model, based on the modeling of the capacitance in real part C’ (ω) and imaginary part C” (ω) both as function of the frequency, was used to investigate the frequency behavior of the cells[32].Fig. 8(a) and (c) show the
change of the real part of the capacitance C’ (ω) with frequency of the CDC-G-1 and CDC-G-2 cell, respectively. At low frequency, the observed plateaus corresponding to phase angles of approximately !861, are characteristic of the purely capacitive behavior of the two cells [32]. Most of the capacitance of CDC-G-1 and CDC-G-2 cells is maintained up to frequencies of 0.6 Hz and 0.2 Hz, respectively. The !451 phase angle of CDC-G-1 is reached at about 2.4 Hz. In contrast, CDC-G-2 relatively lags behind since the phase angle reaches ! 451 at about 1.1 Hz. The corresponding capacitances are Fig. 7 EIS Nyquist plots for CDC-G-1 (a) and CDC-G-2(b) in 1.5 M NEt4BF4/AN. Mass loadings are 2.6 mg " cm! 2and 6.1 mg " cm! 2,
respectively. Insets show data in the high-frequency range.
Fig. 8 Real capacitance, C’ (a) and imaginary capacitance, C” (b) vs. the logarithm of frequency of CDC-G-1, and real capacitance, C’ (c) and imaginary capacitance, C” (d) vs. the logarithm of frequency of CDC-G-2. Mass loadings are 5.5 and 6.1 mg " cm! 2for CDC-G1 and
0.09 F " cm! 2 and 0.16 F " cm! 2 for CDC-G-1 and CDC-G-2, respectively. These values should theoretically correspond to half of the total capacitances of the cells, in perfect agree-ment with capacitance measured by CV at 0.18 F " cm! 2 and 0.32 F " cm! 2for CDC-G-1 and CDC-G-2, respectively.
Fig. 8(b) and (d) show the imaginary part of the capacitance, C’ (ω) vs. frequency. The peak of energy dispersion is shifted towards a lower frequency from CDC-G-1 to CDC-G-2. A rela-xation time τ0can be calculated from τ0=1/ƒ0, where ƒ0is the characteristic frequency of the cell obtained at the phase angle of !451. τ0 corresponds to the maximum on the dispersed energy curves and to the frontier between the capacitive and resistive behavior of the supercapacitor electrode. It is the time required to efficiently deliver the stored energy[32,39]. The low τ0 values of CDC-G-1 and CDC-G-2 at 0.6 s and 0.9 s, respectively, demonstrate the high power performances of the graphene-like CDC electrodes. The mass loading (ML) of the active materials strongly affects the τ0value of the prepared electrode. CDC-G-1 electrodes with ML of 2.6 and 9.6 mg " cm! 2 were prepared and tested in 1.5 M NEt4BF4/AN electrolyte. As shown in Figure S5, the calculated τ0increases from 0.4 s to 0.9 s while increasing the ML in CDC-G-1 electrodes from 2.6 mg " cm! 2to 9.6 mg " cm! 2. Besides, assuming that authors preferentially exhibit the best performances of their electrode materials, time constant is also a good marker to benchmark our CDC-Gs towards other devices reported in the literature. Noteworthy, the τ0value of the CDC-G-1 cell is close to or even faster than those reported for high power carbonaceous materials in organic electrolyte, such as multiwalled nanotube (0.7 s for 15 mg " cm! 2 ML), [4] carbon onions (1 s for 15 mg " cm! 2 ML) [4] and mesoporous CDCs (1 s for 7.3 mg " cm! 2 ML) [26]. Compared to commercial activated carbons operated in the same electrolyte, the τ0value of CDC-G-1 is more than 10 times shorter (10 s for a 15 mg " cm! 2ML)
[32]. This excellent power performances of CDC-G-1 are mainly assigned to its unique open structure offering free ion paths for the electrolyte to reach micropores together with high electro-nic conductivity of graphene nanosheets.
Conclusions
Two carbide derived carbons, CDC-G-1 and CDC-G-2, were produced by chlorination of graphene-like SiC nanosheets. Through chlorination, the graphene-like morphologies of the pristine carbides were well kept, and simultaneously, micro-pores were opened up in the resulting materials thanks to the oxidation/extraction of Si. Electrochemical performances of the CDC-G-1 and CDC-G-2 as active materials for supercapaci-tors were tested in 1.5 M NEt4BF4/AN electrolyte. Generated micropores on the basal plane of the CDC nanosheets offer a reasonable gravimetric capacitance at 80 F " g! 1(corresponding to an attractive 0.4 F " cm! 2 areal capacitance) with 76% of which is preserved at a scan rate of 3 V " s! 1. These remarkable power capabilities, originating from the unique 2D open surface of the graphene-like CDCs, are supported by very low measured ESRs and relaxation times as short as 0.4 s.
Acknowledgments
P.-C.G would like to thank the Chinese Scientific Council for fellowship. W.-Y.T. was supported by the European Research
Council (ERC, Advanced Grant, ERC-2011-AdG, Project 291543— IONACES). P.S. acknowledges the funding from the Chair of Excellence of the EADS foundation “Embedded multi-functional materials.” C.P. and Y.G. are thankful to the U.S. Department of Energy, Office of Basic Energy Sciences, Division of Materials Science which supported this research under Award Number DESC0001912. The US-France collaboration was enabled through support from the Partnership University Fund (PUF).
Appendix A.
Supporting information
Supplementary data associated with this article can be found in the online version athttp://dx.doi.org/10.1016/j.nanoen.2014. 12.017.
References
[1]V. Presser, M. Heon, Y. Gogotsi, Adv. Funct. Mater. 21 (2011) 810–833.
[2]J. Chmiola, G. Yushin, Y. Gogotsi, C. Portet, P. Simon, P.L. Taberna, Science 313 (2006) 1760–1763.
[3]Y. Gao, Y.S. Zhou, M. Qian, X.N. He, J. Redepenning, P. Goodman, H.M. Li, L. Jiang, F.Y. Lu, Carbon 51 (2013) 52–58. [4]C. Portet, G. Yushin, Y. Gogotsi, Carbon 45 (2007) 2511–2518. [5]S. Dörfler, I. Felhösi, T. Marek, S. Thieme, H. Althues,
L. Nyikos, S. Kaskel, J. Power Sources 227 (2013) 218–228. [6] E. Iyyamperumal, S. Wang, L. Dai, ACS Nano 6 (2012) 5259–5265. [7]Y. Wang, Z. Shi, Y. Huang, Y. Ma, C. Wang, M. Chen, Y. Chen,
J. Phys. Chem. C 113 (2009) 13103–13107.
[8]B.G. Choi, M. Yang, W.H. Hong, J.W. Choi, Y.S. Huh, ACS Nano 6 (2012) 4020–4028.
[9]C.R. Pérez, S.-H. Yeon, J. Ségalini, V. Presser, P.-L. Taberna, P. Simon, Y. Gogotsi, Adv. Funct. Mater. 23 (2013) 1081–1089. [10] Y. Korenblit, M. Rose, E. Kockrick, L. Borchardt, A. Kvit,
S. Kaskel, G. Yushin, ACS Nano 4 (2010) 1337–1344. [11] A.K. Geim, K.S. Novoselov, Nat Mater. 6 (2007) 183–191. [12] D. Chen, L. Tang, J. Li, Chem. Soc. Rev. 39 (2010)
3157–3180.
[13] W. Lv, D.-M. Tang, Y.-B. He, C.-H. You, Z.-Q. Shi, X.-C. Chen, C.-M. Chen, P.-X. Hou, C. Liu, Q.-H. Yang, ACS Nano 3 (2009) 3730–3736.
[14] Y. Zhu, M. Stoller, W. Cai, A. Velamakanni, R.D. Piner, D. Chen, R.S. Ruoff, ACS Nano 4 (2010) 1227–1233.
[15] S.R.C. Vivekchand, C.S. Rout, K.S. Subrahmanyam, A. Govindaraj, C.N.R. Rao, J. Chem. Sci. 120 (2008) 9–13. [16] L.L. Zhang, R. Zhou, X.S. Zhao, J. Mater. Chem. 20 (2010)
5983–5992.
[17] S. Chen, J. Zhu, X. Wu, Q. Han, X. Wang, ACS Nano 4 (2010) 2822–2830.
[18] H. Wang, H.S. Casalongue, Y. Liang, H. Dai, J. Am. Chem. Soc. 132 (2010) 7472–7477.
[19] P.-C. Gao, P.A. Russo, D.E. Conte, S. Baek, F. Moser, N. Pinna, T. Brousse, F. Favier, ChemEletroChem 1 (2014) 747–754. [20]H. Wang, L. Cui, Y. Yang, H.S. Casalongue, J.T. Robinson, Y. Liang,
Y. Cui, H. Dai, J. Am. Chem. Soc. 132 (2010) 13978–13980. [21]D. Wang, D. Choi, J. Li, Z. Yang, Z. Nie, R. Kou, D. Hu, C. Wang,
L.V. Saraf, J. Zhang, I.A. Aksay, J. Liu, ACS Nano 3 (2009) 907–914.
[22]Y. Zhu, S. Murali, M.D. Stoller, K.J. Ganesh, W. Cai, P.J. Ferreira, A. Pirkle, R.M. Wallace, K.A. Cychosz, M. Thommes, D. Su, E.A. Stach, R.S. Ruoff, Science 332 (2011) 1537–1541.
[23] P.-C. Gao, Y. Lei, A.F.C. Pérez, K. Rajoua, D. Zitoun, F. Favier, J. Mater. Chem. 21 (2011) 15798–15805.
[24] P.-C. Gao, P. Simon, F. Favier, Microporous Mesoporous Mater 180 (2013) 172–177.
[25] J. Parmentier, J. Patarin, J. Dentzer, C. Vix-Guterl, Ceram. Int. 28 (2002) 1–7.
[26] W.-Y. Tsai, P.-C. Gao, B. Daffos, P.-L. Taberna, C.R. Perez, Y. Gogotsi, F. Favier, P. Simon, Electrochem. Commun. 34 (2013) 109–112.
[27] S. Yang, X. Feng, L. Wang, K. Mllen, Angew. Chem. Int. Ed. 49 (2010) 4795–4799.
[28] P.A. Russo, N. Donato, S.G. Leonardi, S. Baek, D.E. Conte, G. Neri, N. Pinna, Angew. Chem. Int. Ed. 51 (2012) 11053–11057. [29] A.V. Neimark, Y. Lin, P.I. Ravikovitch, M. Thommes, Carbon 47
(2009) 1617–1628.
[30] Y. Gogotsi, P. Simon, Science 334 (2011) 917–918.
[31] A. Blyr, C. Sigala, G. Amatucci, D. Guyomard, Y. Chabre, J.-M. Tarascon, J. Electrochem. Soc. 145 (1998) 194–209. [32] P.L. Taberna, P. Simon, J.F. Fauvarque, J. Electrochem. Soc.
150 (2003) A292–A300.
[33] J.A. Freitas, W.J. Moore, Braz. J. Phys. 28 (1998) 12–18. [34] G. Laudisio, R.K. Dash, J.P. Singer, G. Yushin, Y. Gogotsi,
J.E. Fischer, Langmuir 22 (2006) 8945–8950.
[35] Y. Gogotsi, A. Nikitin, H. Ye, W. Zhou, J.E. Fischer, B. Yi, H.C. Foley, M.W. Barsoum, Nat. Mater. 2 (2003) 591–594. [36] T. Ohta, A. Bostwick, J.L. McChesney, T. Seyller, K. Horn,
E. Rotenberg, Phys. Rev. Lett. 98 (2007) 206802.
[37] R. Dash, J. Chmiola, G. Yushin, Y. Gogotsi, G. Laudisio, J. Singer, J. Fischer, S. Kucheyev, Carbon 44 (2006) 2489–2497. [38]M.S. Seo, J.H. Kim, J.M. Kim, J.S. Han, S. Kang, J.S. Ihm, D.O. Kim,
Carbon 60 (2013) 299–306.
[39] J. Miller, Pulse power performances of electrochemical capacitors: technical status of present commercial devices, in: Proceedings of the Eighth Seminar on Double Layer Capacitors and Similar Energy Storage Devices, Deerfield Beach, US, 1998, pp. 21–35.
Peng-cheng Gao received his Ph.D. in Chemistry and Physical Chemistry of Materi-als from the University of Montpellier 2, France. He is currently on a postdoctoral research position at Huazhong University of Science and Technology, China. Research interests include nanoporous materials for supercapacitors and biosensors.
Wan-Yu Tsai received her B.S. in Materials Science and Engineering from National Tsing Hua University in Taiwan in 2008. Being awarded the Erasmus Mundus Scholarship, she joined the MESC (Materials for Energy Storage and Conversion) master program in 2009, and received her M.S in 2011. She is currently a PhD student in Paul Sabatier University (Toulouse, France), under Professor Simon and Professor Taberna’s guidance. Her research is focused on EQCM study of ion adsorption at nanoporous carbon electrode for supercapacitor application.
Barbara Daffosis engineer at CIRIMAT labora-tory (University of Toulouse, France). Her main activity is focused on structural characteriza-tion of microporous carbons (gas adsorpcharacteriza-tion analysis, SEM) and electrochemical character-ization of nanostructured materials (carbon, oxides) for supercapacitor application.
Pierre-Louis Taberna received his Ph.D. in Electrochemistry Science from Pierre et Marie Curie University (Paris, France) and he is currently CNRS researcher at CIRIMAT institute (Université de Toulouse, France). His research activities have been devoted for more than ten years to electrochemical characterizations and modifications of interfaces for electro-chemical energy storage applications.
Carlos R. Pérezobtained his Ph.D. in Mate-rial Science Engineering from the Drexel University in 2013, working under the super-vision of Prof. Gogotsi. Since then, he has been appointed postdoctoral research fel-low in the School of Engineering and Applied Science of the University of Pennsylvania, also in Philadelphia. His research focus includes carbon nanomaterials for energy applications, and the use of scanning probe techniques (AFM, SIMM) for the study of the interfaces between these materials and others (polymers, ceramics, etc).
Yury Gogotsiis Distinguished University Pro-fessor and Trustee Chair of Materials Science and Engineering at Drexel University. He is also the founding Director of the A.J. Drexel Nanomaterials Institute and Associate Editor of ACS Nano. He has a Ph.D. in Physical Chemistry from Kiev Polytechnic, D.Sc. in Materials Engineering from Ukrainian Academy of Sciences and Dr.h.c. degree from Paul Sabatier University, Toulouse, France. He works on nanostructured carbons and two-dimensional carbides for energy related and biomedical applications. He has co-authored 2 books, more than 450 journal papers and obtained more than 50 patents. He has received numerous national and international awards for his research, was recognized as Highly Cited Researcher by Thomson-Reuters in 2013 and elected a Fellow of AAAS, MRS, ECS and ACerS and a member of the World Academy of Ceramics.
Patrice Simon obtained his PhD in 1995 in Material Science at Ecole Nationale Supér-ieure de Chimie de Toulouse. He joined the Conservatoire National des Arts et Métiers in Paris in 1996 as Assistant Professor and moved to Université Paul Sabatier in 2001, where he is currently Professor of Material Science. He holds a Chair of Excellence of the Airbus Group Foundation and was awarded in 2011 with an Advanced Grant from the European Research Council (ERC, Ionaces project, 2012–2017). His research is mainly focused on the synthesis and characterization of nanostructured materials for electrochemical capacitors.
Frédéric Favieris CNRS Director of Research at Institut Charles Gerhardt Montpellier, France. He received his Ph.D. in Chemistry and Physical Chemistry from Montpellier Uni-versity, France. Current research directions include the preparation and design of elec-trode materials for energy storage (superca-pacitors and Li-air battery) and alkaline water electrolysis, and the synthesis and assembling of nano/meso objects for the fabrication of chemical sensors.