Manganese dissolution in lithium-ion positive electrode materials
M. Saulniera, A. Auclaira, G. Liangb, S.B. Schougaarda*
aUniversité du Québec à Montréal, Case postale 8888, Succ. Centre-ville, Montréal, Québec H3C 3P8, Canada
bJohnson Mattey Battery MaterialsLtd., 280 Ave. Liberté, Candiac, QC J5R 6X1, Canada
* Corresponding author E-mail address: [email protected] (S.B. Schougaard). First author E-mail address : [email protected]
Second author E-mail address: [email protected] Third author E-mail address: [email protected]
Abstract
Understanding the key factors that affects overall performances of a battery is crucial to the lithium-ion battery industry. To this end characterisation methods must be specific, reproducible and representative. As such, an interference free and reproducible analytical method with a low detection limit (50 ppb) to evaluate manganese dissolution from lithium-ion battery positive electrodes is presented. Two different electrolytes (1.0 M LiClO4 and 1.0 M LiPF6 in EC:DMC (1:1)), LiFePO4, two nominally similar
LiFe0.3Mn0.7PO4 samples and spinel LiMn2O4 are used for proof of concept. Mn and Fe quantification is
performed on material ageing in solely in electrolyte, as well as, in a battery system with and without forced oxidation. It is demonstrated that water and free acid content in the electrolyte, as well as, imposing an oxidative electrochemical potential has a profound effect on manganese based material dissolution and battery performance.
Keywords
Manganese dissolution; Lithium-ion battery; hydrofluoridric acid; phospho-olivine; lithium manganese
Classification code
A8100X
1. Introduction
To compete in the energy storage and transportation market, lithium-ion batteries needs to be safe, low cost, have high energy density, high efficiency and a long service life. [1-4] In this perspective, there is a growing interest for phospho-olivines and manganese based positive electrode materials. Specifically, lithium manganese spinel LiMn2O4 (LMO) and lithium iron phosphate LiFePO4 (LFP) appears to be good
replacements for commercial lithium cobalt oxide LiCoO2. One of the major drawbacks of LiFePO4 is the
potential of the Fe2+/Fe3+ redox couple (3.45V vs Li/Li+) that affects the overall energy. Substituting iron
for manganese improves the redox potential (4.05V vs Li/Li+) and at an equivalent theoretical capacity
(~170 mAh g-1) which should lead to a higher energy density than LiFePO
4. However, it was clearly
demonstrated that LiMnPO4 (LMP) has a lower experimental energy density due to slow (de)lithiation
kinetics entailing large overpotentials and capacity loss at practical rates compared to LiFePO4.[5-8] The
origin of the slower kinetics is still a matter of discussion, but structural differences related to the relative size of the transition metal ions in different oxidation states and the accompanying unit cell differences, the effect of Jahn-Teller distortions, and poor electronic conduction has been invoked as possible causes.[9-16] Importantly however, it has been reported that the coexistence of Fe and Mn in the phospho-olivine structure LiFe1-xMnxPO4 (LFMP) minimize the capacity loss when x < 0.8. [5, 17-20]
These mixed iron-manganese phosphates are therefore more attractive than pure LiMnPO4 for practical
applications at this point in time.
Manganese dissolution in lithium-ion battery electrolyte is a well-known problem and widely documented for the spinel LiMn2O4 [21-31], however studies of similar processes for LiFe1-xMnxPO4 are scarce.[20,
composite electrode. In addition manganese ions migrate towards the negative electrode and are reduced to manganese metal in the solid electrolyte interface causing electrolyte decomposition and
self-discharge. [28, 30] Therefore, even minute amount of manganese dissolution can affect energy density and the longevity the cell. This problem is of such importance that Mn trapping polymers coated
separators have been developed to reduce the amount of Mn migrating to the negative electrode. [34]
In this paper, we report on the amount of manganese dissolution in lithium-ion battery electrolyte for LiFePO4, two nominally similar LiFe0.3Mn0.7PO4 samples and spinel LiMn2O4. Previous reports suggest
that Mn dissolution occurs when the LiFe1-xMnxPO4 ages in the electrolyte. [20, 32, 33] Here a different
approach is taken, in that Mn and Fe is quantified in two different electrolytes in the absence and in the presence of forced oxidation within a battery system. In addition, ageing in electrolytes is still performed for comparative purposes. Further, a FePO4 (FP) counter/reference electrode is used due to the flat 3.45V
vs Li potential, which avoids possible reduction of the Mn ions on the negative electrode, a factor that could reduce the amount of Mn in the electrolyte. Finally, the analytical technique used to quantify Mn content in the electrolyte is the Zeeman graphite furnace atomic absorption spectroscopy (Zeeman-GFAAS) couple with standard addition method, which provides a ppb range limit of detection, by overcoming the matrix effects due to the solvent and salt in the battery electrolyte.
2. Experimental
2.1. Materials
The positive electrode base materials were research grade carbon coated C-LiFe0.3Mn0.7PO4 (LFMP-1 and
LFMP-2, Johnson Matthey Battery Materials Ltd.), LiMn2O4 (MTI Corporation), and commercial
C-LiFePO4 (P2, Johnson Matthey Battery Materials Ltd.). The negative electrode base material was
C-FePO4 prepared from C-LiFePO4 as describe by Lepage et al.[35] Phase purity of the research grade
Electrolytes (BASF) were 1.0 M LiClO4 in EC:DMC (1:1) (Electrolyte A) and 1.0 M LiPF6 in EC:DMC
(1:1) (Electrolyte B). Water content, 11.5 ± 2.1 ppm and 22.2 ± 3.7 ppm, electrolyte A and B respectively, was determined with a 785 DMP Titrino Potentiometric Titrator (Metrohm) using Aqualine™ Complete 5 single component Karl Fischer reagent (Fischer Scientific). All electrolytes samples were transferred
directly from the argon filled glovebox to the titrator in a syringe to avoid exposure to ambient
atmosphere. Free acid titration yielding 1.6 ± 0.6 ppm (mass of HClO4 per mass of total electrolyte) and
18.8 ± 0.1 ppm (mass of HF per mass of total electrolyte) for electrolyte A and B respectively, was completed as describe by Chen et al. [36] with minor modifications: Titrations were performed on a slurry composed of 3g of crushed ice, 1 mL of water, 5 drops of indicator (bromothymol blue 0.04%) and approximately 1g of electrolyte (accurately weighted) using NaOH 0.005N standardized with potassium biphtalate primary standard (Sigma-Aldrich). All titration were completed in less than 2 minutes and once the end point was reached the blue color did not revert to yellow for at least 1 minute, indicating that acid formation was minimal during the titration.
2.2. Sample preparation
Suspension experiments were conducted with 250mg of material (LFP; LMO; LFMP-1 and LFMP-2) place into closed polystyrene containers with 3 mL of electrolyte A or B and stirred for 7 days at room temperature, labeled Susp samples hereafter. All dissolution experiments were conducted in an argon atmosphere glovebox (water and O2 content < 3ppm).
Electrochemical cell experiments were based on electrodes prepared by mixing in a rollermill for 24h active materials, SUPER P® Carbon Black (Imerys Graphite & Carbon) and polyvinylidene fluoride
(PVDF, Kynar KF Polymer W#1100) 80:10:10 %w/w in N-methylpyrrolidinone (NMP, Alfa Aesar) to produce an ink, which was coated onto an aluminium foil current collector using a doctor blade coater (4-sided film applicator p/n: 2021 from BYK).
The coatings were dried at 90°C in air for 2 hours, followed by 24 hours in a vacuum at 65°C. The electrodes had a geometrical surface area between 60 and 68 cm2 with coating thicknesses between 60
and 90 µm, and active material loading between 1.3 and 2.7 mg cm-2. A Celgard 2500 membrane was
sandwiched between the positive and negative electrode, the assembly rolled and place into a high density polyethylene container before transfer to the glovebox. 3 mL of electrolyte was subsequently added to the cell, which was closed with a low density polyethylene lid, and let to settle for 24 hours. Two different analyses were performed. In the first type, the sample was not submitted to electrochemical oxidation but allowed to rest with electrolyte for the same amount of time as required for electrochemical treatment (Labeled: Cell samples). The second type of sample, labeled Ox, was subjected to galvanostatic oxidation at 0.05C rate until a potential of 0.9V vs FP (4.35V vs Li) immediately followed by a potentiostatic step at 0.9V vs FP (4.35V vs Li) for a period of 72 hours. Electrochemical measurements were performed with a VMP3 multi-channel potentiostat and EC-Lab software from BioLogic Science instrument. All
electrochemical curves are available in the supporting information section. (Figure S-1 and S-2) The experimental capacities were calculated from the mass of active material in the electrode, by integrating the current, applied or measured, as a function of time, combining both the galvanostatic and
potentiostatic steps. The total capacity in % was calculated from the experimental values divided by their respective theoretical capacities. (i.e.: 170mAh g-1 for LFP, LFMP and 140mAh g-1 for LMO).
Samples for chemical quantification were obtained by transferring the electrolyte into a 10mL
polycarbonate syringe and rinsing 3 times for a total of 5mL of anhydrous acetonitrile (Sigma-Aldrich). Subsequently the samples where filtered with 0,02µm pore size filter (Whatman Anotop) inside the argon filled glove box. Samples were prepared in triplicates in NalgeneTM labware to avoid any side reaction
with HF or metal leaching that could occur with glassware. All dissolution experiments were conducted at
LFMP coin cell batteries were prepared using the same cathodes and separators as above, as well as, 0.75mm thick metallic lithium (Sigma-Aldrich) which served as the negative electrode. The geometrical areas for the electrodes were 1.5cm2 and 2.0cm2 for the cathode and anode respectively.
Manganese and iron quantification: Standard solutions were prepared from 1000ppm manganese and iron reference standard solution (Fischer Scientific and Spectro pure, respectively). All analytical
measurements were performed in triplicates for all solutions on a Varian Spectra 220Z with coated graphite tube analyser (Agilent Technologies). Single element hollow cathode lamps were used for manganese (AtomaxPerkin Elmer; λ =279.5nm) and iron (SCP science; λ = 248.3nm). All curves obtain for GFAAS have a regression coefficient higher than 0.990. All confidence intervals were calculated at a 95% confidence level, using Student-t statistics. For manganese, an instrumental detection limit of 0.5ppb was calculated with respect to the signal equal to three times the standard deviation of the background. Since the minimum dilution factor for the sample preparations was 100 times, a 50 ppb detection limit was obtained for the overall analytical method.
Note that the results in ppm reported in Figure 2 represent the mass of ions per mass of active material i.e. the proportion of the active material dissolved in the electrolytes. Since the value of active material varies between the different sample preparation and the electrolyte volume is always constant in our
methodology, reporting the results in ppm of active material is more representative of the effects of electrolytes and oxidation occurring to the materials. The result in ppm i.e. mass of ions per mass of electrolyte is presented in the supplementary information section for ease of comparison with literature (Figure S-3).[20, 32, 33]
3.
Results and discussion
3.1. Method validation
The GFAAS technique was chosen to measure the manganese content because of two major advantages: 1) the limit of detection for manganese is one to three orders lower than other spectroscopy techniques. [37] The samples can as such be diluted further to yield a more reproducible matrix compared to other techniques. 2) Low temperature preheating of the graphite furnace removes the organic solvents, followed by a pyrolysis step to decompose organic materials in the sample before atomisation. Organic solvents have been shown to present interference in other spectrometric techniques that involves sample transport and droplet formation[38, 39]. Validation of the analytical method was performed using a series of reconstituted samples as detailed below. (Table 1)
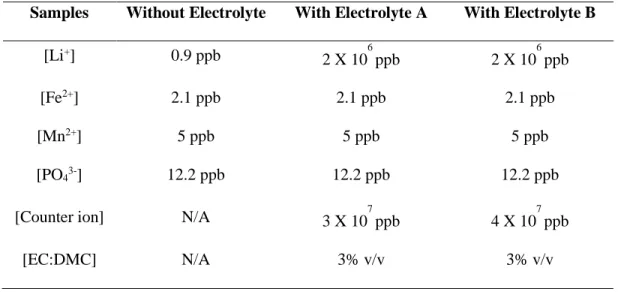
Table 1: Final ions concentrations for reconstituted samples
Samples Without Electrolyte With Electrolyte A With Electrolyte B
[Li+] 0.9 ppb 2 X 10 6 ppb 2 X 10 6 ppb [Fe2+] 2.1 ppb 2.1 ppb 2.1 ppb [Mn2+] 5 ppb 5 ppb 5 ppb [PO43-] 12.2 ppb 12.2 ppb 12.2 ppb
[Counter ion] N/A 3 X 10⁷ ppb 4 X 10⁷ ppb
Figure 1: Recovery for reconstituted samples with external and standard addition calibration (single column fitting image, color online only and color in print is not required)
Using external standard calibration complete recovery for the reconstituted sample without electrolyte is found i.e. the LFMP dissolved ions (Li, Fe, Mn and PO4) are not interfering with the manganese signal at
the examined concentration range. However, there is a significant loss of manganese signal for the two reconstituted samples where electrolytes A and B has been added. Given that the organics are evaporated during the drying step of the analysis, this interference is most likely linked to the large concentration of ions (CMn~106 Celectrolyte) added with the electrolyte. Standard addition was therefore applied to provide
full recovery within the confidence interval for the electrolyte containing reconstituted samples. Matrix matching was not attempted because samples will require different dilutions levels to ensure that the manganese concentration is within the linear range, which would require individual matrix matching of every standard to every sample. To evaluate the full range of the method, negative (LFP) and positive (LMO) controls were prepared. Analysis of manganese present in the LFP and FP materials (Figure 2) shows that the samples preparations are free from manganese that could have originated from the labware, electrolytes, carbon additive, binder, instrumentation etc. Further, it shows that our choice of FP counter electrode is not a source of Mn. The values obtained with the positive controls are the highest measured
manganese dissolution concentrations for all samples and represent the maximum validated range. The lack of full Mn recovery in reconstituted samples containing electrolyte, using other techniques than standard addition, shows the importance of providing full analytical method verification in other similar future studies.
3.2. Characterisation of positive electrode materials
3.2.1. Effect of electrolyte composition
Water presence in a lithium-ion battery system is well known to wreak havoc cell performance. This is, especially true when LiPF6 electrolytes are used, since lithium hexafluorophosphate is in equilibrium with
lithium fluoride and phosphorous pentafluoride (Equation 1). The latter reacts readily with water to form hydrofluoric acid (Equation 2). If enough water is present in the electrolyte, complete transformation into hydrofluoridric acid and phosphoric acid is expected (Equation 3) [28, 30].
LiPF6→ LiF + PF5 (1)
PF5+ H2O → POF3+ 2 HF (2)
LiPF6+ 4 H2O → LiF + 5 HF + H3PO4 (3)
Similar reactions are not reported in the literature for LiClO4 electrolytes. We therefore speculate that free
H2O in the absence of an imposed oxidation potential will react with the anions of the solid and render
them soluble e.g. forming OH- with LiMn
2O4, concomitantly with dissolution of the cations in the highly
polar electrolyte.[40].
In this work two different electrolytes, one containing LiClO4 (electrolyte A) and the other one LiPF6
(electrolyte B) is used, while salts concentration (1M) and solvent (EC: DMC) remains unchanged. Water and free acid contents are systematically higher in electrolyte B, but below 25ppm. Examining the
dissolved manganese vs electrolyte type, it is found that values for electrolyte B is systematically higher compared to electrolyte A (Figure 2).
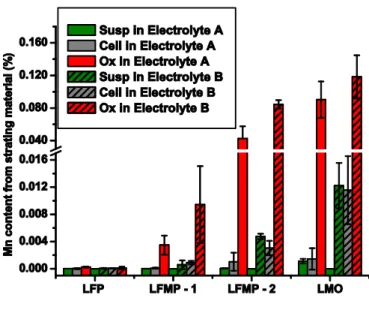
Figure 2: Dissolve manganese for samples LFP; LFMP-1; LFMP-2;LMO calculated as Mn content from starting material (%)
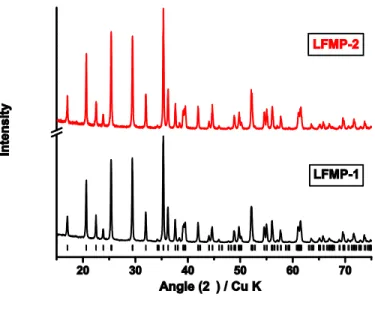
Figure 3: XRD patterns for LFMP-1 and LFMP-2
(single column fitting image, color online only and color in print is not required)
XRD (Figure 3) indicate no above detection limit impurity phases, and structures that can be assigned the orthorhombic Pnma olivine structure with cell volume and lattice parameters (a, b and c) within 0.5% of previously published values (Figure S-4 in supporting information)[41]. Yet, comparison of samples LFMP-1 and LFMP-2 show LFMP-2 to be more prone to manganese dissolution, independent of
electrolyte or electrochemical treatment chosen. This may be due to poor carbon coating [20, 32], particle size differences, as well as, shape differences. Cracked or lack of carbon coating on the particles lead to direct contact between the electrolyte and active material. This condition promotes dissolution until a passivation phenomenon can be observed i.e. a film forms at the surface and inhibit further dissolution of the material. SEM micrographs of LFMP-1 and LFMP-2 demonstrate particle size and structural
differences of the two materials. (Figure S-5 in supporting information) LFMP-2 exhibit smaller primary and larger secondary particles when compared to LFMP-1. Considering that ball milling is use to prepare the battery films, the secondary particle size is expected to be reduced greatly. Therefore the active
surface area should correlate to the primary particle size. LFMP-2 smaller primary particle size, suggest this to be the origin of the enhance Mn dissolution when compared to LFMP-1.
3.2.2. The Effect of Oxidation
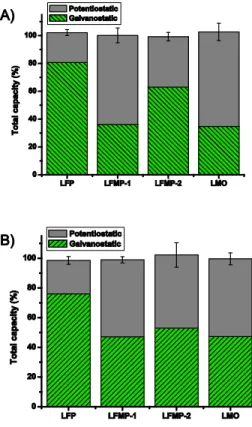
The Ox samples were prepared to examine the effect of oxidation of the positive electrode materials. The integrated currents are commensurate with complete oxidation i.e. delithiation for all materials in both electrolytes (Figure 4), and all materials containing manganese show a significant increase in dissolution.
Figure 4: Total capacity for Ox samples A) in electrolyte A and B) in electrolyte B (single column fitting image, color online only and color in print is not required)
This type of dissolution has been studied extensively in the lithium manganese spinel system, where two different domains are proposed.[21-31] The first, is related to materials maintained at a low state of
charge i.e. low potential relative to Li/Li+. In this domain Mn3+ ions are thermodynamically unstable and
can proceed to disproportionate into Mn2+ and Mn4+. The Mn2+ ions are prone to dissolve in the battery
electrolyte while the Mn4+ ions remain in the solid phase. As the material is delithiated with increased
potential, the disproportionation prone Mn3+ ions are transformed to Mn4+ ions. So for dissolution at
higher potentials, another mechanism must come into play. This mechanism is not yet fully understood, but it has been shown that dissolution is proportional to the amount of hydrofluoric acid in the electrolyte [28, 30]. In here, increasing manganese dissolution with the oxidation of the LMO material is also found. However, an increase in dissolved manganese is found for both electrolytes tested, in spite of the fact that electrolyte A based on LiClO4 contain no hydrofluoridric acid, and very little free acid (< 2ppm). Further,
the LMFP process is distinctly different from LMO. First, the oxidation process increases the oxidation from +2 to +3 and not from +3 to +4. So if the idea that Mn2+ ions are more likely to dissolve in the
battery electrolyte is retained, the manganese dissolution should be independent or possibly hampered by the electrochemical oxidation. The data however show that oxidation independent of the nature of
electrolyte leads to a profound increase in Mn dissolution (Fig. 2). The formation of hydrochloric acid has been demonstrated by Doyle et al. for LiClO4 electrolyte at high potential (ref), and, Jang et al. reported
that the oxidation of the water in the electrolyte could occur on the carbon particles within the positive electrodes thus leading to an increase in “free” protons.[21, 22] The amount of protons generated is presumed to be proportional to the amount of carbon present in the electrodes and water in the electrolyte. [21, 22] All the positive electrodes fabricated in this study contains the same amount of carbon, therefore a difference in free protons produce by the oxidation must originate with the water contents. Importantly, the LiPF6 electrolyte contains twice as much water as the LiClO4 one, and we find that the concentration
of dissolved Mn is proportional to this ratio. In addition to manganese, iron dissolution from LFMP analysis was conducted. The theoretical ratio between manganese and iron in the two LFMP materials is 2.3 (horizontal line in Figure 5). The experimental results correlate within the confidence interval to this ratio for suspension and oxidated LFMP samples. This strongly suggests that there is not selective leaching of Mn from the material.
Figure 5: Ratio of Mn and Fe in Susp and Ox samples for LFMP-1 and LFMP-2 in electrolyte A and B
(single column fitting image, color online only and color in print is not required)
To examine the effect of Mn dissolution on the performance of the LFMP samples, coin cell batteries where prepared. The results show capacity fading to be more pronounced with electrolyte B than A independent of LFMP sample (Figure 6). Further, LFMP-2, which is more prone to manganese
dissolution, generally exhibit higher capacity loss. Furthermore, the capacity fading stabilize after the first two cycles suggesting that dissolution of material and degradation of the electrode has seized.
Figure 6: Coin cell batteries performances for LFMP-1 and LFMP-2 in electrolyte A and B(single column fitting image, color online only and color in print is not required)
4. Conclusions
In this work an analytical method with a low detection limit (50 ppb) for manganese ions in battery electrolytes was presented. To assure statistical validity, all samples were prepared in triplicates with confidences intervals calculated at the 95% confidence level. Due to the required low detection limit, blank sample (LFP) was examined to assure that no manganese contamination took place during sample preparation or analysis. The influence of common electrolyte contaminants, such as water and free acid, was demonstrated to play a major role in the dissolution of the materials. Importantly, we establishing that oxidation of the active material has considerable effect on manganese dissolution, showing that ageing using suspensions without imposed electrochemical potential could lead to misinterpretations of stability. Further, by comparing the amount of dissolved iron and manganese it was shown that there is no reason to suspect selective leeching Mn from the structure of LFMP, which could have been a possible origin of the poor rate performance. Further work will be focused on associating the amount of dissolve
manganese to the overall long-term performance of in the different LFMP materials.
Acknowledgements
The authors thankfully acknowledge Dr. Katrin Schloegl at Johnson Matthey Battery materials GMBH, Mooburg, for providing LFMP-2 sample and Ngoc Duc Trinh for is technical support. The authors also gratefully acknowledge the National Science and Engineering Research Council (NSERC) for financial support, grant #CRDPJ 445519-12. And iNano, under Nanoquébec, grant no. R7-RD022. The 25µm microporous monolayer membrane (PP) was kindly donated by Celgard.
References
[1] J. B. Goodenough and Y. Kim Chemistry of Materials 2009, 22, 587. [2] B. Scrosati and J. Garche Journal of Power Sources 2010, 195, 2419. [3] B. Dunn, H. Kamath and J.-M. Tarascon Science 2011, 334, 928.
[4] L. Lu, X. Han, J. Li, J. Hua and M. Ouyang Journal of Power Sources 2013, 226, 272.
[5] A. Yamada, Y. Kudo and K.-Y. Liu Journal of The Electrochemical Society 2001, 148, A1153. [6] M. Yonemura, A. Yamada, Y. Takei, N. Sonoyama and R. Kanno Journal of The Electrochemical
[7] C. Delacourt, L. Laffont, R. Bouchet, C. Wurm, J.-B. Leriche, M. Morcrette, J.-M. Tarascon and C. Masquelier Journal of The Electrochemical Society 2005, 152, A913.
[8] N. Meethong, H. Y. S. Huang, S. A. Speakman, W. C. Carter and Y. M. Chiang Advanced Functional
Materials 2007, 17, 1115.
[9] C. Delacourt, P. Poizot, M. Morcrette, J. M. Tarascon and C. Masquelier Chemistry of Materials 2004, 16, 93.
[10] L. Wang, F. Zhou and G. Ceder Electrochemical and Solid-State Letters 2008, 11, A94. [11] G. Chen and T. J. Richardson Journal of Power Sources 2010, 195, 1221.
[12] D. Choi, D. Wang, I.-T. Bae, J. Xiao, Z. Nie, W. Wang, V. V. Viswanathan, Y. J. Lee, J.-G. Zhang, G. L. Graff, Z. Yang and J. Liu Nano Letters 2010, 10, 2799.
[13] Z. X. Nie, C. Y. Ouyang, J. Z. Chen, Z. Y. Zhong, Y. L. Du, D. S. Liu, S. Q. Shi and M. S. Lei Solid State
Communications 2010, 150, 40.
[14] S.-M. Oh, S.-W. Oh, C.-S. Yoon, B. Scrosati, K. Amine and Y.-K. Sun Advanced Functional Materials 2010, 20, 3260.
[15] S. P. Ong, A. Jain, G. Hautier, B. Kang and G. Ceder Electrochemistry Communications 2010, 12, 427.
[16] S. P. Ong, V. L. Chevrier and G. Ceder Physical Review B 2011, 83, 075112.
[17] A. K. Padhi, K. S. Nanjundaswamy and J. B. Goodenough Journal of The Electrochemical Society 1997, 144, 1188.
[18] A. Yamada and S.-C. Chung Journal of The Electrochemical Society 2001, 148, A960. [19] A. Yamada, Y. Kudo and K.-Y. Liu Journal of The Electrochemical Society 2001, 148, A747. [20] S. K. Martha, J. Grinblat, O. Haik, E. Zinigrad, T. Drezen, J. H. Miners, I. Exnar, A. Kay, B. Markovsky and D. Aurbach Angewandte Chemie International Edition 2009, 48, 8559.
[21] D. H. Jang, Y. J. Shin and S. M. Oh Journal of The Electrochemical Society 1996, 143, 2204. [22] D. H. Jang and S. M. Oh Journal of The Electrochemical Society 1997, 144, 3342.
[23] Y. Xia, Y. Zhou and M. Yoshio Journal of The Electrochemical Society 1997, 144, 2593. [24] A. Blyr, C. Sigala, G. Amatucci, D. Guyomard, Y. Chabre and J. M. Tarascon Journal of The
Electrochemical Society 1998, 145, 194.
[25] D. Larcher, P. Courjal, R. Herrera Urbina, B. Gérand, A. Blyr, A. du Pasquier and J. M. Tarascon
Journal of The Electrochemical Society 1998, 145, 3392.
[26] D. Aurbach, M. D. Levi, K. Gamulski, B. Markovsky, G. Salitra, E. Levi, U. Heider, L. Heider and R. Oesten Journal of Power Sources 1999, 81–82, 472.
[27] L. Yang, M. Takahashi and B. Wang Electrochimica Acta 2006, 51, 3228.
[28] J. Vetter, P. Novák, M. R. Wagner, C. Veit, K. C. Möller, J. O. Besenhard, M. Winter, M. Wohlfahrt-Mehrens, C. Vogler and A. Hammouche Journal of Power Sources 2005, 147, 269. [29] K. Kordesch and W. Taucher-Mautner In Encyclopedia of Electrochemical Power Sources; J. Garche, Ed.; Elsevier: Amsterdam, 2009, p 784.
[30] J. Vetter, M. Winter and M. Wohlfahrt-Mehrens In Encyclopedia of Electrochemical Power
Sources; G. Editor-in-Chief: Jürgen, Ed.; Elsevier: Amsterdam, 2009, p 393.
[31] A. Du Pasquier, A. Blyr, P. Courjal, D. Larcher, G. Amatucci, B. Gérand and J. M. Tarascon Journal
of The Electrochemical Society 1999, 146, 428.
[32] S.-M. Oh, H.-G. Jung, C. S. Yoon, S.-T. Myung, Z. Chen, K. Amine and Y.-K. Sun Journal of Power
Sources 2011, 196, 6924.
[33] M. Jo, H. Yoo, Y. S. Jung and J. Cho Journal of Power Sources 2012, 216, 162.
[34] B. Ziv, N. Levy, V. Borgel, Z. Li, M. D. Levi, D. Aurbach, A. D. Pauric, G. R. Goward, T. J. Fuller, M. P. Balogh and I. C. Halalay Journal of The Electrochemical Society 2014, 161, A1213.
[35] D. Lepage, F. Sobh, C. Kuss, G. Liang and S. B. Schougaard Journal of Power Sources 2014, 256, 61.
[36] Z. Chen, Y. Ren, A. N. Jansen, C.-k. Lin, W. Weng and K. Amine Nat Commun 2013, 4, 1513. [37] D. A. Skoog and J. J. Leary Principles of instrumental analysis; Fourth ed.; Saunders College Publishing, 1992.
[38] A. W. Boorn and R. F. Browner Analytical Chemistry 1982, 54, 1402. [39] J. W. Olesik Analytical Chemistry 1991, 63, 12A.
[40] P. Arora, R. E. White and M. Doyle Journal of The Electrochemical Society 1998, 145, 3647. [41] J. Yao, S. Bewlay, K. Konstantionv, V. A. Drozd, R. S. Liu, X. L. Wang, H. K. Liu and G. X. Wang