OATAO is an open access repository that collects the work of Toulouse researchers and makes it freely available over the web where possible
Any correspondence concerning this service should be sent
to the repository administrator: [email protected]
This is an author’s version published in: http://oatao.univ-toulouse.fr/21727
To cite this version:
Richard, William and Evrard, David and Gros, Pierre Kinetic Study of Redox Probes on
Glassy Carbon Electrode Functionalized by 4-nitrobenzene Diazonium. (2018) International
Journal of Electrochemical Science, vol.14 (1). 453-469. ISSN 1452-3981 Open Archive Toulouse Archive Ouverte
Kinetic Study of Redox Probes on Glassy Carbon Electrode
Functionalized by 4-nitrobenzene Diazonium
William Richard, David Evrard*, Pierre Gros
Laboratoire de Génie Chimique, Université de Toulouse, CNRS, INPT, UPS, Toulouse, France
*E-mail: [email protected]
The electrochemical behavior of organic films grafted onto glassy carbon (GC) and bearing NO2, NHOH
or NH2 groups was studied by using three different redox probes, namely ferricyanide Fe(CN)63-,
hexaammineruthenium(III) Ru(NH3)63+ and ferrocenemethanol FcMeOH. Films were prepared by
grafting 4-nitrobenzene diazonium onto the GC surface by constant potential electrolysis for durations varying from 1 to 300 s. NO2 groups were converted into NHOH and NH2 by performing further
electrolyses at the corresponding potentials. The redox probes were chosen because of their different global charge and electron transfer process. For all the as-obtained films, the Koutecky-Levich treatment was applied and the cathodic (β) and anodic (α) transfer coefficients were extracted. All these data were discussed and compared in order to better understand the structure and the electrochemical properties of the organic films.
Keywords: 4-nitrobenzene diazonium; electrode functionalization; stratified film; Koutecky-Levich analysis; electrochemical kinetics; redox probes
1. INTRODUCTION
Electrode surface functionalization has attracted tremendous attention in the last decades. Many strategies have been developed to purposely modify the electrode, such as self-assembled monolayers “SAMs” [1], conducting polymers [2] or nanoscale-based materials [3]. Amongst all these strategies dedicated to surface modification, electrografting is certainly the most studied one since it affords an easy, covalent way to immobilize additional functional groups of interest on the electrode [4]. This is particularly true considering diazonium compounds, since their versatility offers a wide range of potentialities [4-6]. Depending on the functional group borne by the aromatic skeleton, diazoniums have been used in many research fields such as molecular electronics [5], energy conversion and storage [7,8] and chemical [9,10] or biological [11,12] sensing. Further functionalization can also be achieved by
coupling chemical reactions to diazonium grafting, such as amine/carboxyl condensation [13], click chemistry [13,14] or electropolymerization in the case of conjugated monomer-functionalized diazonium [6,9,15]. The as-obtained mixed organic layers have been recently reviewed [16].
Because commercially available and bearing an electroactive nitro group, 4-nitrobenzene diazonium (NBD) has been used for many applications. Indeed, it served as a redox probe to evidence the difference of reactivity between single and multilayer graphene sheets [17], to highlight the effect of a radical scavenger on the organic layer formation [18], or to illustrate carbon surface nanopatterning [19]. Also, NBD was used to promote the covalent immobilization of organometallic model of enzyme onto carbon surface [20] or to modify the electrical properties of graphene field-effect transistors [21]. Thus, as so commonly used with various goals, NBD grafting and reduction mechanism was expected to be well-known for years. However, we have recently demonstrated that, contrary to what many authors claimed [22-27], NBD grafting onto the electrode surface and nitro groups reduction were definitely separated processes [28] and that the grafting step actually occurs at much higher potential than usually reported values, ca. 0.3 V vs. saturated calomel electrode (SCE), in accordance with the suggestion made earlier by Cline et al. [29]. Thus arose the possibility to afford an interface bearing only nitro groups, these latter being available for further electrochemical treatment. Indeed, it is well established that NO2 can be reversibly converted into the corresponding radical anion in aprotic
conditions [30], whereas in protic media the reduction mechanism is more complex, leading to NH2
groups as final product through an intermediary, reversible redox couple, namely nitroso/hydroxylamine (NO/NHOH) [25,28]. In a recent work [31], we have showed by a coupled electrochemical and spectroscopic approach that reduction at -0.1 V vs. SCE of a NBD-functionalized glassy carbon (GC) electrode in aqueous solution leads to a stratified organic film in which the easier NO2 moieties to be
reduced are the closest ones to the electrode surface, and the last to be reduced are the ones located at the interface between the film and the solution. Thus, during the electrolysis, the organic film successively exhibits NH2 groups at the electrode surface, then NHOH in its inner, intermediary part and
finally remaining NO2 at its outer interface. Only another electrolysis at potential as cathodic as -0.8 V
vs. SCE allows a complete reduction of all electroactive groups into NH2. Furthermore, we have also
demonstrated that during electrolysis at -0.1 V the whole reaction rate is actually limited by the charge transfer process and that consequently there is no limitation from a lack of solvation, contrary to what was suggested by Ceccato et al. [32].
In this work, we present the study of GC electrodes functionalized by NBD, with the organic film bearing mainly or exclusively NO2, NHOH or NH2 moieties. In order to better characterize the
organic layer and its structure, films with different thicknesses were prepared by varying NBD grafting time, and successively studied by means of several redox probes, namely ferricyanide Fe(CN)63-,
hexaammineruthenium(III) Ru(NH3)63+ and ferrocenemethanol FcMeOH. These latter were chosen
because they present differences in their global charge (anionic, cationic or neutral, respectively) and electron transfer process (inner-sphere for ferricyanide, outer-sphere for the other two probes), and are thus expected to afford different electrochemical responses and behaviors [33]. For each probe and each film-functionalized GC electrode, steady-state voltammograms were recorded and the Koutecky-Levich mathematical treatment applied in order the cathodic (β) and anodic (α) transfer coefficients to be extracted.
2. EXPERIMENTAL
2.1. Chemicals
All products were used as received. 4-nitrobenzene diazonium (NBD) tetrafluoroborate (C6H4N3O2BF4, 97 %) and ferricyanide(III) potassium (K3Fe(CN)6, 99 % powder) were purchased from
Sigma-Aldrich. Aniline (C6H4(NH2)2 99 %) was obtained from Fluka. Hexaammineruthenium(III)
chloride (Ru(NH3)6Cl3) and potassium hexafluorophosphate (KPF6, 98 %) were purchased from Alfa
Aesar. Potassium dihydrogenophosphate (KH2PO4), di-potassium hydrogenophosphate (K2PHO4) and
hydroxymethylferrocene (Ferrocenemethanol FcMeOH, 97 %) were supplied by Acros Organics. Acid solutions were prepared by dilution of hydrochloric acid (37 % HCl) from VWR using Milli-Q water (18 MΩ cm), and were deaerated by bubbling Nitrogen during 10 minutes. A gas stream was maintained over the solutions during experiments.
2.2. Apparatus
All electrochemical experiments were performed at room temperature using a Metrohm µ-Autolab II potentiostat interfaced to a personal computer and controlled with NOVA 1.11 software package. A classical three-electrode glass cell was used with a Metrohm platinum rod and a Radiometer saturated calomel electrode (SCE) connected to the cell by a capillary as counter and reference electrode, respectively. Working electrode was a 3 mm diameter glassy carbon (GC) rotating disk electrode from Radiometer.
2.3. Electrode functionalization
Prior to modification, GC electrode was manually polished to a mirror-like finish successively with 9 µm, 3 µm and 1 µm diamond powder. After each step, the electrode was thoroughly rinsed with Milli-Q water and sonicated in ethanol for 5 min in order to remove any impurity.
Aniline was converted into phenyldiazonium by using a procedure previously reported for the synthesis of other diazonium compounds [14,34].
Freshly polished electrode was modified by constant potential electrolysis at 0.3 V in a 0.1 M HCl (pH 1) solution containing 2.5 mM NBD or phenyldiazonium for a given time ranging from 1 to 300 s. After modification, the electrode (designated as GC-NO2grafting time or GC-Phgrafting time, respectively)
was carefully rinsed with Milli-Q water before and after sonication in ethanol during 5 minutes to remove weakly adsorbed moieties. Further modification was operated on GC-NO2grafting time by successive
constant potential electrolyses at -0.1 V and -0.8 V during 300 s in 0.1 M HCl to afford GC-NHOHgrafting
time and GC-NH
3. RESULTS AND DISCUSSION
3.1. Electrode functionalization
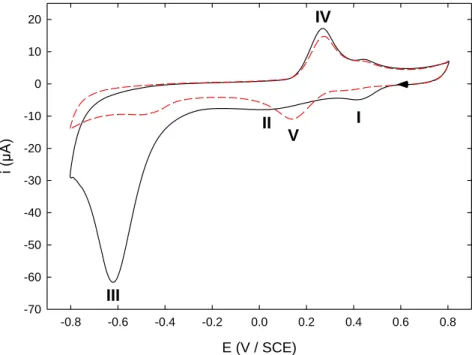
Figure 1 presents the cyclic voltammograms (CVs) obtained on a carefully polished glassy carbon (GC) electrode dipped in a 0.1 M HCl solution containing 2.5 mM NBD. The shape of the first and second scans was classical and consistent with our previous reports [28,31]. Hence, Peak I observed on the first forward scan actually corresponded to diazonium reduction and subsequent grafting onto GC surface while Peaks II and III were rather related to NO2 reduction in NHOH and NH2 groups (Scheme
1).
Figure 1. CV recorded in a 0.1 M HCl solution containing 2.5 mM NBD on a freshly polished GC electrode. (Solid line) first and (dashed line) second scan. Scan rate: 100 mV s-1.
On the first backward scan, Peak IV was indicative of the presence of the NO/NHOH reversible redox system, together with Peak V on the second forward scan. It is worth noting that, on this latter scan, Peak I was no longer observed, in accordance with the self-inhibiting and blocking properties of diazonium layers [24,26]. In recent papers [28,31], we have proved that NBD grafting by constant potential electrolysis at a potential corresponding to Peak I (ca. 0.3 V) left the nitro groups unaffected by the electrochemical process. We have also demonstrated that reduction of the grafted layer at a potential close to that of Peak II afforded a stratified film bearing successively NH2, NHOH and
unaffected NO2 while increasing the distance to the electrode surface, in accordance with a charge
transfer-limited mechanism and an electron tunneling process, the efficiency of which decreases throughout the film from the electrode to the solution [31]. Further electrolysis at potential of Peak III finally led to a layer mainly consisting of NH2 groups. For convenience, functionalized electrodes
obtained by constant potential electrolysis at potential corresponding to Peak I, II or III were designated E (V / SCE) -0.8 -0.6 -0.4 -0.2 0.0 0.2 0.4 0.6 0.8 i (µ A ) -70 -60 -50 -40 -30 -20 -10 0 10 20 I II III IV V
as GC-NO2grafting time, GC-NHOHgrafting time and GC-NH2grafting time, respectively (See Experimental Section for details). GC GC GC GC NO2 N2 Peak I + e-, -N2 NO2 NO2 Peak II + 4 H+, + 4 e -NHOH NHOH Peak III + 2 H+, + 2 e -NH2 (1) (2) (3) GC GC GC GC NO NHOH (4) Peak IV / V + 2 H+, + 2 e
-Scheme 1. Electrochemical reduction pathway of diazonium and NO2groups from NBD.
3.2. Redox probes behavior at the functionalized electrodes
Three different redox probes were chosen considering both their electrochemical behavior and their global charge, namely ferricyanide Fe(CN)63-, hexaammineruthenium(III) Ru(NH3)63+ and
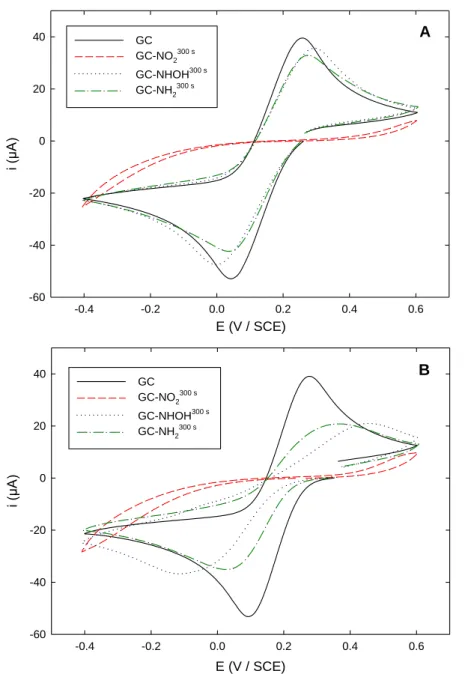
ferrocenemethanol FcMeOH. Figure 2A shows the CVs obtained in a 0.1 M KPF6 (pH 3.5) solution
containing 5 mM Fe(CN)63- on bare GC and on the 3 different functionalized electrodes. On bare GC,
Fe(CN)63- exhibited a quasireversible system with a ΔEp = 210 mV consistent with many previous reports
[22,33,35-37]. On GC-NO2300 s, the reversible signal was almost totally suppressed, in accordance with
Figure 2. Cyclic voltammograms of 5 mM Fe(CN)63- recorded in (A) 0.1 M KPF6 solution (pH 3.5) and
(B) 0.1 M PBS solution (pH 7) on: (black solid line) unmodified GC; (red dashed line)
GC-NO2300 s; (blue dotted line) GC-NHOH300 s; (green dashed-dotted line) GC-NH2300 s. Scan rate:
100 mV s-1.
Indeed, the fact that the electrochemical signals were suppressed on GC-NO2300 s can be
accounted for considering that the nitro-bearing layer is hydrophobic whereas Fe(CN)63- is rather
hydrophilic [33,38]. Moreover, electrostatic repulsion may be also invoked between the electron-withdrawing NO2 and the negatively charged redox probe. When GC-NO2300 s was changed to
GC-NHOH300 s, the redox system was restored with a ΔE
p slightly larger (ca. 300 mV) than on bare GC, the
peak currents being around 92 % of the initial signal. However, it has to be noticed that the observed signal contained a contribution from the NO/NHOH couple, the apparent standard potential of which being 0.15 V at such pH conditions [28]. On the basis of CVs recorded on the same electrode dipped in a redox probe-free KPF6 solution (not shown), this contribution was evaluated around 10 % of the whole
E (V / SCE) -0.4 -0.2 0.0 0.2 0.4 0.6 i (µA ) -60 -40 -20 0 20 40 GC GC-NO2300 s GC-NHOH300 s GC-NH2300 s A E (V / SCE) -0.4 -0.2 0.0 0.2 0.4 0.6 i (µA ) -60 -40 -20 0 20 40 GC GC-NO2300 s GC-NHOH300 s GC-NH2300 s B
electrochemical signal. The Fe(CN)63- redox system being known to proceed essentially via an
inner-sphere mechanism [39,40], the signal recorded on GC-NHOH300 s suggested the film to exhibit pinholes
[33] or discontinuities [41]. Also, the thickness of the outer layer bearing the remaining NO2 groups has
to be very low, in order the approach of the redox probe not to be disfavored. Finally, a behavior similar to that observed on GC-NHOH300 s was recorded on GC-NH2300 s. The anodic and cathodic peak currents
were however slightly lower than that previously observed on GC-NHOH300 s, mainly as a consequence of the absence of the NO/NHOH couple contribution.
The influence of pH value on the CVs was checked by performing the same experiment in a 0.1 M phosphate buffer saline (PBS) solution (pH 7) (Figure 2B). In such conditions, the behavior of Fe(CN)63- on GC-NO2300 s was similar to that obtained in KPF6 (pH 3.5), i.e. the electrochemical signal
was almost totally suppressed. On the contrary, on the other two functionalized electrodes, the redox signals were drastically different. Indeed, a slowed system was observed, with large peaks the current of which was only around 60 % of that recorded on bare GC and ΔEp of 560 and 340 mV for GC-NHOH300 s and GC-NH
2300 s, respectively. Thus, electrostatic interactions proved to be a key feature in Fe(CN)6
3-response on GC-NHOH300 s and GC-NH2300 s, both terminal groups being unprotonated at pH 7. Such a
variation in Fe(CN)63- electrochemical response with respect to pH has already been reported by Schauff
et al. in the case of a GC electrode functionalized with 4-diazo-N,N-diethylaniline [40]. Moreover, the important difference in the ΔEp values recorded between GC-NHOH300 s and GC-NH2300 s (ca. 560 mV
and 340 mV, respectively) suggested steric hindrance effects to occur, thus favoring the hypothesis of an organic film exhibiting pinholes rather than discontinuities. The higher electron density on the NHOH groups compared to NH2 groups may also account for the larger ΔEp observed on GC-NHOH300 s.
The behavior of Ru(NH3)63+ on bare GC and on the three different functionalized interfaces was
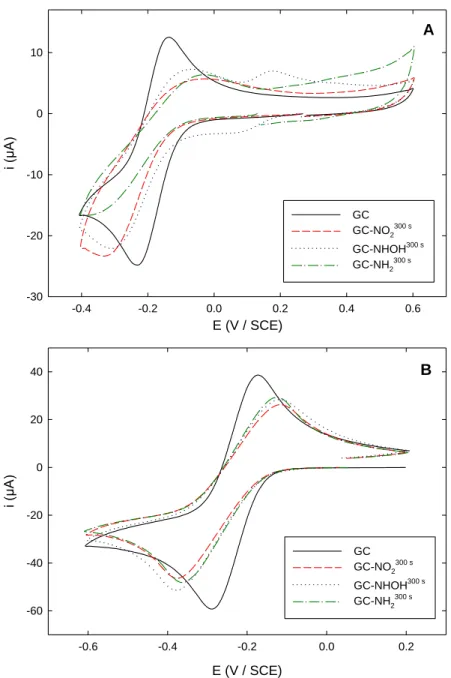
then examined. Figure 3A depicts the corresponding CVs obtained in 0.1 M KPF6 (pH 3.5). On bare GC,
the well-known reversible system for Ru(III)/Ru(II) was observed at -0.18 V, with a ΔEp of 100 mV.
GC-NO2300 s and GC-NHOH300 s electrodes afforded very similar signals, the cathodic peak currents of
which were almost comparable to that recorded on bare GC on the forward scan, with a slightly larger ΔEp indicative of a slowed electron transfer kinetic. It is worth noting that the small reversible system
observed on GC-NHOH300 s at 0.15 V corresponded to the NO/NHOH couple as previously discussed. GC-NH2300 s also exhibited a slowed redox system, but in this latter case the cathodic peak current was
significantly lower (around 35 %) than that recorded on bare GC. This may be indicative of a higher electrostatic repulsion between the cationic redox probe and the protonated form of the amino group. All these results were consistent with the outer-sphere mechanism attributed to the Ru(NH3)63+ redox system
[22,39], inducing the probe is barely affected by the organic film at the electrode surface. It has to be noticed that the reoxidation peak on the backward scan was significantly smaller than the reduction one due to the fact that the potential was reversed at -0.4 V, i.e. close to the reduction peak potential, in order not to reach a potential value low enough to undergo the reduction of the organic layer into NH2.
The same voltammograms recorded on the 4 different electrodes in 0.1 M PBS (pH 7) showed similar results (Figure 3B): whatever the functionalization operated on the electrode, the redox system was slowed compared to bare GC. However, in this case the absence of protonated NHOH or NH2 groups
was favorable to the cationic redox probe approach, from the electrostatic point of view, and consequently the recorded signals were better defined than those observed at pH 3.5.
Figure 3. Cyclic voltammograms of 5 mM Ru(NH3)63+ recorded in (A) 0.1 M KPF6 solution (pH 3.5)
and (B) 0.1 M PBS solution (pH 7) on: (black solid line) unmodified GC; (red dashed line)
GC-NO2300 s; (blue dotted line) GC-NHOH300 s; (green dashed-dotted line) GC-NH2300 s. Scan rate:
100 mV s-1.
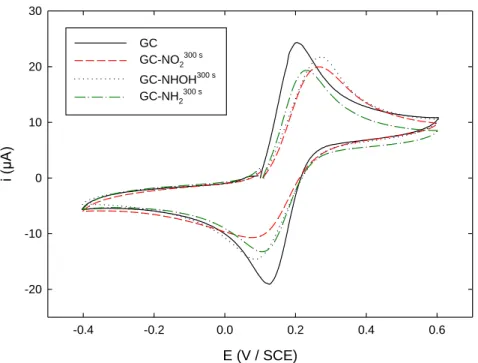
Finally, the response of the 4 different interfaces towards the neutral, outer-sphere mechanism FcMeOH probe was studied. Figure 4 depicts the results obtained in 0.1 M KPF6 (pH 3.5). For all three
functionalized interfaces, the reversible signal was only slightly slowed compared to bare GC, whatever the group borne by the film. The reduction peaks were smaller and larger than the oxidation ones, in accordance with a repulsive effect of the layer toward the ferrocenium cation.
E (V / SCE) -0.4 -0.2 0.0 0.2 0.4 0.6 i (µ A ) -30 -20 -10 0 10 GC GC-NO2300 s GC-NHOH300 s GC-NH2300 s E (V / SCE) -0.6 -0.4 -0.2 0.0 0.2 i (µ A ) -60 -40 -20 0 20 40 GC GC-NO2300 s GC-NHOH300 s GC-NH2300 s A B
Figure 4. Cyclic voltammograms recorded in a 0.1 M KPF6 solution (pH 3.5) containing 5 mM FcMeOH
on: (black solid line) unmodified GC; (red dashed line) GC-NO2300 s; (blue dotted line)
GC-NHOH300 s; (green dashed-dotted line) GC-NH2300 s. Scan rate: 100 mV s-1.
3.3. Kinetics features of the redox probes at the functionalized electrodes
In order to get more information upon kinetics features of the redox probes on the different modified electrode surface, a more systematic study was conducted. Figure 5 shows steady-state, linear voltammograms recorded at different rotation rates ω on GC-NHOH300 s in 0.1 M KPF6 (pH 3.5)
containing 5 mM Fe(CN)63-.
Figure 5. Steady-state voltammograms recorded in a 0.1 M KPF6 solution (pH 3.5) containing 5 mM
Fe(CN)63- on GC-NHOH300 s at 5 mV s-1 using different rotation rates ω.
E (V / SCE) -0.4 -0.2 0.0 0.2 0.4 0.6 i (µA ) -20 -10 0 10 20 30 GC GC-NO2 300 s GC-NHOH300 s GC-NH2300 s E (V / SCE) -0.4 -0.3 -0.2 -0.1 0.0 0.1 0.2 i (µA ) -150 -100 -50 0 1000 rpm 1500 rpm 2000 rpm 2500 rpm 3000 rpm
Starting from the open-circuit potential value, the currents recorded were almost the same in the first part of the curve whatever the considered value of ω, in agreement with a charge transfer-limited reaction rate. Then the currents began to differ ones from the others while changing ω, as a consequence of mass transport limitation. It was verified that the current plateau evolved linearly as a function of the square root of the rotation rate ω (not shown). This result was consistent with the fact that the organic film was thin enough (ca. 4 nm [34]) in order not to hamper the diffusion process of the redox probe. Although the current plateau was not well-defined, the recorded data were treated using the Koutecky-Levich equation (Eq. (1)) [42]:
1 𝑖 = 1 𝑖k+ 1 𝑖d= − 1 𝑛 𝐹 𝐴 𝑘 𝑐− 1 0.62 𝑛 𝐹 𝐴 𝐷2 3⁄ 𝜔1 2⁄ 𝜈−1 6⁄ 𝑐 (1)
where ik and id represent the kinetic limited and mass transfer controlled currents, respectively,
A is the electrode active surface area (here assumed to be the geometrical area of the GC electrode, ca. 7.1×10⁻² cm2), F is the Faraday constant (96500 C mol-1), k is the potential-dependent charge transfer
rate constant, c is Fe(CN)63- bulk concentration (5 mM), D is its diffusion coefficient (5.5×10⁻⁶ cm2 s-1)
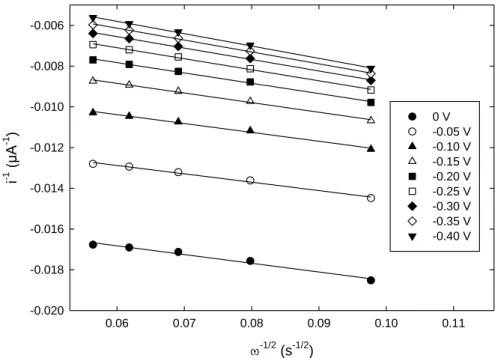
[43], and is the kinematic viscosity of the aqueous solution (0.01 cm2 s-1). According to Equation (1), the graph i-1 as a function of ω-1/2 was plotted for potential values ranging from 0 to -0.4 V (Figure 6).
Figure 6. Koutecky-Levich plots at different potentials using data extracted from Fig. 5.
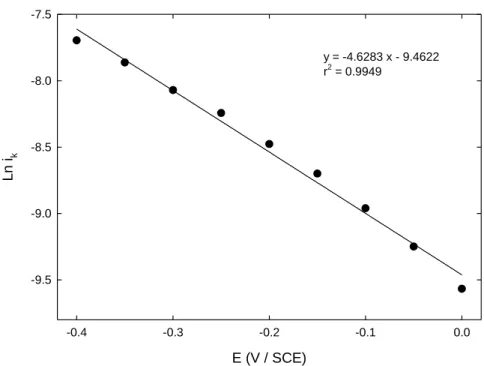
All the resulting curves were successfully fitted using a linear regression and the intercepts provided the values of the kinetic-limited current contribution ik. Finally ln ik was plotted as a function
of the potential (Figure 7). From this latter graph, the cathodic transfer coefficient β was obtained from the expression of the charge transfer rate constant k (Equation (2)):
𝑘 = 𝑘° exp (− 𝐹
𝑅𝑇(𝐸 − 𝐸°
′)) (2)
where k° (cm s-1) is the intrinsic charge transfer rate constant, R is the gas constant (8.31 J mol-1
K-1), and E°’ is the apparent standard potential (V).
-1/2(s-1/2) 0.06 0.07 0.08 0.09 0.10 0.11 i -1 (µA -1 ) -0.020 -0.018 -0.016 -0.014 -0.012 -0.010 -0.008 -0.006 0 V -0.05 V -0.10 V -0.15 V -0.20 V -0.25 V -0.30 V -0.35 V -0.40 V
Figure 7. Variation of the kinetics-limited current Ln ik corresponding to Fe(CN)63- reduction on
GC-NHOH300 s as a function of the applied potential.
A similar treatment was applied to GC-NHOH prepared using shorter grafting times and to all the corresponding GC-NO2grafting time and GC-NH2grafting time. In order to get more information on the
influence of the aromatic substituent, graftings were also performed using an unsubstituted diazonium salt, namely phenyldiazonium, and the corresponding interfaces GC-Phgrafting time studied as the other
three. For the sake of comparison, all the obtained β values were normalized with respect to βGC, i.e. the
β value experimentally determined for Fe(CN)63- on bare GC (ca. 0.45). All these results are summarized
on Figure 8A and Table 1.
Clearly, the interface bearing NO2 groups exhibited the most blocking behavior compared to the
interfaces with NHOH or NH2, as the β/βGC ratio was found systematically lower in the former case for
a given grafting time (Figure 8A and Table 1). Also, the comparison between GC-NO2grafting time and
GC-Phgrafting time evidenced the respective contribution of NO2 groups and the aromatic skeleton on the
kinetics lowering: except for short grafting times (ca. between 1 and 10 s) which produce very thin films, the β/βGC ratio was always slightly lower when operating on the NO2-bearing interface. It is worth noting
that for GC-NO2grafting time, the β/βGC ratio decreased as soon as 1 s grafting (β/βGC = 0.70) down to a limit
value ca. 0.33 for 30 s grafting or longer time. If the first, decreasing trend is logical since one may expect the thicker the film, the lower the kinetics, the almost absence of evident link between film thickness and β/βGC value for grafting time higher than 30 s is more surprising, especially taking into
account that it has been reported in the literature that diazonium films growth usually continues up to 300 s grafting [25]. E (V / SCE) -0.4 -0.3 -0.2 -0.1 0.0 Ln ik -9.5 -9.0 -8.5 -8.0 -7.5 y = -4.6283 x - 9.4622 r2 = 0.9949
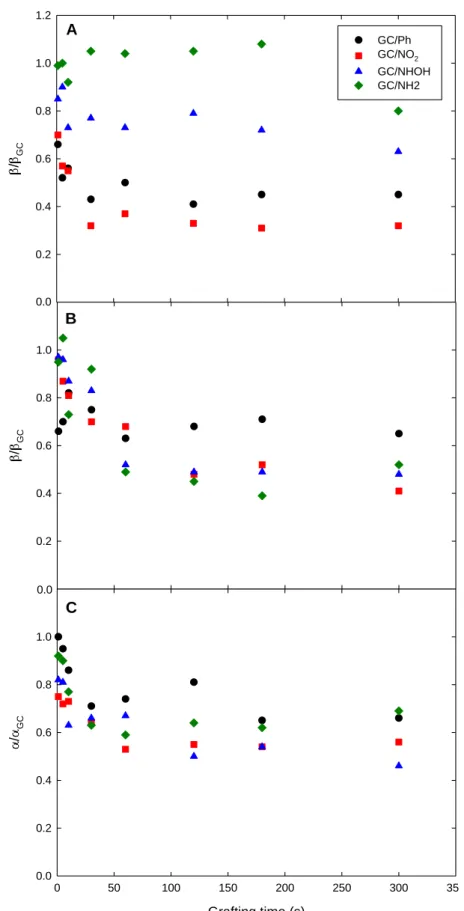
Figure 8. Cathodic (β) and anodic (α) transfer coefficients as a function of diazonium grafting time for: (A) Fe(CN)63-; (B) Ru(NH3)63+; (C) FcMeOH. (Black circle) GC/-Ph; (red square) GC-NO2;
(blue triangle) GC-NHOH; (green diamond) GC-NH2. All the values are normalized with respect
to that found on unmodified GC.
/ GC 0.0 0.2 0.4 0.6 0.8 1.0 1.2 GC/Ph GC/NO2 GC/NHOH GC/NH2 /GC 0.0 0.2 0.4 0.6 0.8 1.0 1.2 Grafting time (s) 0 50 100 150 200 250 300 350 / GC 0.0 0.2 0.4 0.6 0.8 1.0 1.20.0 0.0 A B C
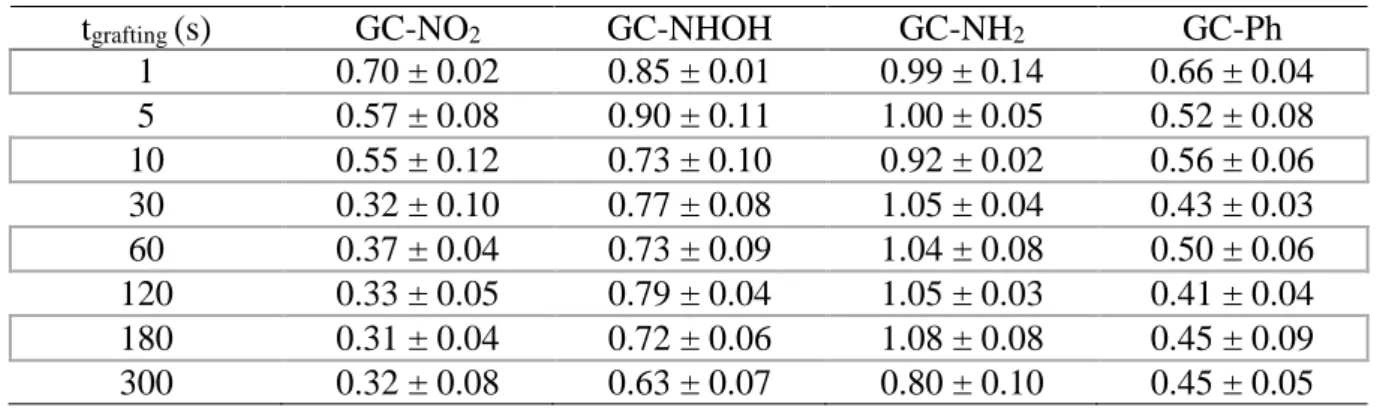
Table 1. Values of the cathodic transfer coefficients ratio β/βGC of Fe(CN)63- obtained by the
Koutecky-Levich and Tafel methods as a function of diazonium grafting time for different substituted or unsubstituted compounds from steady-state voltammograms recorded in 0.1 M KPF6 (pH 3.5)
containing 5 mM Fe(CN)63-. βGC = 0.45 ± 0.04 (calculated using same methods on unmodified
GC electrode).
tgrafting (s) GC-NO2 GC-NHOH GC-NH2 GC-Ph
1 0.70 ± 0.02 0.85 ± 0.01 0.99 ± 0.14 0.66 ± 0.04 5 0.57 ± 0.08 0.90 ± 0.11 1.00 ± 0.05 0.52 ± 0.08 10 0.55 ± 0.12 0.73 ± 0.10 0.92 ± 0.02 0.56 ± 0.06 30 0.32 ± 0.10 0.77 ± 0.08 1.05 ± 0.04 0.43 ± 0.03 60 0.37 ± 0.04 0.73 ± 0.09 1.04 ± 0.08 0.50 ± 0.06 120 0.33 ± 0.05 0.79 ± 0.04 1.05 ± 0.03 0.41 ± 0.04 180 0.31 ± 0.04 0.72 ± 0.06 1.08 ± 0.08 0.45 ± 0.09 300 0.32 ± 0.08 0.63 ± 0.07 0.80 ± 0.10 0.45 ± 0.05
This latter observation suggests that for thick films, Fe(CN)63- mass transport up to the electrode
surface and subsequent charge transfer mainly occurs via pinholes or defects that are present into the organic film, and the density of which does not evolve while increasing the film thickness. This is consistent with the fact that 30 s is generally considered as the average time needed to produce a complete monolayer onto the electrode surface when an overpotential sufficient enough is applied [14]. On
GC-NHOHgrafting time, the β/βGC ratio slowly decreased while increasing the grafting time without reaching a
limit value. Keeping in mind that at such a pH value (ca. 3.5) NHOH groups are under their protonated form, one may assume the barrier effect afforded by growing organic layer is counterbalanced by the favorable electrostatic interaction between the positively charged film and Fe(CN)63-. On GC-NH2grafting time, the β/β
GC ratio appeared to be barely affected by the presence of the organic film, except for the
latest value corresponding to a 300 s grafting which was slightly lower, although in the limit of the calculated uncertainties. In a similar trend compared to GC-NHOHgrafting time, one has to consider the amino groups to be under their NH3+ form which is electrostatically more favorable to Fe(CN)63- than
protonated hydroxylamino groups. Moreover, an additional hypothesis to account for these results would be to consider that GC-NH2 affords a less sterically hindered film than GC-NHOH, which may thus
favor Fe(CN)63- approach to the electrode surface via the pinholes. Finally, it has to be noticed that, for
a given grafting time, the β/βGC ratio was systematically found to increase following the trend GC-NO2
< GC-NHOH < GC-NH2. This latter observation is consistent with the fact that nitro groups exhibit
strong unfavorable electrostatic interaction with the anionic Fe(CN)63- redox probe, while NHOH and
NH2 under their protonated form favor this latter interaction. Thus, in this case, the aromatic substituent
plays a key role in the electrochemical kinetic since it is capable of diminish the barrier effect of the film.
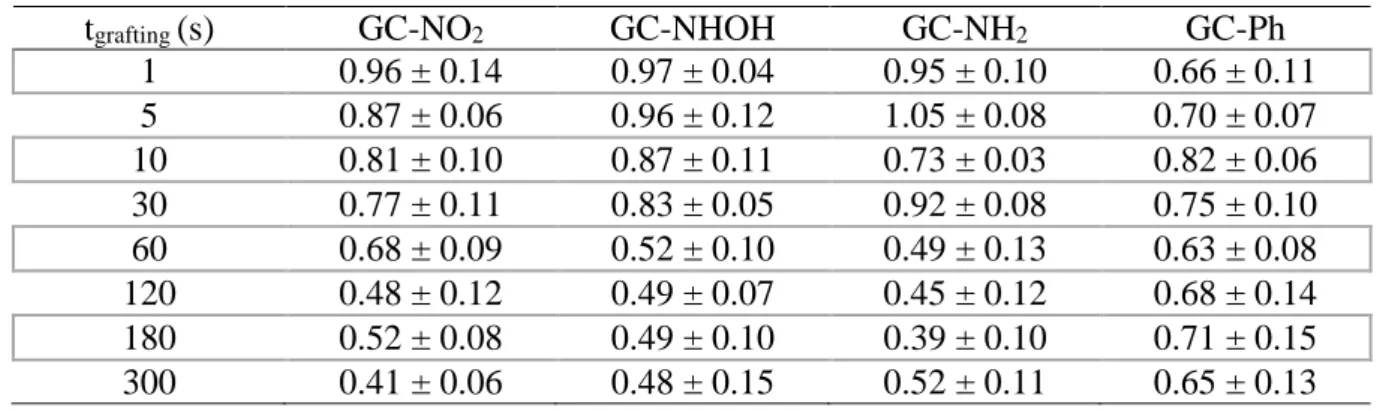
The same experiments were performed using hexammineruthenium(III) Ru(NH3)63+ as the redox
probe. The results corresponding to the evolution of the β/βGC ratio as a function of grafting time for the
Table 2. Values of the cathodic transfer coefficients ratio β/βGC of Ru(NH3)63+ obtained by the
Koutecky-Levich and Tafel methods as a function of diazonium grafting time for different substituted or unsubstituted compounds from steady-state voltammograms recorded in 0.1 M KPF6 (pH 3.5)
containing 5 mM Ru(NH3)63+. βGC = 0.53 ± 0.04 (calculated using same methods on unmodified
GC electrode).
tgrafting (s) GC-NO2 GC-NHOH GC-NH2 GC-Ph
1 0.96 ± 0.14 0.97 ± 0.04 0.95 ± 0.10 0.66 ± 0.11 5 0.87 ± 0.06 0.96 ± 0.12 1.05 ± 0.08 0.70 ± 0.07 10 0.81 ± 0.10 0.87 ± 0.11 0.73 ± 0.03 0.82 ± 0.06 30 0.77 ± 0.11 0.83 ± 0.05 0.92 ± 0.08 0.75 ± 0.10 60 0.68 ± 0.09 0.52 ± 0.10 0.49 ± 0.13 0.63 ± 0.08 120 0.48 ± 0.12 0.49 ± 0.07 0.45 ± 0.12 0.68 ± 0.14 180 0.52 ± 0.08 0.49 ± 0.10 0.39 ± 0.10 0.71 ± 0.15 300 0.41 ± 0.06 0.48 ± 0.15 0.52 ± 0.11 0.65 ± 0.13
The trends observed in this case were drastically different from that found for Fe(CN)63-. In
particular, no important difference was noticed at a given time between the three different substituents, namely NO2, NHOH and NH2, thus suggesting that the nature of these latter was almost without effect
on the value of the β/βGC ratio. This is consistent with the fact that Ru(NH3)63+ reduction proceeds via
an outer-sphere mechanism, which makes it much less sensitive to surface modification than Fe(CN)6
3-. However, and independently on its own nature, the presence of the substituent in the layer has an influence on the β/βGC ratio. This can be seen by comparing the evolution of the β/βGC ratio for any of
the three substituents to that recorded on GC-Ph, which was barely constant whatever the grafting time: at short grafting time, i.e. up to 30 s, the β/βGC ratio were higher for substituted films compared to the
unsubstituted one, whereas at grafting time longer than 30 s the trend was reversed. Thus, for short grafting times, which produce submonolayer films, steric hindrance induced by the presence of the substituent seems to be overriding compared to any other effect, considering aromatics bearing substituents lead to less dense, and consequently less blocking films than unsubstituted moieties. For grafting time longer than 30 s, all three substituents clearly exhibit a negative effect on the β/βGC ratio.
Once again, this effect seemed to be independent on their own nature since at a given time, the obtained values were comparable whatever the substituent. Thus, the cationic nature of the hydroxylamino and amino groups at pH 3.5 cannot be invoked to explain such a trend, or at least, it does not afford the main contribution to the whole effect.
Finally, a third redox probe was studied, namely ferrocenemethanol FcMeOH, which reduces via an outer-sphere process and is a neutral compound. It may thus be assumed to remain unaffected by electrostatic effects. The results corresponding to this latter probe are depicted on Figure 8C and Table 3.
For all four interfaces, a comparable trend was observed with a strong decrease in the α/αGC ratio
for grafting times up to 30 s and then, no further evolution of this latter values was noticed for grafting time longer than 30 s. This result which shows that for this electrostatic-free probe the functionalized interfaces undergo the “classical” barrier effects supports well the hypothesis of electrostatic effects in
the case of positively or negatively charged redox probe such as hexammineruthenium(III) and ferricyanide, respectively.
Table 3. Values of the anodic transfer coefficients ratio α/αGC of FcMeOH obtained by the
Koutecky-Levich and Tafel methods as a function of diazonium grafting time for different substituted or unsubstituted compounds from steady-state voltammograms recorded in 0.1 M KPF6 (pH 3.5)
containing 5 mM FcMeOH. αGC = 0.52 ± 0.05 (calculated using same methods on unmodified
GC electrode).
tgrafting (s) GC-NO2 GC-NHOH GC-NH2 GC-Ph
1 0.75 ± 0.04 0.82 ± 0.07 0.92 ± 0.04 1.00 ± 0.04 5 0.72 ± 0.08 0.81 ± 0.08 0.90 ± 0.02 0.95 ± 0.06 10 0.73 ± 0.09 0.63 ± 0.05 0.77 ± 0.10 0.86 ± 0.05 30 0.64 ± 0.10 0.66 ± 0.06 0.63 ± 0.06 0.71 ± 0.08 60 0.53 ± 0.10 0.67 ± 0.03 0.59 ± 0.05 0.74 ± 0.10 120 0.55 ± 0.03 0.50 ± 0.04 0.64 ± 0.08 0.81 ± 0.09 180 0.54 ± 0.04 0.54 ± 0.04 0.62 ± 0.10 0.65 ± 0.11 300 0.56 ± 0.06 0.46 ± 0.06 0.69 ± 0.05 0.66 ± 0.10 4. CONCLUSION
The kinetics of three redox probes, namely ferricyanide, hexammineruthenium(III) and ferrocenemethanol were studied on diazonium functionalized GC electrodes bearing either NO2, NHOH
or NH2 groups or no substituent and prepared by constant potential electrolysis for duration ranging
between 1 and 300 s in order to vary films thickness. In all the cases, experimental results showed the electron transfer throughout the films to occur mainly via pinholes, except for short grafting times which correspond to submonolayer films. The substituents borne by the aromatic skeleton proved to have a strong influence on the kinetics of the redox probes by means of electrostatic effects that favor or disfavor the approach of the probes. As expected, ferricyanide, the reduction process of which is known to proceed via an inner-sphere mechanism was the most affected by substituent changes in the films. In this case and for a given grafting time, the β/βGC ratio was found to increase following the trend GC-NO2 <
GC-NHOH < GC-NH2. All these results help providing a better understanding of electron transfer
mechanism throughout diazonium insulating films.
References
1. V. M. Mirsky, TrAC, Trends Anal. Chem., 21 (2002) 439.
3. M. Xu, J. Wang and F. Zhou, Curr. Top. Electrochem., 11 (2006) 57. 4. D. Bélanger and J. Pinson, Chem. Soc. Rev., 40 (2011) 3995.
5. R. L. McCreery, Chem. Rev., 108 (2008) 2646.
6. S. Mahouche-Chergui, S. Gam-Derouich, C. Mangeney and M. M. Chehimi, Chem. Soc. Rev., 40 (2011) 4143.
7. J. T. Abrahamson, C. Song, J. H. Hu, J. M. Forman, S. G. Mahajan, N. Nair, W. Choi, E.-J. Lee and M. S. Strano, Chem. Mater., 23 (2011) 4557.
8. D. J. Bates, C. M. Elliott and A. L. Prieto, Chem. Mater., 26 (2014) 5514. 9. W. Richard, D. Evrard and P. Gros, Electroanalysis, 26 (2014) 1390.
10. J. A. Rather, A. J. Al Harthi, E. A. Khudaish, A. Qurashi, A. Munam and P. Kannan, Anal.
Methods, 8 (2016) 5690.
11. D.-J. Chung, K.-C. Kim and S.-H. Choi, Appl. Surf. Sci., 257 (2011) 9390.
12. S. M. Khor, G. Liu, J. R. Peterson, S. G. Iyengar and J. J. Gooding, Electroanalysis, 23 (2011) 1797.
13. R. T. Jane, E. Gaudemer and R. Lomoth, J. Mater. Chem. C, 3 (2015) 10023.
14. D. Evrard, F. Lambert, C. Policar, V. Balland and B. Limoges, Chem. Eur. J., 14 (2008) 9286. 15. S. Descroix, G. Hallais, C. Lagrost and J. Pinson, Electrochim. Acta, 106 (2013) 172.
16. C. Jiang, S. M. Silva, S. Fan, Y. Wu, M. T. Alam, G. Liu and J. J. Gooding, J. Electroanal.
Chem., 785 (2017) 265.
17. R. Sharma, J. H. Baik, C. J. Perera and M. S. Strano, Nano Lett., 10 (2010) 398. 18. T. Menanteau, E. Levillain and T. Breton, Langmuir, 30 (2014) 7913.
19. P. A. Brooksby and A. J. Downard, Langmuir, 21 (2005) 1672.
20. V. Vijaikanth, J.-F. Capon, F. Gloaguen, P. Schollhammer and J. Talarmin, Electrochem.
Commun., 7 (2005) 427.
21. X.-Y. Fan, R. Nouchi, L.-C. Yin and K. Tanigaki, Nanotechnology, 21 (2010) 475208/1. 22. C. Saby, B. Ortiz, G. Y. Champagne and D. Belanger, Langmuir, 13 (1997) 6805.
23. M. Delamar, G. Desarmot, O. Fagebaume, R. Hitmi, J. Pinson and J. M. Saveant, Carbon, 35 (1997) 801.
24. A. J. Downard, Langmuir, 16 (2000) 9680.
25. P. A. Brooksby and A. J. Downard, Langmuir, 20 (2004) 5038. 26. J. Pinson and F. Podvorica, Chem. Soc. Rev., 34 (2005) 429.
27. J. Haccoun, C. Vautrin-Ul, A. Chausse and A. Adenier, Prog. Org. Coat., 63 (2008) 18. 28. W. Richard, D. Evrard and P. Gros, J. Electroanal. Chem., 685 (2012) 109.
29. K. K. Cline, L. Baxter, D. Lockwood, R. Saylor and A. Stalzer, J. Electroanal. Chem., 633 (2009) 283.
30. P. Allongue, M. Delamar, B. Desbat, O. Fagebaume, R. Hitmi, J. Pinson and J.-M. Saveant, J.
Am. Chem. Soc., 119 (1997) 201.
31. W. Richard, D. Evrard, B. Busson, C. Humbert, L. Dalstein, A. Tadjeddine and P. Gros,
Electrochim. Acta, 283 (2018) 1640.
32. M. Ceccato, L. T. Nielsen, J. Iruthayaraj, M. Hinge, S. U. Pedersen and K. Daasbjerg,
Langmuir, 26 (2010) 10812.
33. A. J. Downard and M. J. Prince, Langmuir, 17 (2001) 5581.
34. E. Gervais, Y. Aceta, P. Gros and D. Evrard, Electrochim. Acta, 261 (2018) 346. 35. S. Baranton and D. Belanger, J. Phys. Chem. B, 109 (2005) 24401.
36. S. S. C. Yu and A. J. Downard, e-J. Surf. Sci. Nanotech., 3 (2005) 294.
37. A. Omrani, A. A. Rostami, N. Yazdizadeh and M. Khoshroo, Chem. Phys. Lett., 539-540 (2012) 107.
38. V. Branzoi, F. Branzoi, M. Raicopol and L. Pilan, Rev. Chim., 62 (2011) 436. 39. P. Chen and R. L. McCreery, Anal. Chem., 68 (1996) 3958.
41. A. Badia, R. Back and R. B. Lennox, Angew. Chem. Int. Ed., 33 (1994) 2332. 42. J. Koutecky, Chem. Listy Vedu Prum., 47 (1953) 1758.