OATAO is an open access repository that collects the work of Toulouse
researchers and makes it freely available over the web where possible
This is an author’s version published in:
http://oatao.univ-toulouse.fr/23982
Any correspondence concerning this service should be sent
to the repository administrator:
[email protected]
To cite this version:
Fu, Qinjun and Bestion, Dominique and Fillion, Philippe and Davit, Yohan and
Quintard, Michel Analysis of flow in rod bundles with velocity and temperature
radial dissymmetry using CATHARE-3. In: ICAPP 2019 - International Congress
on Advances in Nuclear Power Plants, 12-15 May 2019 (Juan-les-Pins, France)
Analysis of flow in rod bundles with velocity and temperature
radial dissymmetry using CATHARE-3
Q. FU 1,2*, D. Bestion1, P. Fillion1, Y. Davit2, M. Quintard2 1 CEA, DEN, STMF, Université Paris-Saclay, F-91191, Gif sur Yvette, France
2 Institut de Mécanique des Fluides de Toulouse (IMFT), Université de Toulouse, 31400, Toulouse, France
* Corresponding Author, E-mail: [email protected]
CATHARE is a 2-fluid thermal-hydraulic system code, capable of simulating phenomena occurring in the primary and secondary circuits of a PWR (Pressurized Water Reactor) under a wide variety of accidental situations. The latest version CATHARE-3 uses a 3D modeling of a PWR core at the assembly scale to simulate various accidental situations such as the loss of coolant accident (LOCA) or the steam line break accident. This requires that the one-phase and two-phase mixing models are adapted to the assembly scale and that every closure law is validated in a separate way. The code models for the 3D turbulent diffusion and dispersion of momentum and energy have been validated at sub-channel scale against experimental data. In this work, the energy and mo-mentum mixing models are validated at assembly scale with the PNNL and the Weiss tests exper-imental results, respectively.
KEYWORDS:3D modeling in porous medium approach, PWR, Turbulent diffusion, Upscaling
Introduction
In the CATHARE code, the mass, momentum and energy conservation equations are written for each phase in a 3D porous medium approach as a result of a double time and space averaging that requires modelling all the effects of the solid structures (fuel rod, mixing grid…) [1]. Three mixing terms appear in the equations which are modeled in the CATHARE code: 1) the momentum turbulent diffusion and dispersion; 2) the energy turbulent diffusion and dispersion, 3) the dispersion of void fraction, which is an interfacial force in the momentum balance equations [1]. Series of validation works were performed to assess the capabilities of these three mixing models at the sub-channel scale. The turbulent diffusive and dispersive effects showed important influence on radial transfers of mass, momentum and energy at this scale as expected [2] [3] [4]. Therefore, they must be taken into account. But the sub-channel scale simulation is still too expensive and the mixing models have to be evaluated at assembly scale. The validation of the energy diffusion-dispersion model is performed against the PNNL 2×6 rod bundle flow test [5] [6]. In this test, the 6 left rods and the 6 right rods have different power profiles. Tests are carried out at low velocities, involving natural convection and forced mixing convection. The power dis-symmetry causes transverse velocities due to the buoyancy effect, which can be used to validate the code models by comparing predicted and measured velocities and temperature radial profiles at differ-ent elevations of the test section. Weiss et al. [7] performed experimdiffer-ental tests in a two-assembly test section, consisting of two 14×14 square lattice rod bundles with non-heated rods. Unbalanced velocities at the inlet assemblies create cross-flows. The axial velocity and pressure were measured at different levels and positions, allowing us to validate the expressions of friction terms and the momentum turbu-lent diffusion and dispersion terms.
In this paper, the influence of energy mixing model is first studied on PWR Sub-channel and Bundle Tests (PSBT) [8] at sub-channel scale. Second, the separate influence of the energy and momentum mixing models in tests PNNL and Weiss is analyzed by running the same numerical test with different models. Then these two tests series are simulated at both channel scale, i.e. one mesh per sub-channel, and at assembly scale, i.e. one mesh represents a larger zone including several identical rods. The different simulation results are compared with experimental data.
Equations in CATHARE
In CATHARE, the system of equations reads [4] [8]:
∂𝜙𝛼𝑘𝜌𝑘
𝛼𝑘𝜌𝑘(∂𝐕∂𝑡𝐤+ 𝐕𝐤∇ ∙ 𝐕𝐤) + 𝛼𝑘∇𝑃 = (𝑝𝑖+ 𝑓𝑖𝑇𝐷)∇𝛼𝑘∓ 𝛕𝐢+ 𝛼𝑘𝜌𝑘𝐠 + 𝛕𝐰𝐤+𝜙1(𝛼𝑘𝜌𝑘𝛕𝐤𝐭+𝐝) (2) ∂𝜙𝛼𝑘𝜌𝑘𝑒𝑘
∂𝑡 + ∇ ∙ (𝜙𝛼𝑘𝜌𝑘ℎ𝑘𝐕𝐤) = 𝜙𝑞𝑘𝑖+ 𝑆𝑐𝑞𝑤𝑘+ 𝜙Γ𝑘ℎ𝑘+ ∇ ∙ (𝛼𝑘𝐪𝐤
𝐭+𝐝) (3)
where, αk, ρk, 𝐕𝐤, ek, hk are the volume fraction, the density, the intrinsic velocity, the specific internal
energy and the specific enthalpy for the phase k, ϕ is the porosity, P the intrinsic pressure, Γk the
inter-facial mass exchange. pi and fiTD are void dispersion terms due to space averaging of interfacial
pres-sure force and time averaging of drag and added mass force. 𝛕𝐢 is the interfacial friction force, 𝛕𝐰𝐤 the
wall friction force, qki the interface to phase k heat transfer and qwkthe wall to phase k heat transfer, Sc
the heating surface, 𝛕𝐤𝐭+𝐝 the stress tensor which accounts for turbulent and dispersive effects, and 𝐪𝐤𝐭+𝐝
the turbulent and dispersive heat flux.
The previous equations are obtained by double averaging (in time and space) the local mass, momen-tum and energy conservation equations. The momenmomen-tum and energy diffusive and dispersive terms are introduced from this step, by double averaging the local convection terms:
〈vv̅̅̅〉f= 〈v̅〉f〈v̅〉f+ 〈v′v′̅̅̅̅̅〉f+ 〈δv̅̅̅ δv̅̅̅〉f (4)
〈vh̅̅̅〉f= 〈v̅〉f〈h̅〉f+ 〈v̅̅̅̅̅〉′h′f+ 〈δv̅̅̅ δh̅̅̅〉f (5)
where x̅ is the time average of quantity x and x′ the deviation from this average, and 〈x〉f is the spatial
average of the quantity x and δx the deviation from this average. In the right-hand side of equations (4) and (5), the first terms are the macroscopic convection of the mean velocity and enthalpy, the second terms are the turbulent diffusion of momentum and energy, and the third terms are the momentum and energy dispersion.
The turbulent diffusion and dispersion tensor of momentum was modeled following the concept of mi-croscopic eddy-diffusivity concept [8] [9]:
𝛕𝐤𝐭+𝐝= (𝜈𝑡𝑘𝜙 + 𝜈𝑑𝑘𝜙) [∇(𝜙𝐕𝐤) + ∇𝑇(𝜙𝐕𝐤) −23∇ ⋅ (𝜙𝐕𝐤)𝐈] (6)
In 2009, Teruel [10] gave an algebraic relation for the dispersive coefficients:
(𝜈𝑡𝑘𝜙+𝜈𝑑𝑘𝜙) 𝐷ℎ|𝐕𝐤| = 𝐶𝜇[( 120 𝐶𝐷 √1−𝜙+𝜙−1 𝜙4 ( √1−𝜙 𝑅𝑒 + 1 60)) 4 3⁄ 𝜙4 120√1−𝜙( √1−𝜙 𝑅𝑒 + 1 60) −1 ] (7) where 𝐶𝜇= 0.09, 𝐶𝐷 is a geometry dependent parameter equal to1.4, and Re is the Reynolds number
based on the hydraulic diameter. The dispersion coefficient is 2 to 3 magnitudes higher than the diffusion coefficient.
In 2011, M. Valette [3] proposed a semi-empirical relation for the turbulent diffusion and dispersion co-efficient, established for rod bundle with PWR type geometries:
𝐪𝐤𝐭+𝐝= (𝛼𝑡𝑘𝜙𝐈 + 𝐃𝐝𝐤𝛟 )𝜙∇𝑒𝑘 (8)
𝐷𝑑𝜙𝑡=𝐴√〈𝑘〉𝑓𝐷ℎ
𝑃𝑟𝑡𝜙 (9)
where 〈𝑘〉𝑓 is the spatial averaged turbulent kinetic energy far away from spacer grid. 𝐷𝑑 𝜙𝑡
is the trans-verse component of the thermal dispersive tensor 𝐃𝐝𝐤𝛟 , thus the dissymmetry of grid (different direction of mixing vanes) cannot be described in this model. The PSBT experiment therefore leads to a temper-ature map that is dissymmetric, whereas it is always symmetric in the simulation. A is a geometry de-pendent parameter, which is adjusted to a value of 0.5 for the PSBT benchmark by Valette, and the turbulent Prandlt number is 𝑃𝑟𝑡= 1.
Correlation of A and the Reynolds number
T
he PWR sub-channel and bundle tests (PSBT) benchmark includes runs in a 5 by 5 rod bundle with a radial power profile [8]. These tests were used to investigate the radial temperature mixing in the fluid (see Figure 1). Tests are for a single-phase liquid and, even if small crossflows may be expected due to radial gradients of axial velocity resulting from radial gradients of density, the radial diffusion and dispersion of energy is likely to play a dominant role in the radial mixing. In Valette’s dataset, the value of A is 0.5 for all 59 tests, which have different rod power, inlet temperature, mass flux and pressure.In PSBT tests, the mixing vane grids cause dissymmetric radial flows. Consequently, dissymmetric ra-dial temperature maps appear even in the North-South direction. An analysis of this dissymmetry has been carried out in Hwang et al. [11]. Thus, the experimental temperature peak observedat the lateral location ~ 0.15 m (second sub-channel from left) for test 01-2131 could be related to the dissymmetric flow caused by the mixing vanes. In addition, the mixing levels are different in different tests. As shown in Figure 2, the temperature curve is smoother in test 01-5237 than in test 01-3231. Therefore, simula-tions under different values of A were performed to analyze the effect of coefficient A. The comparison against the experimental data of radial temperature profiles for two runs with different Reynolds numbers obtained with this correlation was shown in Figure 2. For run 01-5237, at high Reynolds number (440,000), a value of A around 0.5 gives the best results. At moderate Reynolds number (34,000), the coefficient was reduced to around 0.3 to fit the experiment. In a recent work [12], the simulation was repeated with A being adjusted for each test by minimizing the relative error of temperature at the third column of rod bundle (see Figure 3). Then A was modeled as a function of the Reynolds number:
𝐴 = 0.1039𝑅𝑒0.123 (10)
Figure 3: The optimal value of A for PSBT tests with different Reynolds number.
The PNNL test
The Pacific Northwest National Laboratory carried out the PNNL 2 × 6 test in 1977 for investigating the Figure 2: Simulation results under different coefficient A
for tests of different Reynolds number. Figure 1: Mixing vane and cross section of
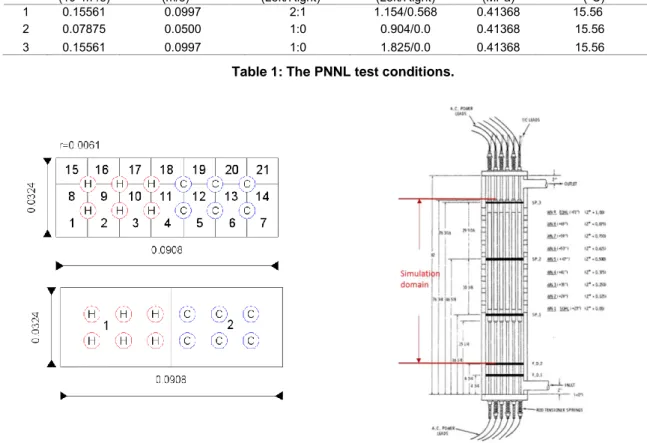
buoyancy effect on flow distributions [5]. The three left columns of rods and the three right columns of rods have different power creating a radial power profile as shown in Table 1. Nine windows were lo-cated along the test section (total height: 1.778 m) where velocity and temperature in the sub-channels 8 to 14 (Fig. 4 and Fig. 5) were measured. In the performed three tests, the Reynolds number is around 1000-2000. The test conditions are shown in Table 1. In such conditions, buoyancy driven crossflows are expected together with diffusion and dispersion effects.
Case Mass flux
(10-3m3/s) Inlet velocity (m/s) Power Skew (-) (Left/Right) Rod power (kW) (Left/Right) Pressure (MPa) Inlet temperature (°C)
1 0.15561 0.0997 2:1 1.154/0.568 0.41368 15.56 2 0.07875 0.0500 1:0 0.904/0.0 0.41368 15.56 3 0.15561 0.0997 1:0 1.825/0.0 0.41368 15.56
Table 1: The PNNL test conditions.
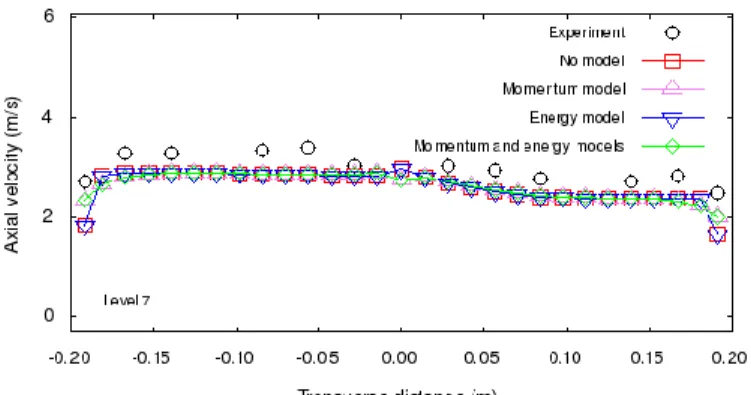
Figure 4: Bundle cross section and simulation mesh: Figure 5: Rod bundle assembly and flow Housing sub-channel scale (top) and assembly scale (bottom). (scanned from report of Quigley [5]). Since the momentum and energy mixing models have to be evaluated separately, four tests employing different model combinations (one with both momentum and energy models, one with energy model, one with momentum model and one with no model) were run under the same conditions. The influence of the momentum mixing model and the energy mixing model could be qualitatively compared through the liquid temperature at different windows against the experimental results (Fig. 6). It was shown that the momentum mixing model has almost zero impact on the temperature distribution. Therefore, the PNNL test could be used to calibrate the energy mixing model if the impact of gravity driven crossflow is not dominant.
The sensitivity to the coefficient A in this test was also analyzed as in the previous section for PSBT test. The value of A calculated by equation (10) is 0.24 with a Reynolds number around 1000 corre-sponding the flow conditions of PNNL test 2. In this test, the optimal value of A was found to be much lower to give the best result (Fig. 7). In the later test, the value of A was fixed to 0.01. This confirms the results of Chandesris et al. [1] obtained during the simulation of single-phase runs performed in the OMEGA-2 loop, consisting of a 5×5 rod bundle without mixing vane grids, where the coefficient A had to be be divided by a factor between 30-70 with respect to the value of 0.5 obtained for PSBT tests to well capture the temperature map.
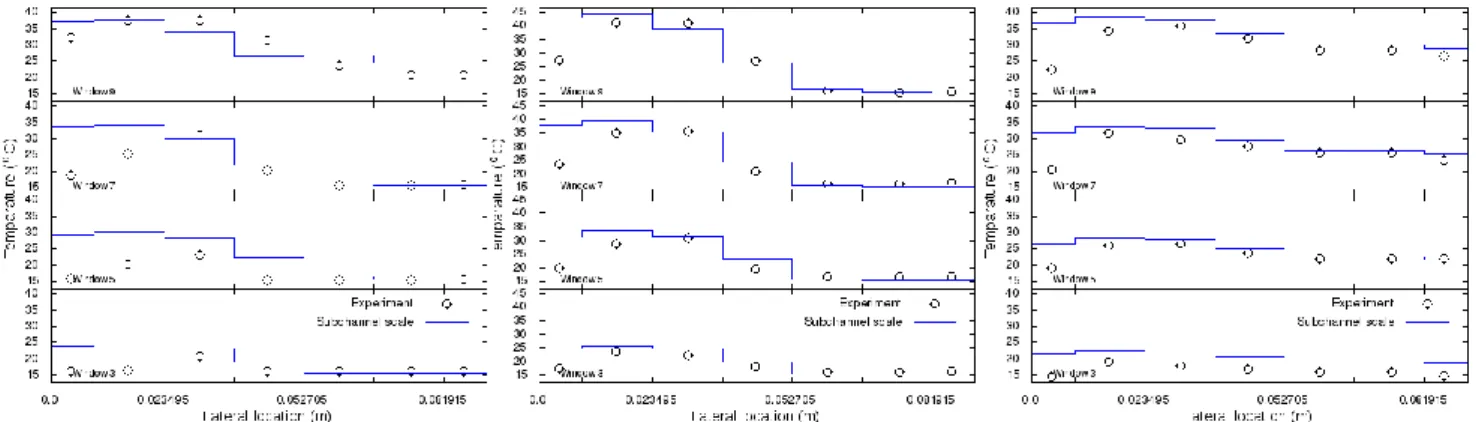
In the sub-channel scale simulation, one mesh represents one sub-channel (Fig. 4 top). Here the as-sembly scale corresponds to half of the whole test section since the test section was divided into 2 identical meshes (Fig. 4 bottom). Firstly, the sub-channel scale simulation results of three tests were compared against the experimental results (Fig. 8).
Figure 8: Sub-channel scale simulation results of Test 1, 2, 3 (left to right).
The sub-channel scale simulation results of CATHARE agree generally rather well with the experimental results, except at sub-channel 8. In the experimental result of test 1, the liquid temperature at the first left point, where the rods have higher power, is colder than the right first point, where the rod power is lower. As mentioned in the report of Quigley [5], the measurement error reaches 15%. This deviation will not be discussed here. As noticed in [13], one also should be aware that the experimental results are measured at the center of the sub-channel, where the liquid temperature should be lowest. However, the simulation results corresponds to the average value within the sub-channel, which means the sim-ulation results should be systematically a little higher than the experimental results.
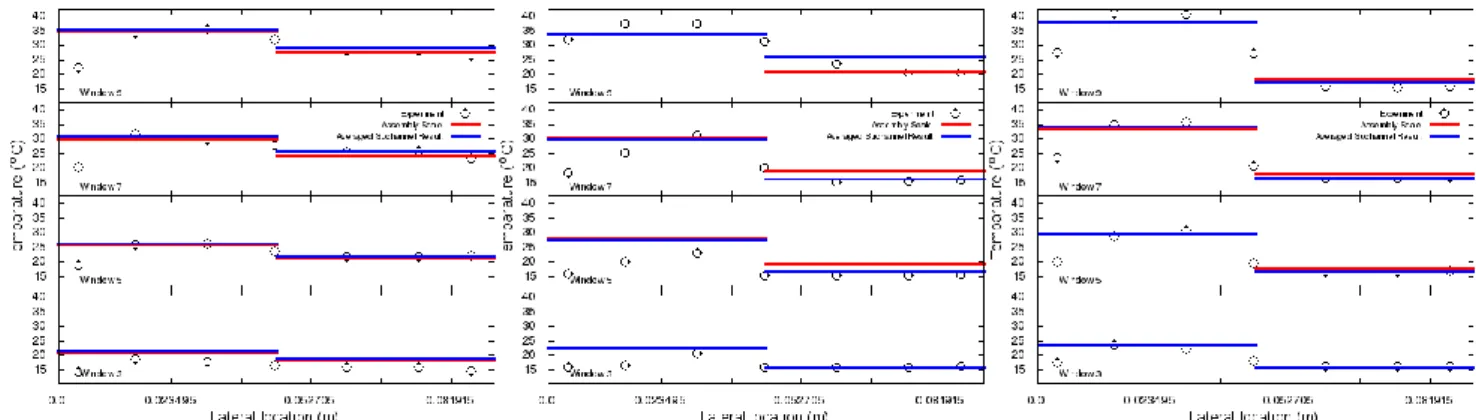
Because we only have experimental result for the central row, it is impossible to calculate the average temperature of an assembly. Thus, the assembly scale simulation results are compared against the surface average results of sub-channel scale simulation and the local measured values (Fig. 9). In this figure, the red line represents the results calculated at assembly scale, and the blue line is the surface average value of sub-channel scale results. In general, the assembly scale simulation result is accepta-ble comparing to the surface average value of sub-channel scale simulation result. In addition, the left part of test section always has a better match with surface average value of sub-channel scale simula-tion result, especially for Test 2, which means that the simulasimula-tion scale does have an influence on the result, or we can say the energy mixing model should be scale-dependent.
Figure 6: Separate influence of momentum and en-ergy mixing models in Test 1.
Figure 7: Results with different values of coeffi-cient A in Test 2.
Figure 9: Assembly scale simulation results compared against surface average value of sub-channel scale simulation result of Test 1, 2, 3 (left to right).
The Weiss test
Weiss et al. [2] performed experimental tests in a two-assembly test section, consisting of two 14x14 square lattice rod bundles with non-heated rods (Fig. 10). The rod diameter is 1.08 cm and the pitch/di-ameter ratio is 1.28. Unbalanced velocities at the inlet assemblies create cross-flows. In the experiment, inlet mass flow rates at left and right bundles were 1100 and 550 gpm (0.0833 and 0.0417 m3/s). In our simulation, the inlet velocity at left and right are 3.52 and 1.76 m/s, and for the water gap, an averaged liquid velocity 2.64 m/s was set, as in [13]. Such test conditions are expected to produce friction driven crossflows with influence of momentum diffusion-dispersion. The axial velocity and pressure were meas-ured at different levels and positions, allowing us to validate the expressions of friction terms and the momentum turbulent diffusion and dispersion terms.
Figure 10: Test assembly and cross section of assembly (scanned from the report of Weiss [7]). For the sake of CPU time saving, only the central row of sub-channel zones is considered in the com-putation. First, the separate influence of energy and momentum mixing models was studied. Four cal-culations employing different models were run with CATHARE under the same conditions and the ve-locity at level 7 were compared (Fig. 11, A=0.5 in tests employed energy mixing model). It was found that in this test, the energy mixing model showed no influence, as expected without rod heating. The impact of momentum model was also very weak, except at the near boundary zone and the central sub-channel, where the porosities are changed.
Then the simulation was performed at sub-channel scale. The trend of mixing between left and right bundle was well predicted by CATHARE, the left-right discrepancy of liquid velocity decreased with
elevation.
Figure 11: Influence of momentum and energy mixing models on Weiss test.
In the assembly scale simulation, the left and right bundle are represented by two identical meshes. They have the same size, porosity, hydraulic diameter and all other geometry properties. This result was then compared against the surface average value of sub-channel scale simulation result. They have very close values, which means that the influence of the mesh scale in this test is weak. As only the momentum mixing model works in this test, the momentum mixing model is not sensitive to the scale of simulation. But as mentioned above, the impact of momentum mixing model is not distinct in this test, we cannot say that the momentum mixing model is always scale-independent. We need more tests with different parameters to confirm it. Sensitivity to pressure loss coefficient for crossflow is necessary to complement the analysis.
Figure 12: Sub-channel scale and assembly scale simulation results of the Weiss test.
Conclusion
The energy mixing model of Valette [2] was improved by a correlation of optimal value of parameter A and the Reynolds number with PSBT benchmark results. The capability of this correlation was proved in the PNNL test. The separate influence of energy and momentum mixing models in the PNNL test and the Weiss test were compared. As expected, it was found that in the PNNL tests, with a radial gradient of temperature due a power radial profile, the dominant term is the diffusion and dispersion of energy,
and the momentum mixing term in the Weiss tests, in non-heating conditions and with an unbalanced velocity at the inlet of the assemblies. The same sensitivity of parameter A was found in the PNNL test. The difference of simulation results of the PNNL test at sub-channel scale and assembly scale proved the scale-dependence of the dispersion and diffusion model of energy. In the Weiss, this difference is very weak, more test with different test conditions are needed to complement the scale-dependence assumption of the dispersion and diffusion model of momentum.
In the future work, the correlation of parameter A and the Reynolds number should be validated with more variety of test conditions. More experimental results of test with different conditions are needed for the quantitative study of the scale-dependence of momentum and energy mixing models. An upscal-ing method can be used to propose the theoretical assembly scale models, from the sub-channel ones.
Acknowledgment
This work was made in CEA Saclay in the frame of CATHARE code development.
References
1) Chandesris, M., et al. "Rod bundle thermalhydraulics mixing phenomena: 3D analysis with CATHARE 3 of various experiments." Proceedings of the 15th International Topical Meeting on Nuclear Reactor Thermal-hy-draulics (NURETH15), Pisa, Italy. 2013.
2) Valette, M. "Analysis of subchannel and rod bundle PSBT experiments with CATHARE 3." Science and Tech-nology of Nuclear Installations 2012 (2012).
3) Valette, M. "Subchannel and rod bundle PSBT simulations with CATHARE 3." (2011).
4) Bestion, D., Fillion, P., Préa, R., and Bernard-Michel, B. "Improved PWR LOCA simulations through refined core 3D simulations-an advanced 3D modeling and associated METERO validation program" NUTHOS-12, 2018. 5) Quigley, M. S., C. A. McMonagle, and J. M. Bates. Investigation of combined free and forced convection in a
2 x 6 rod bundle. No. BNWL--2216. Battelle Pacific Northwest Labs., 1977.
6) Bates, J. M., and E. U. Khan. Investigation of combined free and forced convection in a 2 x 6 rod bundle during controlled flow transients. No. PNL--3135. Battelle Pacific Northwest Labs., 1980.
7) Weiss, E., R. A. Markley, and A. Battacharyya. "Open duct cooling-concept for the radial blanket region of a fast breeder reactor." Nuclear Engineering and Design 16.4 (1971): 375-386.
8) OECD/NRC Benchmark Based on NUPEC PWR Sub-channel and Bundle Test (PSBT), Nuclear Science, NEA/NSC/DOC (2012)1, (2012).
9) Chandesris, M., G. Serre, and P. Sagaut. "A macroscopic turbulence model for flow in porous media suited for channel, pipe and rod bundle flows." International journal of heat and mass transfer 49.15-16 (2006): 2739-2750.
10) Teruel, Federico E. "A new turbulence model for porous media flows. Part I: Constitutive equations and model closure." International Journal of Heat and Mass Transfer 52.19-20 (2009): 4264-4272.
11)Hwang, D-H., S. J. Kim, and K-W. Seo. "Analysis of PSBT benchmark exercises for void distribution and DNB using a subchannel code MATRA." (2011).
12) Q. Fu, D. Bestion, P. Fillion, M. Quintard and Y. Davit, “Assessing the accuracy of energy turbulent diffusion dispersion correlation in a porous two-fluid model dedicated to PWR core simulations”, 14èmes Journées d’Études des Milieux Poreux - JEMP 2018, Nantes, France (2018).
13) S. J. Yoon, S. B. Kim, G. C. Park, H. Y. Yoon, H. K. Cho, “Application of CUPID for subchannel-scale thermale-hydraulic analysis of pressurized water reactor core under single-phase conditions”, Nuclear Engineering and Technology, 50, pp. 54-67 (2018).