O
pen
A
rchive
T
OULOUSE
A
rchive
O
uverte (
OATAO
)
OATAO is an open access repository that collects the work of Toulouse researchers and
makes it freely available over the web where possible.
This is an author-deposited version published in :
http://oatao.univ-toulouse.fr/
Eprints ID : 16805
To link to this article : DOI : 10.1149/2.0151505jes
URL :
http://dx.doi.org/10.1149/2.0151505jes
To cite this version :
Péan, Clarisse and Daffos, Barbara and Merlet,
Céline and Rotenberg, Benjamin and Taberna, Pierre-Louis and
Simon, Patrice and Salanne, Mathieu Single Electrode Capacitances
of Porous Carbons in Neat Ionic Liquid Electrolyte at 100 C: A
Combined Experimental and Modeling Approach. (2015) Journal of
The Electrochemical Society (JES), vol. 162 (n° 5). pp.
A5091-A5095. ISSN 0013-4651
Any correspondence concerning this service should be sent to the repository
administrator:
[email protected]
Single Electrode Capacitances of Porous Carbons in Neat Ionic
Liquid Electrolyte at 100
◦C: A Combined Experimental
and Modeling Approach
C. Pean,a,b,cB. Daffos,a,bC. Merlet,b,cB. Rotenberg,b,cP.-L. Taberna,a,bP. Simon,a,b,∗
and M. Salanneb,c,z
aLaboratoire CIRIMAT, UMR CNRS 5085, Universit´e Paul Sabatier Toulouse III, F-31062 Toulouse, France bR´eseau sur le Stockage Electrochimique de l’Energie (RS2E), FR CNRS 3459, 80039 Amiens Cedex, France cSorbonne Universit´es, UPMC Universit´e Paris 06, UMR 8234, PHENIX, F-75005 Paris, France
Supercapacitors are promising devices for energy storage. Being able to measure and predict their performances is a key step in order to optimize them. In the present study, we propose an original methodology to calculate the capacitance of a single nanoporous carbon electrode in contact with an ionic liquid, using molecular dynamics simulations. The results are compared to experimental electrochemical measurements conducted on the same systems at high temperature (close to 100◦C). The two approaches are in
qualitative agreement and show that, in the case of a butyl-methylimidazolium hexafluorophosphate electrolyte combined with a carbide-derived carbon with an average pore size of 0.9 nm, the positive electrode capacitance is fairly larger than the negative one.
DOI:10.1149/2.0151505jes
Electrochemical Capacitors (ECs), also known as supercapacitors1
are now mature enough - in terms of power and energy density - to complement or even replace batteries in various applications rang-ing from power electronics to automotive industry (electric and
hy-brid electric vehicles, boats, trams. . . ).2The fast development of this
technology was facilitated by key scientific breakthroughs over the past few years, such as the discovery of capacitance increase in
sub-nanometer pores3–5or the evidence of the influence of the
nanostruc-ture and crystal strucnanostruc-ture of the materials on the pseudo-capacitive
behavior.6–9The development of in-situ spectroscopies10–12and
Elec-trochemical Quartz Crystal Microbalance (EQCM)13,14 techniques
have recently allowed the measurement of ion fluxes through mi-cropores. In addition, the demonstration that ions could access pores
of their size in solvent-free electrolytes1,4has attracted the attention
of the modeling community. Many theoretical and simulation works have then been devoted to the characterization of the porous carbon
/ electrolyte interface.15–18In particular, using realistic carbon
struc-tures (Carbide Derived Carbons with various pore sizes) in molecular dynamics simulations, it was shown that the capacitance increase in carbon nanopore electrodes with ionic liquid electrolytes is linked to the breaking of the multilayer ion structuration of the adsorbed fluid and to the high confinement enabled in the disordered structure of
the pores.19,20Unlike planar surfaces of carbon graphite, nanoporous
carbons cancel out the charge overscreening effect.21As a result,
car-bon atoms forming highly confined sites can store on average a larger
charge than carbon at the surface of larger pores.20
These results demonstrate the great opportunities offered by molecular simulations to complement the knowledge on supercapac-itors. However, no quantitative comparison between experiments and simulations could be made so far in the case of nanoporous carbons, mainly because of temperature limitations. Indeed, ionic liquids are very viscous and simulating them at room temperature requires sim-ulation times that would be too large, even using High Performance
Computers. Therefore, elevated temperatures (more than 100◦C) are
necessary in simulations to enhance the ion mobility and
conduc-tivity, thereby decreasing the equilibration time,22whereas
electro-chemical experiments, for practical reasons, are usually performed at
temperatures below 100◦C. A more fundamental difficulty that hinders
quantitative comparison is the fact that in molecular dynamics, when nanoporous carbon electrodes are simulated, it is difficult to identify
∗Electrochemical Society Active Member. zE-mail:[email protected]
the contribution of each electrode to the total capacitance. Here we propose a simulation methodology that overcomes this limitation.
For supercapacitors made with two planar graphene (or graphite) electrodes located at the two extremities the simulation cell (along an
arbitrary axis z), already largely studied in literature,23,24it is possible
to calculate the electrostatic potential along the z direction, taking into
account the charge distribution, thanks to the Poisson equation:25
ψ(z) = ψq(z0) − 1 ε0 Z z z0 dz′ Z z0 dz′′ ρq(z′′) [1]
where z0 is a reference point inside the left graphite electrode,
ψq(z0) = ψ+ and ρq(z) is the density of charges along the cell,
including both electrode atoms and charges on the sites of the ionic
liquid molecules. A typical profile is shown on Figure1. When the
Poisson potential reaches a plateau far from the surfaces, the
corre-sponding value provides the potential of the bulk electrolyte ψbulk.
Experimentally, this can be seen as a reference electrode, so that in
the following we will note ψbulk=
ψref.
In contrast, in a supercapacitor composed of two disordered porous electrodes such as Carbide derived Carbons (CDCs), the electrostatic
potential across the cell cannot be computed from Equation1due to
the lack of symmetry (no translation invariance along the x and y axes) and because of the heterogeneity of the system (there are ions inside the porous electrodes). There is no reference anymore and only the total capacitance can be obtained.
In this work, we introduce a “hybrid” system consisting of one graphite electrode, which allows for the calculation of the poten-tial in the bulk electrolyte, and one CDC electrode that we want to characterize. We can impose either a positive polarization or a neg-ative voltage to this electrode. This original setup therefore allows us to calculate single electrode capacitances from molecular dynam-ics simulations. Knowing an individual capacitance can then improve our knowledge on the specific interactions between a given counter-ion and the electrode, and thus reveal the compositcounter-ion of an ideal electrolyte where we would have the most efficient anion and cation pair among all anions and cations tested individually. In parallel of these simulations, electrochemical characterizations (cyclic voltam-metry, impedance spectroscopy) of porous CDCs are recorded in 3-electrode cells in neat 1-butyl-3-methylimidazolium
hexafluorophos-phate ([C4mim][PF6]) ionic liquid at 100◦C. The two techniques are
used at very close temperatures, so that a direct reliable comparison is relevant.
Figure 1. Typical electrostatic potential along the z-axis calculated between two planar surfaces (for example graphite electrodes) separated by an elec-trolyte. The left electrode is at 1 V, whereas the right electrode is at −1 V, leading to a potential difference of 2 V between electrodes. When the poten-tial reaches a plateau far from the surfaces, the corresponding value provides the potential of the bulk electrolyte ψbulk, which can be seen as a reference
electrode. The potential drops at each electrode 1ψ+and 1ψ−are also shown.
Methods
Hybrid supercapacitor simulation cell.—We design a new
simu-lation setup, starting from a previously used simusimu-lation cell19
consist-ing of the [C4mim][PF6] ionic liquid (600 ion pairs) surrounded by
two identical and symmetric complex nanoporous carbon electrodes (CDC with an average pore size of 0.9 nm, 3649 carbon atoms for each electrode). This carbon structure was obtained by Palmer et al.
using quenched molecular dynamics.26 The amount of ion pairs is
sufficient to ensure that the electrolyte in the center of the simulation cell has the structure of the bulk ionic liquid.
The hybrid system is built by replacing the left electrode of the full CDC supercapacitor by a planar graphitic electrode composed of
three graphene sheets, each made of 700 carbon atoms (see Figure2).
Two-dimensional periodic boundary conditions are used, i.e. there is no periodicity in the z direction. The dimensions of the simulation cell
are then Lx=Ly=4.37 nm, and the size of the cell in the z direction
is adjusted to obtain the correct experimental density in the bulk (1.28
g cm−3at 400 K27), yielding L
z=15.4 nm.
Simulation details.—Following our previous works,19,25,28 we used for the ionic liquid the coarse-grained model of Roy and Maron-celli, in which 3 and 1 interaction sites respectively describe the cation
and the anion.27This model has already been validated for structural,
thermodynamic and dynamic properties of [C4mim][PF6]. The forces
are calculated as the sum of Lennard-Jones and Coulombic interac-tions. In all the simulations, the Coulombic interactions are calculated
through a two-dimensional Ewald summation.29,30 The simulation
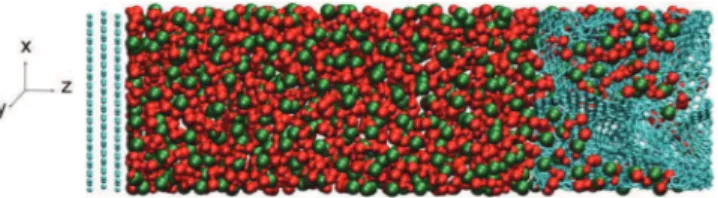
Figure 2. Instantaneous snapshot of the simulation cell used in this work (turquoise: C atoms, green: PF6− anions, red: C4mim+ cations). The left
electrode is made of graphitic planes while the right electrode has the structure of a carbide-derived carbon. The density of the ionic liquid in the middle of the cell is equal to its bulk value.
technique is Molecular Dynamics, which consists in determining the trajectories of the molecules over time by iterative integration of New-ton’s equation of motion. This was performed in the NVE ensemble with a time step of 2 fs, consistently with the use of a coarse-grained model.
The final hybrid system was equilibrated at a temperature of 400 K with constant null charges on the carbon atoms during 200 ps, then with a 0 V constant potential difference between the two elec-trodes during 100 ps. This temperature was chosen in order to enable
comparison with our previous work.19 We checked that the system
reached equilibrium by verifying that the number of ions inside the porous electrode does not vary anymore (fluctuations of +/−2 ions are observed along the trajectory, consistently with the size of the system). To initiate the charging of the hybrid supercapacitor, based
on the results obtained for simulations with two CDC electrodes,19we
assigned a fix charge of +0.01 e to each carbon atom of the porous electrode, during 100 ps, rescaling the velocities every 50 steps. On the graphite electrode, the charge is distributed only over atoms on the layer close to the bulk since previous constant potential studies showed that 95% of the charge is located in this layer. The number of charged atoms is therefore 5 times smaller than for the CDC electrode, thus a value of −0.05 e was chosen to ensure the overall electroneutrality of the simulation cell. Similarly, when equilibrating for the opposite polarization, CDC carbon atoms bore a charge of −0.01 e and surface graphite atoms a charge of +0.05 e. After this equilibration
proce-dure, we computed the electrostatic potential from Equation1. The
potential difference between the two electrodes was close to 12.5 V. Such a large value is due to the large potential drop between the graphite electrode and the electrolyte, which reaches values for which electrochemical reactions are supposed to occur. These events cannot occur in our classical simulations, so this does not affect the results. In addition we are not interested in the structure at this interface in the present study. The potential drop at the interface between the CDC and the electrolyte is much smaller.
Finally, the electrodes were set to this constant potential difference
of 1ψ0 = 12.5 V.29,31 This methodology is essential to observe a
realistic behavior of the system.32Two simulations were performed
where the graphite electrode was either the positive or the negative electrode. All the simulations were performed for sufficiently long times to reach equilibrium, i.e. until the value of the total charge on each electrode became constant. The total simulation time for these production run was 800 ps.
Electrochemical characterizations.—[C4mim][PF6] ionic liquid
was purchased from Solvionic company (water content ≤ 0.005%, Cl
≤0.0001%, Br ≤ 0.0001%), France, and stored in Ar-filled glove box
as soon as received. CDC powders (Y-Carbon, USA) with an average pore size of 0.9 nm were prepared by chlorination of TiC powder as
reported elsewhere.2,4CDC films were made by mixing 95 wt% CDC
with 5 wt% polyTetraFluoroEthylene (PTFE, DuPont, France) binder
powders, as previously described.33Once laminated/calendered, 8 mm
diameter electrodes are cut. The active film thickness ranges from 250 to 300 µm depending on the synthesis temperatures of Ti-CDCs, with
a weight loading of 15 mg/cm2.
Electrochemical characterizations were performed in a three-electrode configuration, using a multichannel VMP3 potentio-stat/galvanostat (Biologic, France). Cells were assembled in a glove
box under an argon atmosphere (< 1 ppm of O2 and H2O content).
Active films were laminated onto treated aluminum current collectors
and two layers of 25 µm-thick porous PTFE were used as separator.2
A silver wire was used as a pseudo-reference electrode to monitor the negative and positive electrode potentials separately during the cell cycling while controlling the cell voltage.
Cyclic voltammetry (CV) tests were carried out between 0 and 2.7 V, at a scan rate of 5 mV/s. Electrochemical impedance spec-troscopy (EIS) measurements were made at various bias potentials (defined from the CVs), using a sinusoidal signal of ±5 mV from 200 kHz to 10 mHz.
0 5 10 15
z (nm)
0 0.5 1 1.5 anions cations 0 5 10 15z (nm)
0 0.5 1 1.5Io
n
ic
d
en
si
ty
(n
m
-3)
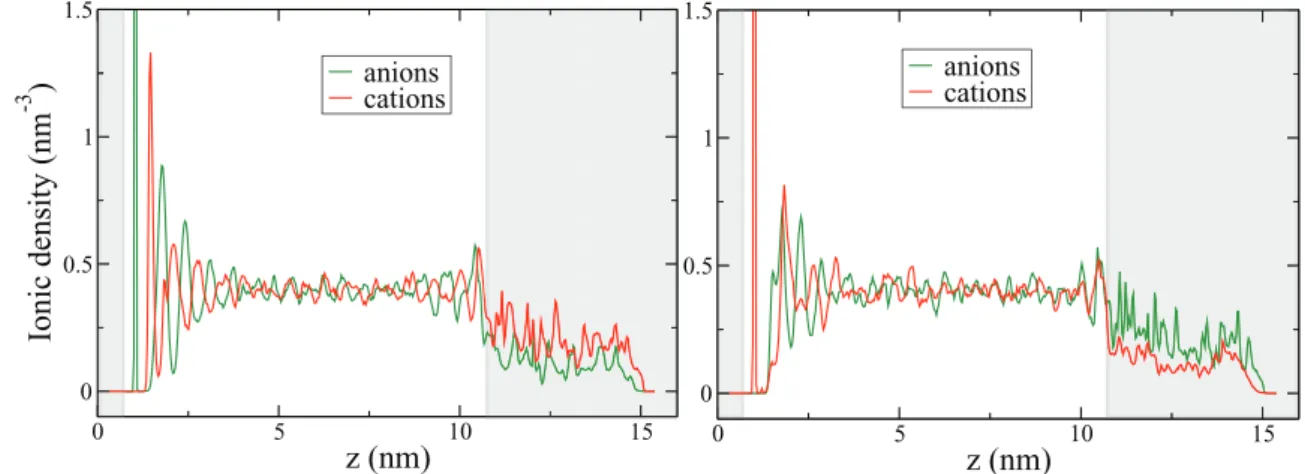
anions cationsFigure 3. Ionic density profiles when the nanoporous carbon electrode is polarized negatively (left panel) or positively (right panel). Anions are in green and cations center of mass in red. The zones occupied by the electrodes are in light gray. The density profiles exhibit maxima corresponding to the structuration of the ionic liquid electrolyte at the interface with graphite (the first maximum close to the planar electrode is not shown for practical purpose). The ionic densities are smaller in the gray area because of the excluded volume due to the electrode atoms (see Figure2).
Results and Discussion
At null voltage, the electrolyte layer, which is either adsorbed at the surface in the case of graphite or inside the pores for CDCs, contains equimolar amounts of cations and anions. When an electrode is charged positively or negatively, it strongly attracts the
counter-ions of the electrolyte, while co-counter-ions are repelled.19The cation/anion
ratio changes, allowing the charging of the electrode surface to occur. Nevertheless, due to the strong Coulombic interactions inside ionic liquids, the adsorbed layer still contains both species up to very large electrode potentials. In parallel, the counter-ions are able to reach
highly confined sites.20For a system with two CDC electrodes, the
differences in ionic concentrations and thus the charge stored on each
of the two electrodes are the same. From this average charge Qt ot, the
global capacitance of the full capacitor is computed straightforwardly as
Ct ot= Qt ot
1ψ, [2]
with 1ψ = ψ+- ψ−. The values of Ct ot obtained previously for the
electrolyte [C4mim][PF6] were:19Cgraphite=29 F/g for planar graphitic
electrodes, and CCDCs=87 F/g for nanoporous realistic ones (CDCs
obtained by quenched molecular dynamics), in agreement with the
very high capacitances of CDCs, compared to other carbon structures.2
The fact that both electrodes carry the same charge does not imply
that they have the same individual capacitance, defined as C+/−= Qt ot
1ψ′
with 1ψ′=
ψ+/−- ψref. Indeed, the potential drop can be different for
the two electrodes. Unfortunately, as explained above, for CDCs, ψref
cannot be determined.
The use of a hybrid supercapacitor allows the calculation of ψref
and thus to access the single capacitance of a complex CDC electrode. The average ionic densities along the z direction of the simulation cell
are shown in Figure3. Compared to our previous work on graphite,25
we observe the presence of very large peaks for the adsorbed species. This is due to the very large potential used in the present work. The
electrostatic potential is calculated in the z direction for z < zCDC(see
Figure4) only since Equation1is not valid inside the porous electrode.
A value of ψref= −12 V is obtained, from which we deduce the voltage
difference between the negatively polarized CDC electrode and the
reference bulk potential 1ψ−=
ψ−- ψref= −0.5 V. Our simulations
also provide the total charge on the porous carbons, namely Q−
t ot =
−41.5 e. Using the expression (2) of the integral capacitance and normalizing by the mass of the porous electrode, we finally obtain the
capacitance of the CDCs under negative polarization: C−=183 F/g.
In order to get the CDC capacitance under positive polarization,
C+, the same steps are carried out, polarizing the electrodes in the
opposite direction. A voltage 1ψ0 =12.5 V is applied between the
electrodes, leading to a reference bulk potential ψref= +12 V and
0 5 10 15
z (nm)
-5 0 5 10 15P
0 5 10 15z (nm)
-15 -10 -5 0 5Po
isson
p
ot
enti
al
(V)
Ψ+ Ψref= -12V Ψ -Ψref= +12V CD C: Ψ non calc ulab le CD C: Ψ non calc ulab leP
P
CD C: Ψ non calc ulab le CD C: Ψ non calc ulab leFigure 4. Poisson potential along the hybrid system for negative (left panel) or positive (right panel) polarization of the nanoporous CDC electrode. The value of 9refis read and then 19+and 19−can be deduced, knowing the value of the applied potential difference between the electrodes. The zone occupied by the
Figure 5. Nanoporous carbon electrode (in light blue) polarized either at a negative (left panel) or a positive (right panel) potential. The snapshots cor-respond to the end of the production runs. Anions are colored in green and cations centers of mass in red. The average number of anions and cations inside the electrode are indicated below.
an average charge on the electrode Q+
t ot = +38.5 e. Consequently,
1ψ+=ψ+-ψref=0.5 V and finally C+=169 F/g. Figure5shows
a snapshot of the cell at the end of the production run, showing the ions of the electrolyte in the porosity of the positive and the negative
electrodes under polarization. Compared to our previous work,19this
time we are able to link the number of species inside the electrode to
a known value of 1ψ+(1ψ−).
The capacitances obtained are not identical for the two electrodes, because the species composing the electrolyte are dissymmetrical in size, shape, and charge distribution. To test the reliability of the newly introduced setup, we compute the global capacitance of a conven-tional supercapacitor with two CDC electrodes, based on the above-determined individual capacitances. The classic relation for capacitors in series reads: 1 Ct ot = 1 C+ + 1 C− [3]
with the result Ct ot =88F/g, in very good agreement with the value
previously obtained in Ref.19: Ct ot = 87F/g. This validates the
methodology described here to calculate the single capacitance of an electrode using a hybrid system.
In order to validate our simulations, electrochemistry experiments
were also performed on similar CDC supercapacitors. Figure6shows
the opposite of the imaginary part of the impedance −Z′′(ω) versus
the real part Z′(ω) of the impedance plot (Nyquist plot) obtained for
a 3-electrode cell assembled with two identical microporous CDC
electrodes with a pore size of 0.9 nm, in [C4mim][PF6] ionic liquid
at 100◦C (which is very close to the 400 K temperature at which the
simulations were performed), at the open circuit voltage (OCV). The Nyquist plot corresponds to a typical capacitive behavior based on ion adsorption at porous carbon electrode with a linear trend for both the real and imaginary part of the capacitance in the medium frequency range, followed by a sharp quasi-vertical increase of the imaginary part of the impedance at low frequency. The real value of the impedance at high frequencies (when the imaginary part is null) stands for the series resistance of the cell. The low value of less than
1 Ohm.cm2(associated with the high temperature) evidences that the
ohmic drop in the electrolyte does not drive the electrochemical
be-havior of the cell. This is consistent with previous results.34The ionic
resistance of the electrolyte inside the porous carbon 1RPORESis about
2 Ä.cm2, which is a value similar to that obtained in a conventional
organic electrolyte.35,36
Figure7shows the Cyclic Voltammetry (CV) of the same cell
using CDC electrodes with a pore size of 0.9 nm in [C4mim][PF6]
ionic liquid at 100◦C. The cell shows a capacitive signature with a
rectangle-shaped CV that is typical of a charge storage mechanism by
ion adsorption in the double layer.1The positive and negative electrode
Figure 6. Nyquist plot of a supercapacitor cell assembled with two electrodes using 0.9 nm pore size CDC porous carbon, in [C4mim][PF6] at 100◦C.
Fre-quency range: from 200 kHz to 10 mHz at OCV (1E = +/−5 mV). Inset: zoom of the high frequency region.
signatures recorded during the cell cycling are also shown in Figure7.
Both electrodes show as well capacitive signature, indicating that there is no limitation in the pore accessibility for the ions. This is consistent
with previous results reported in ionic liquid based electrolytes.4,37,38
The negative and positive electrode capacitances are calculated by integrating the charge in the plateau region during the CVs, resulting in values of 90 F/g and 75 F/g for the negative and positive electrode respectively.
Although simulations overestimate the overall capacitance by a factor of two, both techniques allow us to conclude that the charging
is more efficient in the positive electrode (C+
>C−). This result cannot
be linked directly to the ionic size of the adsorbed species. Indeed, the anions and cations have respective average Lennard-Jones diameters
-4 -2 0 2 4 -1.5 -1 -0.5 0 0.5 1 1.5 -0.5 0 0.5 1 1.5 2 2.5 3 Positive electrode Negative electrode Cell C u rr e nt ( m A )
Electrodes Potential (V vs Ag/Ag+) Cell Voltage (V)
Figure 7. Cyclic voltammetry of a supercapacitor cell assembled with two electrodes based on 0.9 nm pore size CDC porous carbon, in [C4mim][PF6]
of 0.5 nm and 0.6 nm, which are both smaller than the average pore size of the simulated CDC (0.9 nm). It is more likely due to a subtle balance between the volume occupied by the ions in the electrode and the strength of their Coulombic interactions. Additional simulations with different cationic/anionic species would be necessary to uncover the microscopic origin of this difference.
However, we note that there is a factor two between absolute ex-perimental and simulated values for the single capacitance. Part of the difference can be explained by the fact that experimental systems and simulated ones are studied at different sizes. Indeed, although simula-tions involve realistic carbons, their size is limited to a few nanome-ters while experimental samples have a macroscopic size (typically a thickness in the 100 µm range). It is therefore possible that the latter have some inhomogeneities, non-accessible portions, etc. . . , which are not present in the microscopic model.
The remainder of the difference can be explained by the limita-tions of the model used to describe the electrode, in particular as a perfect electronic conductor. By definition, in a perfect conductor, there is no energy dissipation and the response of the free charges is instantaneous. Luque and Schmickler recently studied the response of an electric double layer close to a graphitic layer to an
exter-nal field,39 using DFT calculations. The capacitance of a graphitic
layer is around a few µF.cm−2, that is to say one order of magnitude
smaller than the capacitance given by metallic electrodes. Quanti-tative explanations for this small capacitance on metallic electrodes have been attempted using the semi-conductor theory, but as graphite does not have a finite density of electronic states at the Fermi level, it is not a semi-conductor. Therefore an agreement with
experimen-tal data can be obtained only by adjusting some parameters40 or
by adding an arbitrary capacitance.41By precise DFT calculations,
Luque and Schmickler39showed that the small capacitance is due to
the small electronic density of graphite close from the Fermi level, the external field penetrating inside the electrode over several tenths of a nanometer. The discordance between theoretical and experi-mental capacitances of graphene layers has also been explained in
Ref.42: the theoretical capacitances overestimate experimental ones.
The explanation given is that the difference is due to large potential fluctuations when the electrolyte enters inside the electrode which are not included in the theoretical model.
Conclusions
In the present molecular dynamics simulations, with a setup es-tablished for a singular purpose, we have shown that it is possible to calculate single electrode capacitances in the case of complex nanoporous electrodes supercapacitors. Thanks to experimental elec-trochemical characterizations in a 3-electrode configuration achieved
at an unusually high temperature (100◦C), we were able to validate
the simulation approach. Although our model overestimates the single electrode capacitances compared with experiments by a factor of 2, which is due to the perfect metal model used for the electrodes as shown in previous DFT studies, they are in qualitative agreement with experimental data for evaluating the difference in the capacitance be-tween the positive and negative electrodes. The two techniques show
that in the case of the [C4mim][PF6] electrolyte, the charging is more
efficient in the positive electrode, despite the fact that both ions have a diameter quite smaller than the average dimension of the pores. This shows that it is difficult to predict a priori the performance of a given ionic liquid, which will depend strongly on the interionic interactions. Systematic studies of the single ion capacitance should be performed on many other ionic liquids, such as the 1-ethyl-3-methylimidazolium bis(trifluoromethane)sulfonimide which is widely used in experiments, for rationalizing their performances by molecular dynamics simulations.
Acknowledgments
P. S. acknowledge the support from the European Research Coun-cil under the European Union’s Seventh Framework Programme (FP/2007-2013) / ERC grant Agreement n.102539 (Advanced grant, Ionaces project). C. P. and B. D. were supported by the ERC-Advanced Grant. We are grateful for the computing resources on JADE (CINES, French National HPC) obtained through the project x2014096728
References 1. P. Simon and Y. Gogotsi,Nat. Mater., 7, 845 (2008). 2. J. R. Miller and P. Simon,Science, 321, 651 (2008).
3. J. Chmiola, G. Yushin, Y. Gogotsi, C. Portet, P. Simon, and P.-L. TabernaScience,
313, 1760 (2006).
4. C. Largeot, C. Portet, J. Chmiola, P.-L. Taberna, Y. Gogotsi, and P. Simon,J. Am. Chem. Soc., 130, 2730 (2008).
5. C. Decaux, C. Matei Ghimbeu, M. Dahbi, M. Anouti, D. Lemordant, F. B´eguin, C. Vix-Guterl, and E. Raymundo-Pi˜nero,J. Pow. Sour., 263, 130 (2014). 6. V. Augustyn, J. Come, M. A. Lowe, J. W. Kim, P.-L. Taberna, S. H. Tolbert,
H. D. Abru˜na, P. Simon, and B. Dunn,Nat. Mater., 12, 518 (2013).
7. V. Augustyn, P. Simon, and B. Dunn,En. and Environ. Science, 7, 1597 (2014). 8. O. Ghodbanea, F. Ataherian, N.-L. Wu, and F. FavierJ. Pow. Sources, 206, 454
(2012).
9. P. C. Gao, P. A. Russo, D. E. Conte, S. Baek, F. Moser, N. Pinna, T. Brousse, and F. FavierChemElectroChem, 4, 747 (2014).
10. H. Wang, A. C. Forse, J. M. Griffin, N. M. Trease, L. Trognko, P.-L. Taberna, P. Simon, and C. P. Grey,JACS, 135, 18968 (2013).
11. A. C. Forse, J. M. Griffin, H. Wang, N. M. Trease, V. Presser, Y. Gogotsi, P. Simon, and C. P. Grey,Phys. Chem. Chem. Phys., 15, 7722 (2013).
12. M. Deschamps, E. Gilbert, P. Azais, E. Raymundo-Pinero, MR. Ammar, P. Simon, D. Massiot, and F. Beguin,Nat. Mater., 4, 351 (2013).
13. M. D. Levi, N. Levy, S. Sigalov, G. Salitra, D. Aurbach, and J. Maier,J. Am. Chem. Soc., 132, 13220 (2010).
14. W.-Y. Tsai, P.-L. Taberna, and P. Simon,J. Am. Chem. Soc., 136, 8722 (2014). 15. Y. Shim and H. J. Kim,ACS Nano, 4, 2345 (2010).
16. G. Feng, J. Huang, B. G. Sumpter, V. Meunier, and R. A. Qiao,Phys. Chem. Chem. Phys., 13, 14723 (2011).
17. S. Kondrat, P. Wu, R. Qiao, and A. A. Kornyshev,Nat. Mater., 13, 530 (2014). 18. Y. He, J. Huang, B. G. Sumpter, A. A. Kornyshev, and R. Qiao,J. Phys. Chem. Lett.
6, 22 (2015).
19. C. Merlet, B. Rotenberg, P. A. Madden, P.-L. Taberna, P. Simon, Y. Gogotsi, and M. Salanne,Nat. Mater., 11, 306 (2012).
20. C. Merlet, C. Pean, B. Rotenberg, P. A. Madden, B. Daffos, P.-L. Taberna, P. Simon, and M. Salanne,Nat. Commun., 4, 2701 (2013).
21. M. Z. Bazant, B. D. Storey, and A. A. Kornyshev,Phys. Rev. Lett., 106, 046102 (2011).
22. C. Pean, C. Merlet, B. Rotenberg, P. A. Madden, P.-L. Taberna, B. Daffos, M. Salanne, and P. Simon,ACS Nano, 8, 1576 (2014).
23. C. Merlet, B. Rotenberg, P. A. Madden, and M. Salanne,Phys. Chem. Chem. Phys.,
15, 15781 (2013).
24. M. V. Fedorov and A. A. Kornyshev,Chem. Rev., 114,, 2978 (2014).
25. C. Merlet, M. Salanne, B. Rotenberg, and P. A. Madden,J. Phys. Chem. C, 115, 16613 (2011).
26. J. C. Palmer, A. Llobet, S.-H. Yeon, J. E. Fischer, Y. Shi, Y. Gogotsi, and K. E. Gubbins,Carbon, 48, 1116 (2010).
27. D. Roy and M. Maroncelli,J. Phys. Chem. B, 114, 12629 (2010).
28. C. Merlet, M. Salanne, and B. Rotenberg,J. Phys. Chem. C, 116, 7687 (2012). 29. S. K. Reed, O. J. Lanning, and P. A. Madden,J. Chem. Phys., 126, 084704 (2007). 30. T. R. Gingrish and M. Wilson,Chem. Phys. Lett., 500, 178 (2010).
31. J. I. Siepmann and M. Sprik,J. Chem. Phys., 102, 511 (1995).
32. C. Merlet, C. Pean, B. Rotenberg, P. A. Madden, P. Simon, and M. Salanne,J. Phys. Chem. Lett., 4, 264 (2013).
33. C. Portet, PL Taberna, P. Simon, and C. Laberty-Robert,Electrochim. acta, 49, 905 (2004).
34. C. Largeot, P. L. Taberna, Y. Gogotsi, and P. Simon,Electrochem. Solid-State Lett.,
14, A174 (2011).
35. P. L. Taberna, C. Portet, and P. Simon,Applied Physics A, 82, 639 (2006). 36. P.-L. Taberna, P. Simon, and J.-F. Fauvarque,J. Electrochem. Soc., 150, A292 (2003). 37. R. Lin, P.-L. Taberna, J. Chmiola, D. Guay, Y. Gogotsi, and P. Simon,J. Electrochem.
Soc., 156, A7 (2009).
38. R. Lin, P. Huang, J. S´egalini, C. Largeot, P.-L. Taberna, J. Y. Chmiola Gogotsi, and P. Simon,Electrochim. Acta, 54, 7025 (2009).
39. N. B. Luque and W. Schmickler,Electrochim. Acta, 71, 82 (2012). 40. H. Gerischer.J. Phys. Chem., 89, 4249 (1985).
41. Y. Zhou, T. Holme, J. Berry, T. R. Ohno, D. Ginley, and R. O’Hayre,J. Phys. Chem. C, 114, 506 (2010).
42. J. Ye, M. F. Craciun, M. Koshino, S. Russo, S. Inoue, H. Yuan, H.-D. Shimotani, A. F. Morpurgo, and Y. Iwasa,PNAS, 108, 13002 (2011).
![Figure 6. Nyquist plot of a supercapacitor cell assembled with two electrodes using 0.9 nm pore size CDC porous carbon, in [C 4 mim][PF 6 ] at 100 ◦ C](https://thumb-eu.123doks.com/thumbv2/123doknet/3230032.92442/5.892.458.820.739.1074/figure-nyquist-supercapacitor-assembled-electrodes-using-porous-carbon.webp)
