Open Archive TOULOUSE Archive Ouverte (OATAO)
OATAO is an open access repository that collects the work of Toulouse researchers and
makes it freely available over the web where possible.
This is an author-deposited version published in :
http://oatao.univ-toulouse.fr/
Eprints ID : 16634
To link to this article : DOI : 10.1016/j.memsci.2016.11.001
URL :
http://dx.doi.org/10.1016/j.memsci.2016.11.001
To cite this version : Lan, Yandi and Groenen-Serrano, Karine and
Coetsier, Clémence and Causserand, Christel Fouling control using
critical, threshold and limiting fluxes concepts for cross-flow NF of
a complex matrix: Membrane BioReactor effluent. (2017) Journal of
Membrane Science, vol. 524. pp. 288-298. ISSN 0376-7388
Any correspondence concerning this service should be sent to the repository
administrator:
[email protected]
Fouling control using critical, threshold and limiting fluxes concepts for
cross-flow NF of a complex matrix: Membrane BioReactor effluent
Yandi Lan, Karine Groenen-Serrano, Clémence Coetsier, Christel Causserand
⁎ Laboratoire de Génie Chimique, Université de Toulouse, CNRS, INPT, UPS, Toulouse, FranceA B S T R A C T
The optimization of permeate flux is a particularly interesting strategy to control fouling and, as a consequence, enhance productivity for nanofiltration (NF) processes. Critical flux, threshold flux and limiting flux theories represent significant advance in this strategy. The aim of this study was to apply these concepts to achieve fouling control during NF of a real complex matrix: hospital wastewater after Membrane BioReactor treatment (MBR permeate). At low pressure (3 bar) no flux decline was observed, revealing no fouling conditions. By applying a range of transmembrane pressure and using the square-wave method, the critical flux for irreversibility (70 L h−1m−2) and the corresponding critical pressure (3.4 bar) were then determined for the
NF process in this complex matrix. Above these critical conditions, irreversible fouling started to occur. The threshold pressure and related flux (transition points between low and high fouling regions) were then searched by critical flux data conversion. Our results suggest, even if an exact value for the threshold pressure could not be determined, that it could be located in the range 3.4–10 bar. Operating in this pressure range should lead to acceptable fouling rate and flux decline.
During filtrations conducted above the critical flux in the MBR effluent, two stable fluxes behaviours were observed indicating that different fouling stages occur: pseudo stable flux was 67 L h−1m−2at 5 bar, whereas
33 L h−1m−2at 10–35 bar. It can be then confirmed that a limiting flux occurred in this system, the value of
which 33 L h−1m−2is rather lower than that of the critical flux. This flux behaviour was proved to be related to a
severe fouling in the pressure range 10–35 bar due to a combined effect of colloidal silica and organics fouling and calcium phosphate scaling. The early fouling stage at 5 bar was expected to be solely related to colloidal silica and organics accumulation. To characterise this change in fouling behaviour, a method allowing the estimation of the permeability before scaling was proposed. The combination of the permeability before scaling and critical flux has enabled a NF working diagram to be drawn from which the fouling stage for a given transmembrane pressure and corresponding permeate flux was able to be determined.
1. Introduction
Nanofiltration (NF) membranes are widely used for liquid-based separations, such as water purification. These membranes are often applied as tertiary treatment for effluents of Conventional Activated Sludge (CAS) or Membrane BioReactors (MBRs), to remove biorefrac-tory micropollutants, when high water quality is required. Although the efficiency for the removal of organic contaminants is satisfactory[1–3], membrane fouling is a major problem in the operating of NF. Fouling increases the cost due to the increase in energy demand, the use of chemicals for cleaning, and the frequency of membrane replacement [4].
NF membranes are normally subject to fouling by colloidal materi-als and soluble inorganic compounds, which are not removed by
pre-treatment. Firstly, colloidal sized substances, consisting of organic material, silica, metal oxides and microorganisms are the foulants of greatest concern for nanofiltration [4]. Their deposition on the membrane surface is, in a complex way, due to various phenomena: hydraulic drag force, electrostatic repulsion, van der Waals attraction or hydrophobic/hydrophilic interactions with different interaction lengths[5]. Secondly, membrane scaling (or inorganic fouling) is a serious problem in applications of NF processes. Scaling leads to all of the following: irreversible membrane pore blocking[4,6], a dramatic decrease of flux, and physical damage of the membrane due to the difficulty in the removal of scalant. Scaling results from the concentra-tion of one or more inorganic substances beyond their solubility limits and their precipitation onto the membrane surface [7]. In real effluents, the complexity of the matrix composition makes it difficult
http://dx.doi.org/10.1016/j.memsci.2016.11.001 ⁎Corresponding author.
to understand and anticipate fouling only through feed analysis. One strategy for fouling control is to optimise the permeate flux which is a particularly interesting parameter. Cohen and Probstein[8] found that fouling may be prevented simply by operating below a threshold transmembrane flux during the filtration of a colloidal suspension in reverse osmosis systems. These authors hypothesised that foulant deposition occurs only if the hydrodynamic drag force exceeds the interaction forces. Based on this study, critical flux concept was firstly defined as “the flux below which no fouling occurs”[9,10], and as “the flux below which a decline of flux with time does not occur; above it fouling is observed”[11]. For colloidal suspensions[9,10], this concept was developed to generally describe the balance between foulants–foulants or foulants–membrane repulsive forces and perme-ate flux drag forces. Above the critical flux, permeperme-ate drag forces overcome repulsive forces which induce the deposition of foulants on the membrane surface. At that time fouling occurs and the permeate flux declines. The original forms of critical flux were described to be the strong form and the weak form by Field et al.[11,12]. The strong form of critical flux, Jcs, was developed to discriminate no fouling conditions
and defined as the point at which the flux starts to deviate from the pure water flux-transmembrane pressure line. The weak form, Jcw, is
observed in systems where a very rapid fouling (due to surface or pore adsorption that takes place independently of flux) occurs immediately at the start of the operation, leading to a linear portion of the flux-transmembrane pressure curve with a slightly lower slope than the pure water flux line. In addition to Jcsand Jcw, Bacchin et al.[13]
introduced the concept of critical flux for irreversibility, Jci, which has a
clear link to a physical phase transition. Above the critical flux for irreversibility, multilayers of irreversible fouling appear and grow in the boundary layer whereas below Jcionly a concentration polarization
layer exists in all cases with an additional monolayer of adsorbed species in some cases. This research group [5,14] also developed a filtration procedure, namely square-wave method, which enables the identification of the reversible and irreversible parts of fouling and the determination of the critical flux for irreversibility. Theoretically, operating below Jcican minimise irreversible membrane fouling and
flux decline.
In the case of real wastewater filtration, membranes system may not exhibit a critical flux as fouling immediately occurs even at very low fluxes. Moreover, in water industry the main objective is not to totally avoid fouling but to define operating conditions in which fouling is minimized to limit cleaning frequency. The concept of threshold flux was then recently introduced. Threshold flux, Jth, was proposed to be
that flux at or below which a low and nearly constant rate of fouling occurs and above which the rate of fouling increases markedly[12]. Instead of “no fouling” condition, threshold flux focuses on the rate of fouling with no distinction between reversible and irreversible fouling. The goal of operating below the threshold flux is to obtain an acceptable fouling rate and sufficiently high flux over a long period of run.
Beside critical and threshold fluxes, limiting flux, JL, is another
important concept for fouling control. This limiting flux represents the maximum stationary permeate flux, which can be reached by increas-ing the transmembrane pressure with a given solution or suspension [13,15,16]. For this limit, further increments in transmembrane pressure do not increase flux. At a high flux, the drag force overcomes repulsive forces and the flux continues to decrease until the hydro-dynamic drag force is lower or sufficiently close to the foulant-membrane and/or foulant deposited-foulant interaction forces[13].
Considering the fact that critical, threshold and limiting fluxes can be potentially powerful tools for understanding and controlling fouling, numerous studies attempted to develop these concepts and to inves-tigate their existence in synthetic solutions and real wastewater. Wu et al.[17]determined the value of critical fluxes with pressure steps, composed of regular positive and negative variations. Both strong and
weak forms of critical flux were observed for two colloidal silica suspensions in this study. Manttari and Nystrom[18] evaluated the critical flux with a stepwise filtration procedure, and only a weak form of the critical flux was observed in effluents from the paper industry. In other cases, some authors noted that fouling cannot be completely inhibited during the treatment of complex fluids such as wastewater even at low flux rates[19]. In that conditions, the critical flux (Jcsand
Jcw) cannot be defined strictly. Le Clech et al.[20]pointed out that a
zero rate of transmembrane pressure (TMP) increase was never attained during the filtration of real and synthetic sewage. As the critical flux may not exist in such effluents, threshold flux can be suitable for the description of this system. Luo et al[21]validated and applied the concept of threshold flux in the treatment of dairy waste-water. Ochando-Pulido et al.[22,23]used the pressure-cycling method to analyse and identify the critical and threshold fluxes of an ultrafiltration membrane in several effluents. Based on the study of Field et al. [11,12], Stoller et al. [24] developed a threshold flux determination method by means of critical flux data conversion for a nanofiltration membrane. Stoller and Ochando-Pulido [25,26] then tried to merge threshold and critical flux concepts into a single concept: boundary flux. On the other hand, few studies have investigated the critical flux for irreversibility (Jci), since it was defined by Bacchin et al
[13]. Rayess et al.[27]measured Jciduring cross-flow microfiltration
of wine by the square-wave method and noticed that no apparent critical flux for irreversibility can be determined in the range of tested pressures, as irreversible fouling always takes place from the beginning of the filtration, even at low pressures. A criterion (Rif/Rm≤1) was suggested to determine the “threshold flux” below which fouling remains acceptable. Based on these different works, the existence of a critical flux for irreversibility in real wastewater and its difference or potential relationship with threshold flux deserve to be investigated in further study.
In term of limiting flux, Bacchin et al.[28]tried to link limiting and critical fluxes and found from a modelling study that the limiting flux value is probably equal to 3/2 of the critical flux value in a colloidal system. Tang and Leckie[29]investigated the existence of limiting flux during nanofiltration of a synthetic solution of purified humic acid and concluded that the limiting flux is independent of the type of membrane while has a strong dependence on the feed water composi-tion. The value of the limiting flux can be equal to, greater than or even less than the value of the critical flux, depending on feed water chemistry, theoretically. A series of NF and RO semi-aromatic and fully-aromatic polyamine membranes was tested for the filtration of a synthetic solution of purified humic acid. These different membranes exhibit a limiting flux that is equal to or greater than the critical flux. The opposite case, i.e. a limiting flux that is lower than the critical flux, has not been observed under the experimental conditions investigated by these authors. This research group also developed a limiting flux model for predicting the fouling behaviour of nanofiltration membrane [30]. The limiting flux model is capable of anticipating the effect of solution chemistry on the degree of humic acid fouling. Nevertheless, these studies were carried out in synthetic solution. In real wastewater matrices, the correlation between the limiting flux and the fouling mechanisms, the relationship between the limiting flux and the critical flux, and even the existence of a limiting flux, are still unclear.
The objective of this study was to apply the concepts of critical flux for irreversibility, threshold flux and limiting flux for fouling control in a cross-flow NF system which is used as a tertiary treatment of Membrane BioReactor effluent. Firstly, the critical flux for irreversi-bility was determined by the square-wave method[5,14]. Secondly, the threshold flux was estimated by critical flux data conversion[24]. Then, the existence of a limiting flux and the associated fouling mechanisms were investigated. Based on this study of flux behaviour and fouling mechanisms, strategies for fouling control through correlation between flux behaviour and fouling stages were proposed.
2. Material and methods
2.1. The water matrix
The study of fluxes of the NF membrane was performed in MBR effluent. The MBR system using ultrafiltration hollow fiber membranes (polysulfone 0.2 µm, reference: UFWW50 IMMEM, Polymem), was installed at Purpan, hospital located in Toulouse, France. This system was directly fed from the hospital’s sanitary collection system. MBR effluent contains salts, organic matter (total organic carbon around 20 mg L−1) and around 50 pharmaceuticals from 10 different
ther-apeutic classes[31]. Water characteristics for filtration are shown in Section 2.3.1.
2.2. Membrane and nanofiltration apparatus 2.2.1. The NF membrane
A NE 70 nanofiltration membrane was examined in this study. NE 70 is a thin film composite polyamide membrane which consists of a polysulfone sub-layer and polyamide active layers. The characteristics of this membrane are shown inTable 1.
The membrane samples were stored in a preservative solution (NaHSO30.1 g L−1, 4 °C). They were rinsed and cleaned with ultrapure
water before filtrations and then installed in the cross-flow cell. Membrane compaction was performed by the filtration of ultrapure water at a TMP equal to 40 bar until a constant flow rate was obtained (around 3 h).
2.2.2. Nanofiltration apparatus
Nanofiltration experiments were conducted in a cross-flow filtration unit (Fig. 1). The volume of the feed tank (1) is 10 L. The membrane was installed into a stainless cross-flow cell (Sepa CF II, Osmonics) (3) in which the effective membrane area was 1.4×10⁻²m2. Permeate can
be collected in a vessel and weighed on scale (5) connected to a computer.
In order to simulate a feed-and-bleed continuous mode at Volume Reduction Factor (VRF) of 5, the filtration experiment was applied in two steps: firstly, the concentration mode and secondly the
recircula-tion mode. This VRF of 5, correlating to a 80% recovery, is within the range that would be applied in a full-scale system (30–90%) [32]. During the concentration mode, the retentate stream was recycled into feed vessel while the permeate was collected in the permeate tank. This mode corresponds to a transient state as the retentate concentration increased with filtration time. After the VRF reached 5, both retentate and permeate streams were recycled back to the feed tank, correspond-ing to a recirculation mode. The permeate flux was monitored durcorrespond-ing both filtration steps. The square-wave filtration method, developed by Espinasse et al.[5,14], was applied during the recirculation step. The cross-flow velocity was fixed to 0.2 m s−1.
2.3. Analytical methods
2.3.1. Water matrix characterization
Concentrations of salts in MBR effluent were measured by ionic chromatography with an ICS 3000 system (Dionex, France). The injection volume was 25 µL and the column temperature was set to 30 °C. The concentrations of anions and cations were analysed with two columns (Thermo Scientific, Dionex): IonPac™ AS11 (mobile phase: 95% of 5 mM NaOH and 5% of 100 mM NaOH) and IonPac™ CS12 (mobile phase: CH4O3SO320 mM), respectively. Analytical errors
for anions and cations ranged from 1.5% (K+) to 6% (SO
42−). In this
mobile phase, all H3PO4, H2PO4−1, HPO42−and PO43−present in the
solution were referred to as PO43−.
Total Organic Carbon (TOC) and Inorganic Carbon (IC) were measured with a TOC-VCSN instrument (Shimadzu). The concentra-tion of inorganic carbon was measured after acidificaconcentra-tion and degas-sing. TOC was calculated from the difference between the total carbon and inorganic carbon. Chemical Oxygen Demand (COD) was deter-mined by photometry using disposable test tubes (HI93754H-25 LR from HANNA Instruments) and a HACH DR/2400 photometer. After sample addition, test tubes were heated at 150 °C for 2 h and left to cool down at room temperature before measuring.
pH (A-32908-06, Labcor Technical Sales Inc.), conductivity (23226-523, VWR, Mississauga, Ontario) and UV254were measured.
UV254 was analysed using a spectrophotometer (Hewlett Packard
8452A) at a wavelength of 254 nm and using a quartz crystal cuvette with a 1 cm path length.
As previously explained, the MBR effluent from a hospital was used as the feed solution. This effluent was first concentrated 5 times in a concentration mode. Then the concentrated MBR effluent (recircula-tion solu(recircula-tion) was filtrated at a constant retentate concentra(recircula-tion (recirculation mode) to determine critical, threshold and limiting fluxes. The characteristics of the feed and the recirculation solution are shown inTable 2.
2.3.2. Membrane surface characterization
Virgin and fouled membranes after filtration were characterized after drying at 60 °C with a vacuum degree fixed at −0.8 bar (C3000 -XF020 France, Etuves).
ATR-FTIR spectra (Attenuated Total Reflection – Fourier Transform InfraRed spectroscopy) were obtained with a Thermo-Nicolet Nexus 670 apparatus (USA). The sample was placed on diamond crystal substrates and the analytical depth was approximately 2 µm. Virgin and fouled membranes were examined using ATR-FTIR spectra to identify membrane properties and fouling composition.
Surface morphology of membranes was examined with a Scanning Electron Microscope (SEM, Hitachi Tabletop Microscope TM-1000) interfaced with an Energy Dispersive X-ray (EDX) spectroscopy system (Thermo-Fisher). Membrane samples were sputtered with a thin layer of gold before SEM analysis for better contrast. The EDX analyses were carried out at the same time. Elemental analysis began from sodium. EDX measurements were performed at different locations of the membrane surface, in order to obtain a comprehensive elemental composition. Cross-sections of samples were prepared by cryo-fracture:
Table 1
Characteristics of the NE 70 membrane.a MWCO (Da) Max.
temperature (°C) Max. pressure (bar) pH range Surface charge Rejection (%) 250 45 41.4 3–10 Negative 40–70 (NaCl) 99.5 (MgSO4) aProvided by the manufacturer: Woongjin Chemical Co., Ltd., considering specific
conditions: 2000 mg/l MgSO4, 25 °C, recovery 15%, pressure 0.5 MPa, pH 6.5–7.0; 1500 mg/l NaCl, 25 °C, recovery 15%, pressure 1 MPa, pH 6.5–7.0.
Fig. 1. Nanofiltration set-up, (1) feed tank, (2) high pressure pump, (3) cross-flow filtrate cell, (4) pressure monitor, (5) permeate tank and weighing scales.
membranes were first immersed in ethanol, then fractured in liquid nitrogen.
2.4. Critical flux for irreversibility determination: the square-wave method
The square-wave method, developed by Espinasse et al.[5,14], can be applied to distinguish the reversible part of fouling, due to osmotic pressure (Rrf), and the irreversible fouling (Rif) and then to obtain the
accurate value of the critical flux for irreversibility (Jci). The principle of
this method is to alter the operating pressure with positive and negative variations, as shown in Fig. 2. The U steps correspond to the upper pressure steps while the L steps correspond to the lower pressure steps. By comparing the fluxes between steps Lnand Un−1that correspond to
the same applied pressure, the decrease in flux is associated to the fouling phenomenon that occurs at step Un. If the flux is the same in
steps Un−1and Ln, the fouling is considered as totally reversible and the
flux is below the critical value for reversibility. If the flux is not the same in steps Un−1and Ln, the fouling is partly irreversible and the flux
is above the critical value.
Calculation methods of irreversible fouling are based on the relationship between the flux and the fouling resistance. The flux can be described by an osmotic pressure model, as follows:
J ΔP Δπ μ R R
= − ( + )
p m if (1)
where J is the permeate flux, ΔP is the transmembrane pressure, Δπ is the osmotic pressure, µpis the viscosity of the permeate and Rm, Rifare
the intrinsic hydraulic membrane resistance and the resistance due to the irreversible fouling, respectively.
The osmotic pressure can also be incorporated into the reversible fouling resistance. In this case, the reversible resistance associated with the polarization concentration layer can be treated like a term of osmotic pressure: J ΔP μ R R R ΔP μ R R = ( + + )= ( + ) p m if rf p m f (2)
where Rfis the total fouling resistance and Rrfis the resistance due to
the reversible fouling, which is related to the polarization concentra-tion.
According to the square-wave filtration method, the irreversible fouling resistance that appears at upper pressure step Un can be
reached by comparing the fouling resistance at steps Ln and Un-1as
follows:
rif n, = Rf L| n − Rf U|n−1 (3) where rif, nis the irreversible fouling resistance relative to the Unstep.
The value of the total Rif, at a given pressure step, is the sum of rifat
each previous pressure step.
∑
Rif= r
n if n,
(4) In the present study, the experimental procedure is shown inFig. 3. The feed solution (MBR effluent) was firstly filtrated in concentration mode for 3 bar. Then the square-wave filtration method was applied in recirculation mode for 3, 5, 10, 15, 25, 35 bar. The operating pressure was increased or decreased when the change of flux over a 30 min period was less than 2% of the initial flux (pseudo stable flux was considered to be obtained). The irreversible fouling resistance was calculated for each pressure step.
2.5. Threshold flux estimation
The threshold flux was estimated by critical flux data conversion [24–26]. From critical flux theory, no permeability loss is observed when operating below the critical flux (Jc, Eq.(5)), while above Jcthe
permeability decreases according the eq.(6) [11,24,33].
dL
dt = 0 J (t) ≤ Jp c (5) dL
dt =B J t( ( ) − )p Jc J (t) > Jp c (6)
where L is the membrane permeability, B is a fitting parameter and Jp(t) is the permeate flux at time t for the selected TMP.
Considering now the threshold flux, Jth, the permeability loss is
unavoidable even below the threshold flux[12]. Operating below the threshold flux, the permeability loss is constant (Eq.(7)). Above Jth, the
permeability loss follows Eq. (8) in which a and b are the fitting parameters including without distinction the contribution of reversible and irreversible fouling.
Table 2
Characteristics of MBR effluent and of the recirculation solution after the concentration step.
Item MBR effluent (NF
feed)
Recirculation solution (after concentration step VRF =5) pH 7.9 ± 0.2 7.6 ± 0.2 COD (mg L−1) 48 ± 3 112 ± 3 TOC (mg L−1) 19.6 ± 0.1 55.1 ± 0.1 HCO3- 31.3 72.4 UV254 0.46 1.37 Na+(mg L−1) 62.4 ± 1.1 77.9 ± 1.4 K+(mg L−1) 19.6 ± 0.3 25.4 ± 0.4 Mg2+(mg L−1) 3.3 ± 0.1 4.9 ± 0.1 Ca2+(mg L−1) 29.3 ± 0.9 43.2 ± 0.6 Cl-(mg L−1) 44.9 ± 0.9 41.6 ± 0.9 NO3-(mg L−1) 7.1 ± 0.1 5.6 ± 0.1 SO42-(mg L−1) 26.8 ± 1.6 76.5 ± 4.6 PO43-(mg L−1) 8.0 ± 0.2 18.6 ± 0.6
Fig. 2. Principle of the square-wave technique; pressure andflux vs time; upper and
dL
dt = −a J (t) ≤ Jp th (7) dL
dt = − − ( ( ) −a b J tp Jth) Jp(t) > Jth (8)
If a is equal to zero, the threshold flux Jthcorresponds to the critical
flux Jc. In both cases (a =0 no fouling or a≠0 limited fouling), the
filtration time during which B =0 or b =0 corresponds to long term fouling region[24].
A linear relationship between permeability loss (ΔL) and filtration duration can be derived from the integration of Eq.(7)between time point t1and t2upon operation below the threshold flux.
L t( ) −2 L t( ) =1 ΔL= − ( − )a t2 t1 (9) Where the permeability at time t can be obtained by Eq.(10), where TMP (t) is the transmembrane pressure at time t. In the present study, TMP is constant at time t1and t2.
L t J t TMP t ( ) = ( ) ( ) p (10) The estimation of threshold flux is based on the relationship between ΔL and Δt: as long as Eq.(9)applies, the permeability loss rate (ΔL/Δt) is constant and equal to “a”, indicating that the operating conditions are below the threshold flux; as soon as ΔL/Δt value deviates from the “a” value, Eq. (9)is no longer valid and Eq. (8) should be applied; the operating conditions are then above the threshold flux. The permeability loss rate value at the boundary of the two conditions allows the determination of the threshold flux, the corresponding transmembrane pressure being the threshold pressure.
2.6. Accumulation of salts at each pressure step
During the recirculation step, both the permeate and the retentate were recycled into the feed tank. The accumulated mass of salts on the membrane surface and/or structure was calculated from the measure-ment of the concentration in the tank before and after circulation according to a mass balance as follows:
Qads=C V Cbe − endV (11)
where Cbe and Cend are the salt concentrations before and after
recirculation, and V is the volume in the retentate loop, assumed to be constant. The concentration of salts was measured, when a steady state was reached at each pressure step.
3. Results
3.1. The determination of the critical and limiting fluxes
The critical flux for irreversibility was determined by the square-wave method subsequent to the experimental procedure shown in Fig. 3. The evolution of fluxes and transmembrane pressure during the filtration of MBR effluents has been shown inFig. 4.
During the concentration step (at 3 bar), the flux slightly increased at the beginning and then quasi stabilized at value 62 L h−1m−2when
VRF =5. After the recirculation step, the applied pressures ranged from 3 to 35 bar. Taking into account the experimental error in flux measurements of 8%, when the applied pressure was maintained at 3 bar the flux value was considered as stable, meaning that no significant fouling occurred at this pressure. Consequently, the flux at the beginning of the operation at 3 bar was considered to be the initial permeability for the filtration of MBR effluent in further calculations of fouling resistances. As expected, when the pressure was increased to 5 bar, the flux immediately increased. After that, a decline in flux during the recirculation time was observed until it reached a stable value again at 67 L h−1m−2. The similar increase of flux with pressure
increase was observed with an applied pressure of 10 bar. However, the
pseudo stable flux reached a new value of 33 L h−1m−2. The procedure
continued with an increase in applied pressure step by step until 35 bar. With the applied pressures of 15, 25 and 35 bar, the fluxes also stabilized at about 33 L h−1m−2, after an increase of flux at the
beginning of a positive variation of pressure.
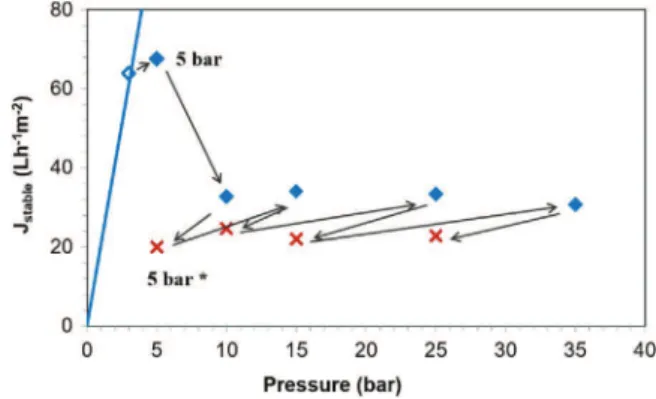
Fig. 5shows the relationship between the pseudo-stable flux and the transmembrane pressure. The continuous line represents the Darcy law according to the initial permeability, determined at 3 bar. The difference between the pseudo stable flux in MBR effluent reached at 3 bar (62 L h−1m−2) and the pure water flux measured on the virgin
membrane at 3 bar (60 L h−1m−2) is within experimental error of flux
measurements (8%); which confirms that no significant fouling (even by organic adsorption) occurs at this pressure which is then below the critical one. Arrows represent the positive or negative variations of pressure. The crosses are the stable fluxes reached after a negative variation in pressure (namely 5 bar*, 10 bar*, 15 bar*, 25 bar* in Fig. 3).
When the applied pressure increased from 3 to 5 bar, it can be suggested that fouling occurred, since a flux decline with time was observed at this pressure (Fig. 4). One can expect a strong form of critical flux has been exceeded at 5 bar, because the pseudo stable flux started to deviate from pure water permeability straight line solely from this pressure (no deviation was observed at 3 bar) [11]. By comparing the value of fluxes of two steps having the same transmem-brane pressure before and after 10 bar (respectively 5 bar and 5 bar*), one can observe that the stable flux decreased drastically. This means that fouling was partially irreversible at 10 bar. As a consequence, the initial flux under 10 bar was greater than the critical flux for irrever-sibility (Jci). This result was confirmed by the evolution of total fouling
resistances at each pressure step (calculated from Eq.(2)) shown in
Fig. 4. Flux evolution following the experimental procedure over time: – the continuous line represents the applied pressure; the dotted line denotes the permeate flux.
Fig. 5. Pseudo stableflux vs applied pressure following the procedure shown onFig. 3; initial permeability ; first pseudo stable flux reached at a certain pressure ♦: hollow one is without decrease of flux over time and the bold points are in presence of flux decrease during filtration; stable flux reached after negative variation of pressure ✖ (5 bar*, 10 bar*, 15 bar*, 25 bar* inFig. 3); Arrows represent the positive or negative variations of pressure.
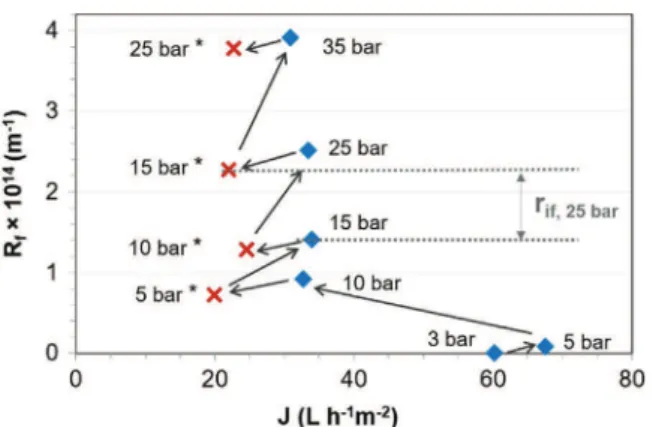
Fig. 6. First, the total fouling resistance at 5 bar*(as Lnstep inFig. 2)
was greater than the total fouling resistance at 5 bar (as Un-1step in
Fig. 2). This means that after an increase in pressure (10 bar as Unstep
inFig. 2) the resistance cannot recover its value at the lower pressure, this remaining resistance (the difference of fouling resistance at 5 bar and 5 bar*) being the irreversible part. At the same time, the total resistance decreased from 10 bar (as Unstep inFig. 2) to 5 bar*(as Ln
step in Fig. 2), which refers to the reversible fouling at 10 bar. Similarly, the total fouling resistance formed at 15 bar, 25 bar, 35 bar includes reversible and irreversible components.
Thanks to the application of the square-wave filtration method (Section 2.4), the value of the critical flux for irreversibility Jciwas then
estimated. The total irreversible fouling resistance at a given pressure was calculated from data inFig. 6and Eqs.(3) and (4). For example, the irreversible fouling resistance at 25 bar step (rif, 25 bar) was shown
inFig. 6when the total irreversible fouling resistance Rifat 25 bar was
deduced from the sum of the rifat each previous step.
The irreversible fouling resistances from 10 bar to 35 bar were calculated and plotted inFig. 7(a). Due to the fact that no fouling was observed at 3 bar, the irreversible fouling resistance is expected to be zero at this pressure. We can define a critical pressure (between 3 and 5 bar) below which irreversible fouling is not observed. In contrast, when the pressure exceeds this critical value, irreversible fouling occurs. The linear relationship between irreversible fouling resistance and transmembrane pressure, allowed us to estimate this critical value to be 3.4 bar.
The critical flux for irreversibility was evaluated at around 70 L h−1m−2 from the critical pressure and initial permeability, as
shown inFig. 7(b). Moreover, it can be observed that the stable flux went below the expected value computed from the initial permeability, when the initial flux exceeded the critical flux. Initial flux at 5 bar was around 97 L h−1m−2(consistent with the pure water flux of the virgin
membrane at 5 bar of 100 L h−1m−2) then exceeding the critical value
of 70 L h−1m−2 (see Fig. 4). The pseudo stable flux at 5 bar was
marginally less than the critical flux value. A further increase in pressure (10–35 bar) does not lead to an increase in the pseudo stable flux. Therefore, this behaviour may indicate that the limiting flux was reached. The value of the limiting flux around 33 L h−1m−2 was
surprisingly less than that of the critical flux one.
3.2. Estimation of threshold flux
In the present study, no fouling took place at 3 bar, which was confirmed by a permeate flux after 10 h of cross-flow filtration almost equals to pure water flux measured on the virgin membrane at 3 bar. At this pressure, permeability loss rate was then 0, thus the fitting parameter “a” is 0. In that case we can consider that our system
exhibits a critical flux, according to the boundary flux conception [25,26]. As some researchers have observed both critical flux and threshold flux on the same system[21], we decided to go further in the analysis of the results in order to determine if above this critical flux it was possible to characterize a low fouling region and a high fouling region, the transition between them corresponding to the threshold flux (Section 2.5). Fig. 8 presents for each tested transmembrane pressure the permeability loss rate (ΔL/Δt). From 5–35 bar, the permeability loss rate was calculated from Eqs. (9) and (10) using the flux data at the last 2 h when the flux reduction was linear.
The permeability loss rate at 3 bar is equal to zero as previously discussed; whereas its value increases dramatically upon operation at 5 bar. In the pressure range from 15 to 35 bar, the calculated permeability loss rate decreases again to achieve almost zero at 35 bar. However, in this pressure range the fouling is so drastic and the permeate flux so low (Fig. 4) that this rate of permeability loss doesn’t correspond to operating conditions that we could advise to industrialist. As a consequence, according to the results reported in Fig. 8, we were unable to determine a region with a constant and limited permeability loss rate that could correspond to long term fouling region before a severe fouling occurs. However, if our system exhibits a threshold pressure, this one could be expected in the range 3.4 (critical pressure) – 10 bar and its determination would have
Fig. 6. Evolution of the total fouling resistance (Rf) v.s. pseudo stable flux obtained at
each pressure according to the square-wave method procedure. Rf after a positive
variation of pressure ♦; Rfafter a negative variation of pressure ✖. Arrows represent the
variations of pressure during the procedure.
Fig. 7. Evolution of (a) irreversible fouling resistance, (b) pseudo stableflux as function of pressure and the location of the critical flux for irreversibility ✖.
required more filtrations in this pressure range.
3.3. Fouling layer characterization
In order to explain fluxes behaviour reported inFig. 7, the chemical composition of the foulant layer will be identified in this section. First, two analytical methods were applied to identify the fouling layer components: ATR-FTIR and SEM-EDX. Then, the accumulation of salts was quantified from a mass balance calculation.
3.3.1. ATR-FTIR
ATR-FTIR spectra of virgin and fouled membranes for wave lengths ranging from 4000 to 750 cm−1 are shown in Fig. 9. The relative
penetration depth during analysis was 2 µm. The spectra of the virgin NE70 membrane is characteristic of an active polyamide top-layer, with a polysulfone sub-layer, in addition to a coating layer (top of the active polyamide layer)[34]. Concerning the polyamide top-layer, the peak at 1631 cm−1, corresponding to the amide band was observed.
Polysulfone groups were detected at 1587, 1504, 1488, 1365, 1350−1280, 1245, 1180–1145, and 830 cm−1. Peaks observed in the
range of high wave numbers (3700–2700 cm−1) were associated with
the coating layer which probably consists of O–H groups[34]. For the fouled membrane after filtration, almost all of the char-acteristic peaks of the polysulfone sub-layer and the polyamide layer cannot be observed, and are replaced by the foulants peaks. Even the peaks related to the coating layer (top of the active polyamide layer) are weak and difficult to recognize. These observations proved that the thickness analysed by the equipment (2 µm) allowed us to characterize the fouling layer, the membrane material itself being unreachable on the fouled membrane. The absorbance at 3300, 1545 and 1647 cm−1
indicates the presence of organics with amide bonds, such as proteins, on the fouling layer. N–H peaks around 3300 and 1545 cm−1, together
with a peak at 1647 cm−1associated with the stretching vibration of
C˭O, indicates the presence of colloidal reflected functional groups of primary and secondary amides[35,36]. The absorbance band around 1445 cm−1, that corresponds to calcium carbonate, is very weak. This
suggests that carbonate was not the main foulant[37]. OH stretching and the Si–OH group vibration are observed at 830–1110 cm−1and
3700–3200 cm−1[38]. The vibration of the Si–O bond appears at 791
and 754 cm−1[39]. In particular, the absorbance around 820 cm−1is
associated with the symmetric bond stretching vibration of the Si-O-Si network [40]. These signals imply the presence of colloidal silica fouling. The wide and intensive peak at 1049 cm−1is suggested to be
characteristic of phosphate (including PO43−, HPO42−, HPO4−1) and
crystallized calcium phosphate[41–43], which probably indicates the presence of calcium phosphate scaling on the fouled membrane surface.
3.3.2. SEM-EDX analysis
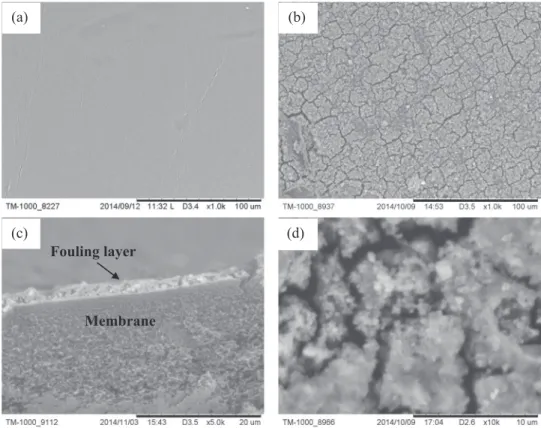
SEM analysis was performed on membrane surfaces and cross-sections before and after filtration, to observe the fouling layer and to characterize the layer’s structure and morphology (Fig. 10). Comparing the micrographs of virgin and fouled membranes, a variety of foulants evenly distributed over the entire membrane surface, was observed. As shown on images (b) and (d), homogenous “bright” points are super-imposed on the dark foulant layer. According to the FTIR analysis and
Fig. 9. ATR-FTIR spectra of fouled and clean membrane.
Fig. 10. SEM images of virgin and fouled membrane: (a) Clean membrane surface 1000×; (b) Fouled membrane surface 1000×; (c)Section of fouled membrane 5000×; (d) Fouled membrane surface 10000×.
the morphology of the foulant, the “bright” points could be surface crystallization and the dark layer is possibly the colloidal silica and organic foulant. The (c) image shows the cross-section of a fouled membrane. The bottom and porous part is the polysulfone sub-layer. Above it, the thin, bright layer (around 0.2 µm) is the active polyamine layer. The fouling layer, which is around 2 µm, is on the top. Its thickness is relatively uniform.
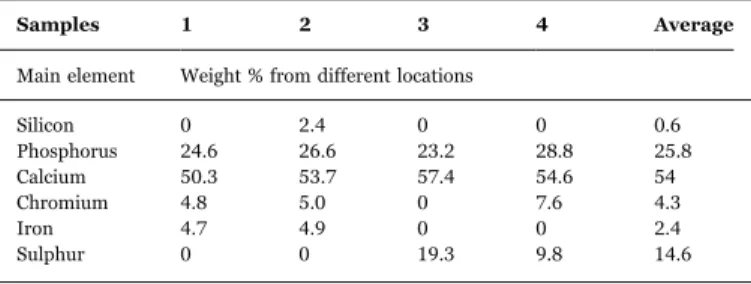
Combined with SEM, EDX was used to analyse the elemental compositions on the surface of virgin membranes and fouling layer. EDX sampled different locations on the virgin and fouled membrane surfaces. The virgin membrane surface is composed of 100% sulphur, while the elements detected on the fouled membrane surface are various. The weight percentages of the main elements are shown in Table 3. These analyses allow us to verify that the main elements responsible for fouling are calcium and phosphate.
The presence of calcium is usually referred to as inverse-solubility of salts (CaCO3, CaSO4·xH2O, calcium phosphate etc.) which can
precipitate and form a hard fouling layer on the membrane often referred to as scaling[4]. For phosphorus, it has been found in previous studies[44]that the presence of phosphate can cause the formation of a viscous gel with silica, resulting in a hard cement-like layer irreversibly bonded to the membrane surface. In addition, phosphates can precipitate with calcium and induce the common calcium phos-phate scaling, as some autopsies on membrane elements have shown [4,45]. Considering the analysis of FTIR, the absorbance peak of calcium carbonate is relatively weak, while the band associated with calcium phosphate is strong. We can confirm that calcium phosphate scaling is the main fouling type, together with colloidal silica and organic fouling. From the EDX analysis, the distribution of calcium and phosphate is quite uniform, which indicates that the scaling is homogeneous on the membrane surface and structure.
Based on FTIR and SEM analyses, the composition of the fouling layer indicates the combined presence of colloidal silica and organic fouling and calcium phosphate inorganic fouling, after filtration of MBR effluent subsequent to the experimental procedure shown in Fig. 4.
3.3.3. Accumulation of ions
As discussed inSection 2.6, we assume that the difference in ions concentration in the tank before and after circulation corresponds to ions accumulated on the membrane surface and structure during the recirculation step. The accumulated mass can be calculated after each pressure step.
In order to verify the role of calcium and phosphate in irreversible fouling resistance,Fig. 11shows the evolution of both the irreversible fouling resistance and the accumulated mass of Ca2+and PO
43-on the
membrane surface versus the applied pressure.
Ca2+, which had slightly accumulated during the concentration step
(results not shown) was partially released from the membrane surface and structure to the retentate, resulting in a negative accumulated mass at 3 bar. Desorption of Ca2+probably occurred between the
concentra-tion step and the recirculaconcentra-tion step at 3 bar when the filtraconcentra-tion was stopped for the night. Considering that no flux decline was observed
during the filtration at this pressure, we can say that the quantity of salt adsorbed in these conditions was negligible and didn’t act as an additional resistance. During the recirculation operation from 5 to 35 bar, the accumulation of Ca2+ and PO
43- exhibited good linear
relationships with applied pressure. For this range of pressures, while Ca2+and PO
43-accumulation increases, irreversible fouling resistance
is enhanced. Thus, the accumulation of Ca2+ and PO
43- on the
membrane surface and structure is strongly correlated to the occur-rence of irreversible fouling. This observation is in accordance with the analysis by FTIR and SEM-EDX.
4. Discussion
During the filtration of the MBR effluent in a cross-flow NF system, no measurable fouling took place for the transmembrane pressure 3 bar (Fig. 4), indicating that the concept of critical flux is applicable in the present study. In a first step, the critical flux for irreversibility (70 L h−1m−2) and the corresponding critical pressure (3.4 bar,Fig. 7)
were determined. Above these critical conditions, operating points corresponding to low fouling rate and sufficiently high flux during a long term operation were then considered. The threshold pressure has been searched but not determined due to a lack of experimental data. However, if it exists, it would have been located in the range 3.4– 10 bar. Operating in this pressure range should lead to acceptable fouling rate and flux decline. For example, at 5 bar, a high initial flux (97 L h−1m−2) was followed by a relatively acceptable permeability loss
around 0.26 L h−2m−2 bar−1 until a steady state was reached at
67 L h−1m−2.
During the filtrations conducted in the pressure range 10–35 bar, a limiting flux was observed (33 L h−1m−2, seeFig. 7) which is much less
than the critical flux. Through the characterization of the fouling layer after filtration (Section 3.3), we found that this flux behaviour is the result of a combination of colloidal silica and organics fouling and calcium phosphate scaling.
These results seem to show that there are two fouling stages leading to various flux behaviours in the same water matrix. The early fouling stage at 5 bar led to a pseudo stable flux, the value of which is close to Jci. The permeability loss rate was acceptable in this fouling stage as we
discussed above. These observations are in accordance with the results of Tang and Leckie[29]. In their work, the membrane was fouled by humic acid in synthetic solution using the same membrane as in the present study (the NE 70). Fouling at 5 bar could then be linked to colloidal silica and organics accumulation.
On the other hand, severe fouling stage at higher pressures (10– 35 bar) resulted in a pseudo table flux (limiting flux) that is rather lower than Jci. According to the results obtained during the fouling
layer characterization and considering that calcium phosphate scaling can lead to severe flux decline during nanofiltration[7,46], the sharp
Table 3
EDX elements’ analysis at different locations on fouled membrane surfaces.
Samples 1 2 3 4 Average
Main element Weight % from different locations
Silicon 0 2.4 0 0 0.6 Phosphorus 24.6 26.6 23.2 28.8 25.8 Calcium 50.3 53.7 57.4 54.6 54 Chromium 4.8 5.0 0 7.6 4.3 Iron 4.7 4.9 0 0 2.4 Sulphur 0 0 19.3 9.8 14.6
Fig. 11. Evolution of irreversible fouling resistance 〇 and ions accumulated mass: Ca2+■, PO
43-◆ on the membrane with increasing applied pressure during recirculation
decline of the pseudo stable flux from 67 to 33 L h−1m−2(at 5–10 bar)
can be attributed to the occurrence of scaling.
A method which can correlate the flux behaviour and fouling stages is discussed. The increase in operating transmembrane pressure plays an essential role in the development of scaling. After a positive variation of pressure, flux temporarily increases, expectedly causing a more serious polarization concentration and greater ionic concentra-tion on the membrane surface. In case the ionic concentraconcentra-tion on the membrane surface is beyond the solubility limit of scaling salts (calcium and phosphate in the present study), scaling occurs. Moreover, in the present study we assumed that the early state fouling layer on the membrane surface could play an important role in inducing scaling. This early state fouling layer possibly serves as a “nucleation site” for scaling[47,48], resulting from an enhancement of salt concentration polarization on the membrane surface, by hindering the back-diffusion of salt ions[49]. Consequently, one assumption is that there is a transition fouling layer which can be characterized by a transition fouling resistance above which scaling occurs and fouling turns from a limited to a severe state. Corresponding to this transition resistance, we propose in this section the estimation of the permeability before scaling Ls. Once the observed permeability is below Ls, scaling
starts to form.
There are two scaling pathways in membrane systems: bulk (homogeneous) and surface (heterogeneous) crystallizations[50–52]. In the present study, the bulk crystallization pathway was not observed (scaling did not occur at pressures of 3–5 bar). Moreover, the 0.2 m s−1
experimental velocity is in the range of a low velocity, which is in favour of surface crystallization, according to the study of Lee and Lee[53]. We therefore consider that in our system, the main scaling mechanism is surface crystallization. Scaling due to surface crystallization can be described by the surface blockage fouling mechanism. The membrane surface may be blocked by the lateral growth of crystals meaning that only a permeate flux can pass through the membrane surface that is not occupied by crystals [53,54]. Fig. 12 shows the foulants on the membrane surface with and without scaling.
The permeability just reached before scaling occurrence, defined as permeability before scaling Ls, corresponds to a flux Jsonly affected by
the colloidal silica and organics fouling. Jscan be described as:
J ΔP = = s L μ ΔP μ(R +R+R ) s p p m s rf (12)
where µp and Rm are the viscosity of the permeate (Pa s) and the
membrane resistance (m−1) respectively, R
sis the irreversible
transi-tion fouling resistance, which is related to colloidal silica and organics fouling; Rrfis the reversible fouling resistance that corresponds to the
concentration polarization.
When a scaling layer is formed according to a surface blockage mechanism, assuming that the area occupied by crystals is completely
impermeable, the flux could be expressed as follows:
J ΔP μ R A A ΔP μ R A A A = = − a p m free m p m m oc m (13)
where Ja is the permeate flux estimated from the surface blockage
model, Amis the membrane active area, Afreeand Aocare the membrane
areas unoccupied and occupied by surface crystals, respectively. With the assumption that the thickness of the crystal formed on the membrane surface is constant[55], the Aoccould be defined as follows:
AOC=βmS (14)
where β (m2mg−1) is the area occupied per mass unit and m s(mg) is
the weight of the scaling layer formed directly on the membrane surface.
When scaling occurs (at a pressure of 10–35 bar), the flux declines, due to the colloidal fouling layer, the relative concentration polariza-tion and surface crystals hindering. This flux can be represented by combining Eqs.(12) and (13):
J L μ ΔP ΔP μ R R R A A A = = ( + + ) − b b p p m s rf m oc m (15)
where Jbis the flux combining two fouling mechanisms (colloidal silica
and organics in addition to scaling).
According to Eqs.(12) and (15), the reduction of permeability by surface crystallization superimposed on the colloidal silica and organics layer can be expressed as follows:
L L J J A A A = = − b s b s m OC m (16)
where Lb is the permeability combining two mechanisms (colloidal
silica and organics fouling and scaling); Lsis the permeability before
scaling (corresponding to Rs). When the permeability is lower than Ls,
scaling occurs.
Combining Eqs.(14) and (16), Lbcan be written as:
L L A βm L = − + b s m s s (17) This function provides the relationship between the permeability before scaling Ls, the permeability combining two fouling mechanisms
Lb, and the weight of the scaling layer directly formed on the
membrane surface. mscan be estimated from the mass balance during
the filtration. Lbcan be obtained from the filtration with square-wave
filtration method. Thus, from this relationship, the permeability before scaling Lscan be evaluated.
Considering that a fouling combining organics deposition and scaling occurs from 10 to 35 bar, the observed permeability during the filtrations at 10, 15, 25 and 35 bar corresponds to Lb. This
permeability can be estimated from the pseudo stable flux at a certain pressure and the stable flux after the negative variation of applied pressure according to the experimental procedure (Fig. 13). For example, Lbat 10 bar can be evaluated from the slope of the straight
line joining the pseudo stable fluxes at 10 bar and 5 bar*. Moreover, due to this procedure, the determined value of Lbis not impacted by the
concentration polarization and reversible fouling. Consequently, Ls
which is calculated from Lb doesn’t include reversible fouling. The
relationship between the permeability before scaling (Ls) and the
fouling transition resistance (Rs) can be then written as follows:
L μ R R = 1 ( + ) s p m s (18)
As shown inFig. 13, the first permeability of 3.42 L h−1m−2bar−1
(the left-hand dashed slope) is Lbafter reaching the pseudo stable flux
at 10 bar. The following values are the permeability reached at 15, 25 and 35 bar.
In sections 3.2.3, we showed that the increase in irreversible fouling resistance (from 10 to 35 bar) is directly linked to the accumulation of
calcium and phosphate on the membrane surface. As a consequence, to estimate the weight of the scaling layer on the membrane surface (ms),
the accumulated masses of Ca2+and PO
43-were calculated for the 10–
35 bar pressure range and shown inTable 4.
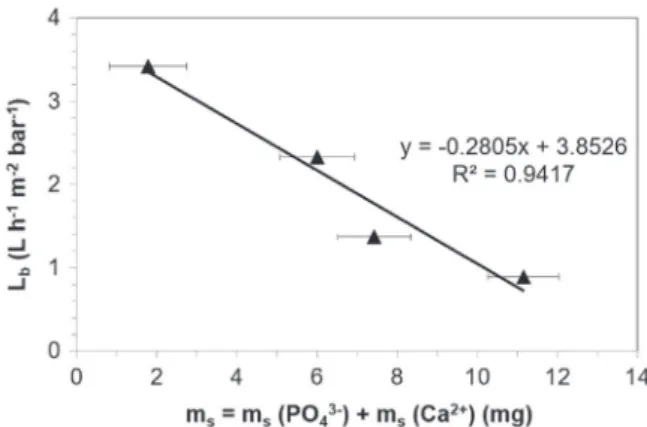
Fig. 14illustrates a linear relationship between the accumulated mass of Ca2+and PO
43-and Lbpermeability combining two fouling
mechanisms. From this linear relationship, the permeability before scaling Lsis calculated as 3.85 L h−1m−2bar−1.
With the initial permeability and the estimated value of perme-ability before scaling (Ls), a working diagram showing the flux
behaviour versus the operating pressure was proposed. This diagram defines three separated regions: a non-fouling region A, a region of fouling by organics B and a scaling region C.Fig. 15shows these three regions and the experimental value of fluxes as a function of trans-membrane pressure. The non-fouling region A is enclosed on the left by the average initial permeability. The region B in between pure water permeability and permeability before scaling (Ls) corresponds to
conditions for which colloidal silica and organics fouling was observed. Finally, fluxes in the region C on the right-hand side of Ls(region of
scaling) indicates that scaling occurs. The location of Lsis in
accor-dance with the experimental flux behaviour. Scaling occurs between 5 and 10 bar’ pressure in this study.
The estimation of Ls and of the critical flux then enabled a NF
working diagram to be drawn which can be a new tool to optimise operating conditions. During the continuous nanofiltration process, filtration at an initial flux lower than the critical flux for irreversibility (region A) can be a strategy to totally prevent the membrane from irreversible fouling. When the flux is observed in region B colloidal fouling can be expected. We assume, even if we were unable to determine it, that the threshold flux should be located in this region corresponding to a relatively acceptable fouling rate. If the flux approaches the scaling region, some actions such as adjusting feed pH, adding anti-scaling substances and even cleaning the membrane could be considered to prevent the development of scaling, which induces low limiting flux. It should be noted that the permeability before scaling is obtained for a specific feed water composition, effects of water matrix and the verification of the model will be discussed in subsequent publications.
5. Conclusions
During the filtration in a cross-flow NF system of hospital waste-water after MBR (MBR permeate), no fouling was detected at low transmembrane pressure (3 bar), indicating that the concept of critical flux is applicable in the present study. The critical flux for irreversibility (70 L h−1m−2) and the corresponding critical pressure (3.4 bar) were
then determined using the square-wave filtration method. Above these critical conditions, operating points corresponding to low fouling rate and sufficiently high flux during a long term operation were considered. The threshold pressure and related flux were searched by critical flux data conversion. Our results suggest, even if a value for the threshold pressure could not be determined, that it would be located in the range 3.4–10 bar. Operating in this pressure range should lead to acceptable fouling rate and flux decline. More pressure stages such as 1 bar intervals 1 between 3 and 5 bar could be interesting to obtain the exact value of threshold pressure in further work.
When the initial fluxes exceeded the critical flux for irreversibility, two pseudo stable flux behaviours were observed, versus the applied pressure, due to different fouling mechanisms in the complex water matrix used in this study. On one hand, a limiting flux value which is lower than that of the critical flux was obtained for pressures equal to, or higher than 10 bar. The low pseudo stable flux in this pressure range was linked to a severe fouling stage, combining the effect of colloidal silica and organics fouling and calcium phosphate scaling. On the other hand, in low pressure range of 5 −10 bar, before reaching the limiting flux, the pseudo stable flux tends to the value of the critical flux. In these conditions limited fouling occurs, involving solely colloidal silica and organics accumulation. Based on these results, a method which can correlate flux behaviours and fouling mechanisms was discussed and permeability before scaling (Ls) was defined and calculated. The
estimation of critical flux and permeability before scaling allows the
Fig. 13. Experimental permeability measurement, the continuous line - is initial permeability of membrane; bold points are the first pseudo stable fluxes reached at a certain pressure; the crosses are the stable fluxes reached after negative variation of pressure (5 bar*, 10 bar*, 15 bar*, 25 bar* inFig. 4).
Table 4
Experimental permeability and accumulated mass of ions on the membrane. Pressure ( bar) Lb(L h−1m−2bar−1) ms= ms(Ca2+) + ms(PO43-) (mg)
10 3.42 1.79
15 2.33 6.01
25 1.37 7.43
35 0.89 11.16
Fig. 14. Relationship between Ca2+and PO43-accumulated mass on membrane and Lb
permeability combining two fouling mechanisms.
Fig. 15. Experimental pseudo stableflux as a function of transmembrane pressure and the location of the critical flux for irreversibility ✖ in working diagram of NF considering the initial permeability and the permeability before scaling.
fouling stages of the membrane to be defined and quantified. Acknowledgments
The authors would like to thank the China Scholarship Council for its financial support. They are also grateful to the coordinator of the PANACEE Project supported by the French National Research Agency, for allowing them access to hospital wastewater. The authors would also like to thank the Polymem company for providing the membrane modules and Ms Chambers for the proofreading of the paper. References
[1]J.E. Drewes, C. Bellona, M. Oedekoven, P. Xu, T.-U. Kim, G. Amy, Rejection of wastewater-derived micropollutants in high-pressure membrane applications leading to indirect potable reuse, Environ. Prog. 24 (2005) 400–409. [2]A. Verliefde, E. Cornelissen, G. Amy, B. Van der Bruggen, H. van Dijk, Priority
organic micropollutants in water sources in Flanders and the Netherlands and assessment of removal possibilities with nanofiltration, Environ. Pollut. 146 (2007) 281–289.
[3]J. Radjenovic, M. Petrovic, F. Ventura, D. Barcelo, Rejection of pharmaceuticals in nanofiltration and reverse osmosis membrane drinking water treatment, Water Res. 42 (2008) 3601–3610.
[4]A.I. Schafer, A.G. Fane, T.D. Waite, Nanofiltration-Principles and Application, Elsevier Advance Technology, Oxford, 2005.
[5]B. Espinasse, P. Bacchin, P. Aimar, Filtration method characterizing the reversi-bility of colloidal fouling layers at a membrane surface: analysis through critical flux and osmotic pressure, J. Colloid Interface Sci. 320 (2008) 483–490.
[6]A.S. Al-Amoudi, Factors affecting natural organic matter (NOM) and scaling fouling in NF membranes: a review, Desalination 259 (2010) 1–10.
[7]A. Antony, J.H. Low, S. Gray, A.E. Childress, P. Le-Clech, G. Leslie, Scale formation and control in high pressure membrane water treatment systems: a review, J. Membr. Sci. 383 (2011) 1–16.
[8]R.D. Cohen, R.F. Probstein, Colloidal fouling of reverse osmosis membranes, J. Colloid Interface Sci. 114 (1986) 194–207.
[9] P.Bacchin, Formation et résistance au transfert d′un dépôt de colloïdes sur une membrane d′ultrafiltration, Université Paul Sabatier - Toulouse III, 1994. [10] P. Bacchin, P. Aimar, V. Sanchez, Model for colloidal fouling of membranes, AIChE
J. 41 (1995) 368–376.
[11] R.W. Field, D. Wu, J.A. Howell, B.B. Gupta, Critical flux concept for microfiltration fouling, J. Membr. Sci. 100 (1995) 259–272.
[12] R.W. Field, G.K. Pearce, Critical, sustainable and threshold fluxes for membrane filtration with water industry applications, Adv. Colloid Interface Sci. 164 (2011) 38–44.
[13] P. Bacchin, P. Aimar, R.W. Field, Critical and sustainable fluxes: theory, experi-ments and applications, J. Membr. Sci. 281 (2006) 42–69.
[14] B. Espinasse, P. Bacchin, P. Aimar, On an experimental method to measure critical flux in ultrafiltration, Desalination 146 (2002) 91–96.
[15] P. Aimar, R. Field, Limiting flux in membrane separations: a model based on the viscosity dependency of the mass transfer coefficient, Chem. Eng. Sci. 47 (1992) 579–586.
[16] P. Bacchin, B. Espinasse, P. Aimar, Distributions of critical flux: modelling, experimental analysis and consequences for cross-flow membrane filtration, J. Membr. Sci. 250 (2005) 223–234.
[17] D. Wu, J.A. Howell, R.W. Field, Critical flux measurement for model colloids, J. Membr. Sci. 152 (1999) 89–98.
[18] M. Mänttäri, M. Nyström, Critical flux in NF of high molar mass polysaccharides and effluents from the paper industry, J. Membr. Sci. 170 (2000) 257–273. [19] P. Le-Clech, V. Chen, T.A.G. Fane, Fouling in membrane bioreactors used in
wastewater treatment, J. Membr. Sci. 284 (2006) 17–53.http://dx.doi.org/ 10.1016/j.memsci.2006.08.019.
[20] P. Le Clech, B. Jefferson, I.S. Chang, S.J. Judd, Critical flux determination by the flux-step method in a submerged membrane bioreactor, J. Membr. Sci. 227 (2003) 81–93.
[21] J. Luo, L. Ding, Y. Wan, M.Y. Jaffrin, Threshold flux for shear-enhanced nanofiltration: experimental observation in dairy wastewater treatment, J. Membr. Sci. 409– 410 (2012) 276–284.
[22] J.M. Ochando-Pulido, M. Stoller, M. Bravi, A. Martinez-Ferez, A. Chianese, Batch membrane treatment of olive vegetation wastewater from two-phase olive oil production process by threshold flux based methods, Sep. Purif. Technol. 101 (2012) 34–41.
[23] J.M. Ochando-Pulido, G. Hodaifa, A. Martinez-Ferez, Threshold flux measurement of an ultrafiltration membrane module in the treatment of two-phase olive mill wastewater, Chem. Eng. Res. Des. 92 (2014) 769–777.
[24] M. Stoller, M. Bravi, A. Chianese, Threshold flux measurements of a nanofiltration membrane module by critical flux data conversion, Desalination 315 (2013) 142–148.
[25] M. Stoller, J.M. Ochando-Pulido, About merging threshold and critical flux concepts into a single one: the boundary flux, Sci. World J. 2014 (2014) 1–8.
[26] M. Stoller, J.M. Ochando-Pulido, The Boundary Flux Handbook: A Comprehensive Database of Critical and Threshold Flux Values for Membrane Practitioners, Elsevier, Amsterdam, 2014.
[27] Y.E. Rayess, C. Albasi, P. Bacchin, P. Taillandier, M. Mietton-Peuchot, A. Devatine, Cross-flow microfiltration of wine: effect of colloids on critical fouling conditions, J. Membr. Sci. 285–386 (2011) 177–186.
[28] P. Bacchin, A possible link between critical and limiting flux for colloidal systems: consideration of critical deposit formation along a membrane, J. Membr. Sci. 228 (2004) 237–241.
[29] C.Y. Tang, J.O. Leckie, Membrane independent limiting flux for RO and NF membranes fouled by humic acid, Environ. Sci. Technol. 41 (2007) 4767–4773. [30] C.Y. Tang, Y.-N. Kwon, J.O. Leckie, The role of foulant–foulant electrostatic
interaction on limiting flux for RO and NF membranes during humic acid fouling— Theoretical basis, experimental evidence, and AFM interaction force measurement, J. Membr. Sci. 326 (2009) 526–532.
[31] I. Quesada, Y. Gonzalez, S. Schetrite, H. Budzinski, K. Le Menach, O. Lorain, N. Manier, S. Ait Aissa, P. Pandard, D. Abdelaziz, J.-M. Canonge, C. Albasi, PANACÉE: évaluation du fonctionnement d′un bioréacteur à membranes immergées traitant des effluents hospitaliers d′oncologie, Rev. Sci. Eau. 28 (2015) 1.
[32] F.A. DiGiano, S. Arweiler, J.A. Riddick, Alternative tests for evaluating NF fouling, J. Am. Water Works Assoc. (2000) 103–115.
[33] M. Mänttäri, M. Nyström, Critical flux in NF of high molar mass polysaccharides and effluents from the paper industry, J. Membr. Sci. 170 (2000) 257–273. [34] C.Y. Tang, Y.-N. Kwon, J.O. Leckie, Effect of membrane chemistry and coating layer
on physiochemical properties of thin film composite polyamide RO and NF membranes: I. FTIR and XPS characterization of polyamide and coating layer chemistry, Desalination 242 (2009) 149–167.
[35] C. Jarusutthirak, G. Amy, J.-P. Croué, Fouling characteristics of wastewater effluent organic matter (EfOM) isolates on NF and UF membranes, Desalination 145 (2002) 247–255.
[36] T. Nguyen, L. Fan, F.A. Roddick, J.L. Harris, A comparative study of microfiltration and ultrafiltration of activated sludge-lagoon effluent, Desalination 236 (2009) 208–215.
[37] A.S. Gorzalski, O. Coronell, Fouling of nanofiltration membranes in full- and bench-scale systems treating groundwater containing silica, J. Membr. Sci. 468 (2014) 349–359.
[38] N. Lee, G. Amy, J.-P. Croué, H. Buisson, Identification and understanding of fouling in low-pressure membrane (MF/UF) filtration by natural organic matter (NOM), Water Res. 38 (2004) 4511–4523.
[39] L. Vaculikova, E. Plevova, S. Vallova, I. Koutnik, Characterization and differentia-tion of kaolinites from selected czech deposits using infrared spectroscopy and differential thermal analysis, Acta Geodyn. Geomater. 8 (2011) 59–67. [40] M. Muroya, Correlation between the formation of silica skeleton structure and
Fourier transform reflection infrared absorption spectroscopy spectra, Colloids Surf. Physicochem. Eng. Asp. 157 (1999) 147–155.
[41] E.J. Elzinga, D.L. Sparks, Phosphate adsorption onto hematite: an in situ ATR-FTIR investigation of the effects of pH and loading level on the mode of phosphate surface complexation, J. Colloid Interface Sci. 308 (2007) 53–70.
[42] A. Ślósarczyk, C. Paluszkiewicz, M. Gawlicki, Z. Paszkiewicz, The FTIR spectroscopy and QXRD studies of calcium phosphate based materials produced from the powder precursors with different CaP ratios, Ceram. Int. 23 (1997) 297–304. [43] in: T. Theophile, (Ed.), Infrared Spectroscopy – Materials Science, Engineering and
Technology, InTech, 2012
[44] D.L. Kronmiller, What every reverse osmosis water system manager should know, Desalination 98 (1994) 401–411.
[45] F.H. Butt, F. Rahman, U. Baduruthamal, Characterization of foulants by autopsy of RO desalination membranes, Desalination 114 (1997) 51–64.
[46] S. Mattaraj, C. Jarusutthirak, C. Charoensuk, R. Jiraratananon, A combined pore blockage, osmotic pressure, and cake filtration model for crossflow nanofiltration of natural organic matter and inorganic salts, Desalination 274 (2011) 182–191. [47] S.-H. Yoon, C.-H. Lee, K.-J. Kim, A.G. Fane, Effect of calcium ion on the fouling of
nanofilter by humic acid in drinking water production, Water Res. 32 (1998) 2180–2186.
[48] Q. Li, M. Elimelech, Organic fouling and chemical cleaning of nanofiltration membranes: measurements and mechanisms, Environ. Sci. Technol. 38 (2004) 4683–4693.
[49] E.M.V. Hoek, M. Elimelech, Cake-enhanced concentration polarization: a new fouling mechanism for salt-rejecting membranes, Environ. Sci. Technol. 37 (2003) 5581–5588.
[50] S. Lee, J. Kim, C.-H. Lee, Analysis of CaSO4 scale formation mechanism in various nanofiltration modules, J. Membr. Sci. 163 (1999) 63–74.
[51] A.G. Pervov, Scale formation prognosis and cleaning procedure schedules in reverse osmosis systems operation, Desalination 83 (1991) 77–118.
[52] R.P. Sear, Estimation of the scaling of the nucleation time with volume when the nucleation rate does not exist, Cryst. Growth Des. 13 (2013) 1329–1333. [53] S. Lee, C.-H. Lee, Effect of operating conditions on CaSO4 scale formation
mechanism in nanofiltration for water softening, Water Res 34 (2000) 3854–3866. [54] J. Borden, J. Gilron, D. Hasson, Analysis of RO flux decline due to membrane
surface blockage, Desalination 66 (1987) 257–269.
[55] J. Gilron, D. Hasson, Calcium sulphate fouling of reverse osmosis membranes: flux decline mechanism, Chem. Eng. Sci. 42 (1987) 2351–2360.