O
pen
A
rchive
T
OULOUSE
A
rchive
O
uverte (
OATAO
)
OATAO is an open access repository that collects the work of Toulouse researchers and
makes it freely available over the web where possible.
This is an author-deposited version published in :
http://oatao.univ-toulouse.fr/
Eprints ID : 18871
The contribution was presented at WSSC 2016 :
https://www.irit.fr/~Georges.Da-Costa/wssc/
To link to this article URL :
http://dx.doi.org/10.1109/UIC-ATC-ScalCom-CBDCom-IoP-SmartWorld.2016.0161
To cite this version :
De Courchelle, Inès and Labit, Yann and Monteil,
Thierry and Guerout, Tom A data model for supplying a Data Center with
several energy sources. (2016) In: IEEE Workshop on Smart and Sustainable
City (WSSC 2016) associated to the International Conference IEEE UIC
2016, 18 July 2016 (Toulouse, France).
Any correspondence concerning this service should be sent to the repository
administrator:
[email protected]
A data model for supplying a Data Center with
several energy sources
Ines de Courchelle
IRIT Universit´e de Toulouse, 118 Route de Narbonne, F-31062 TOULOUSE CEDEX 9 LAAS-CNRS, Universit´e de Toulouse, CNRS, UPS, Toulouse, France Email: [email protected] Thierry Monteil LAAS-CNRS, Universit´e de Toulouse, CNRS, INSA, Toulouse, France Email: [email protected] Yann Labit LAAS-CNRS, Universit´e de Toulouse, CNRS, UPS, Toulouse, France Email: [email protected] Tom Guerout LAAS-CNRS, Universit´e de Toulouse, CNRS, Toulouse, France Email: [email protected]
Abstract—This article presents a data modeling to handle the power flow in a smartgrid. The power flow is studied through RenewSim. It is a simulator dedicated to supply a Data Center which is simultaneously fed by renewable and non-renewable energy sources. Nowadays, the use and optimization of the energy consumption of Data Centers are very broad research areas. The development of energy called “green” and how to use them smartly, becomes an inevitable problematic because of the current ecological considerations. RenewSim is based on the use of several energy sources (electricity supplier, solar panels and batteries). This simulator has a center decision controller. It aims at make clever decisions for the use of heterogeneous sources. The contribution of this article is a data modeling which allows the power redirection by labeled and prioritized the different sources of energy. The priorities and the labels are presented and the results obtained are exposed.
I. INTRODUCTION
Areas such as home automation, smart buildings and cities want to operate largely with renewable energies. Smart grids are part of the implementation of such smart buildings throw Micro-grid. It aims at saving energy and reducing the CO2 foot print. In this article, the use of a smart-grid allows to feed in a green way a Data Center. Nowadays, the running cost of a Data Center is more and more expensive. The utilisation rate and users needs increase day after day (streaming, social network, and in clouds with the on-demand services). It becomes a real problematic because the “brown” energies (non-renewable) do not have an endless capacity. For example, the “Universit´e de Paul Sabatier III” has consumed 148300MWh PE1 in one
year between 2008 and 20092. The European Commision has
estimated the Data Center consumption in the european area at 56 billion kW in 2008 and has evaluated 104 billion for 20203. The use of different energy sources introduces some
1PE, Primary Energy is used in reference value to represent the energy
footprint of a building. The energy vector weighting is set by countries for each sector. Ep = f inalenergies × energiesvector
2http://developpementdurable.cpu.fr/img/documents/universites/Fiche de
synthese Universite Paul Sabatier Toulouse III.pdf
3“Code of Conduct on Data Center Energy Efficiency” by the European
Commission in October 2008
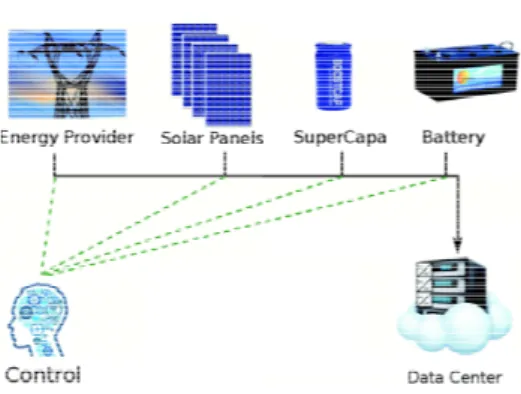
Fig. 1. A SmartGrid Energy sources management example
new problematics related to the energy storage. Many works exist on the battery for load/unload models and their usage in a Data Center [1] [2]. This storage form may be considered as a safety for shortage case. Also, the use of solar panels is complex and unpredictable because it depends on the weather variations.
The Fig.1 presents an architecture example of a Data Center supplied by heterogeneous energy sources and storage capacities. The control component aims at being able to take clever decision for the use of heterogeneous energy sources. Those observations are the article base dedicated to a data modeling for RenewSim.
Ours challenges are to connect several energy sources and destinations together, how to redirect the energy produce by the solar panel in the smartgrid (Battery, Data Center, or supplier), and to take a decision to satisfy the energy cost at the weakest rate. The problematic is how to characterize the heterogeneous electricity sources to make a decision to reduce electricity bills ? In this article we will focus on a modeling for the heterogeneous electricity component. The paper is organized as follows: the Section 2 is the related work on the current simulators and the green Data Center supplied by batteries or solar panels. The section 3 describes
smartgrid, green energies and the simulator RenewSim. The section 4 presents our modeling for RenewSim. The section 5 is the methodology used. The section 6 evaluates the model. Then, the section 7 is the balance sheet of this article and the further works.
II. RELATEDWORK
Our approach with RenewSim is to feed a Data Center with renewable energy in a smart way, thanks to a control module. This one aims at optimizing the electric flow and the scheduler of a center of calculation in an electrical net-work powered by heterogeneous sources. Simgrid [3] is a simulator for distributed applications heterogeneous in dis-tributed environments. It allows the execution of algorithms for scheduling a Data Center[4], the simulation of storage in a Data Center [5] and the use of the DVFS (Dynamic Voltage and Frequency Scaling) in a Data Center [6]. This simulator is in the improvement of the actual application in the field of grids. CloudSim[7], historically based on GridSim[8], is a simulator Cloud Computing of type infrastructure as a Service (IaaS). The architecture of the Data Center is finely modeled and can be easily modified by the user. It integrates the virtualization (migration), the addition of investment policies as well as the energy costs and operation induced. Another version [9] also integrates the DVFS. This simulator is purely dedicated to the internal management of the Data Center. GreenHadoop [10] is an evolution of GreenSolt [11]. It allows the simulation of wind turbines, solar panels. GreenHadoop incorporates the principle of dynamic replication of data to ensure the availability of the latter. A module of the prediction of energy production is present with which the charging of the batteries is managed and incorporates five levels of priorities of jobs (Very High, High, Normal, Low, and very low). These two simulators [11], [10] allow to optimize the consumption of the solar energy but do not propose to optimize simultaneously the energy consumption, and the financial cost. The Simulator RenewSim is a simulator dedicated to the use of solar panels. It uses states to qualify the servers in a Data Center, as in GreenHadoop. It is a simulator dedicated to the co-simulation. It will therefore be able to integrate the version [9] of CloudSim.
III. A MICRO-GRID TO REDUCE THE ENERGY COST In this section, we will introduce RenewSim a simulator to supply a Data Center. It is a co-simulation tool based on a micro-grid architecture. RenewSim is a simulator for co-simulation based on the use of several energies (renewable or not). It uses batteries, solar panels and electricity suppliers. It aims at managing the power flow in a clever way between the several sources until the Data Center.
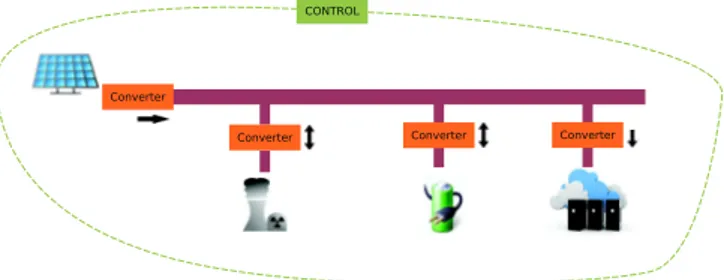
The Fig.2 presents an example of a RenewSim architecture. It is possible to plug several sources and destinations. The main source is the solar panels production and the main destination is the Data Center. Each element plugged to the bus is connected to a converter. Those are modules for the conversion of DC/DC or DC/AC. This micro-grid is supervised
Fig. 2. RenewSim Architecture
by a control module. His role is to find the best possible configuration for both management of the energy flow (feeding the Data Center) and scheduling tasks in the Data Center. This involves to manage the power, the power sold from the solar panels to the suppliers, the power bought or sold to the supplier based on its cost and also the load/unload of the battery. The allocation of tasks depends on their characteristics (CPU and memory capacity, priority, preemptive or not) and the total amount of available energy. The Data Center has the ability to turn on and off the servers and allows tasks migration. RenewSim aims at reducing the energy cost by studying the power flow and the Data Center demand in a decision block.
IV. AMODEL TO IMPROVERENEWSIM THE CONTROL MODULE
To improve the RenewSim simulator, two possibilities are conceivable: manage the different degrees of freedom or specify the intrinsic behaviour of each block (batteries, solar panels, Data Center, Electric suppliers). Here, the model is based on the first possibility.
A. Freedom degrees
The model aims at being an input of RenewSim to decide which solution costs more, costs less or for example uses more renewable energy. The power asked by the Data Center does not let us a lot freedom degrees. Solar production does not depend on the system. As the data center load, it is a system input and does not have freedom degrees. Production of solar panels depends on the weather and time of day. The freedom degrees will be thanks to the batteries and the electricity suppliers. The supplier price depends of time. During the night the electricity is cheaper than during the day. The degree of freedom is the power of solar panel destination which is stored on the batteries or sold to the power supplier or supplied to the Data Center. Currently, RenewSim promotes renewable energy. What would happen if he favored monetary gain to renewable energy? For example, by promoting the electric suppliers instead of using renewable energy to feed the data center, we get two different functions: night and day.
1) Night: purchase energy required to operate the data center, fully charge the batteries from the electrical suppliers.
2) Day: Sell to the suppliers the solar overproduction, use the battery in case of underproduction.
For exploiting all the freedom degree, we need to characterize each element: the batteries, the solar panels, the Data Center and the suppliers. The Data Center and the solar panels can only be respectively destination and source. The other could be sources, destination, backup or overflow. The interest of the system is to optimize energy flow. For example, if the system takes a very small amount of energy from the battery to the Data center, the power flow is not efficient and involves too much losses in terms of energy. However, if the system takes a lot of amount of energy from the battery, for example it will be more interesting at time t to take half from the battery and the other half from the supplier, because it could be smarter to keep a amount of energy in the battery.
B. Element Characterization
To take a faster decision based on the freedom degrees, each element of the micro-grid (Fig.2) except the decision module, is described by a model. An element can be a source of energy, a destination, a back-up and an overflow. The main source of RenewSim is solar panels. The destination is the main Data Center. The source and destination are inputs of RenewSim, they leave no degrees of freedom. One is the production Solar (Source) that depends on the weather and the day. The other is the Data Center Demand (Destination). The demand depends on the needs of users and servers at a timet. The batteries and the electric suppliers can be sources, destinations, overflow or backup. The backup allows to get power when the sources can-not answer the Data Center demand (under-production). The overflow allows to store energy when the sources provide more energy required to operate the Data Center (over-production). The table I below presents the modeling.
TABLE I
AMODELING EXAMPLE: HOW TO USE LESS BROWN ENERGY
Source Destination Backup Overflow
Solar Panels 1 0 0 0
Data Center 0 1 0 0
Battery 1 0 1 1
Supplier 0 0 2 2
Here, in Table I, the battery and solar panels supply the Data Center as sources. In case of under-production, the electric supplier (Backup = 1) feeds the Data Center. In case of over-production, we stock the excess energy in the battery (Overflow = 1). If the battery is full we sell energy to the electricity supplier (Overflow = 2).
TABLE II
AMODELING EXAMPLE: HOW TO FAVOR THE MONEY THAN THE RENEWABLE ENERGY BY DAY
Source Destination Backup Overflow
Solar Panels 1 0 0 0
Data Center 0 1 0 0
Battery 0 0 1 0
Supplier 0 0 2 1
TABLE III
AMODELING EXAMPLE: HOW TO FAVOR THE MONEY THAN THE RENEWABLE ENERGY BY NIGHT
Source Destination Backup Overflow
Solar Panels 1 0 0 0
Data Center 0 1 0 0
Battery 0 1 0 0
Supplier 1 0 0 0
The modulation in the tables II and III favor the money than the renewable energy. During the day, the model is as follow (II): RenewSim use the solar panels to supply the Data Center. If there is an over-production of energy (Data Center demand ≤solar panels production) the overfull is sold to the suppliers. If there is an under-production (Data Center demand ≥ solar panels production), the lack is taken from the backup 1. Here, it is the battery (unload). If the backup one is empty, the lack is taken from the backup 2 (purchase). Here, it is the supplier.
V. METHODOLOGY
This section presents the environment for the different results (Section VI).
A. Algorithm
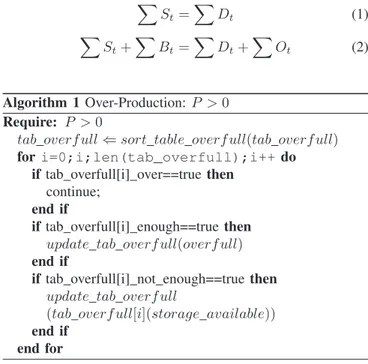
The destinations and the sources elements follow the equa-tion 1, with PSt is the sum of all the sources available at
timet, and PDt is the sum of all the destinations available
at time t. To guarantee the equation 1 in case of over and under production, the equation 2 addsPBt, the sum of all
the backup resources available at timet, and POt the sum
of all the overfull available. X St= X Dt (1) X St+ X Bt= X Dt+ X Ot (2) Algorithm 1 Over-Production:P > 0 Require: P > 0
tab overf ull ⇐ sort table overf ull(tab overf ull) for i=0;i;len(tab_overfull);i++ do
if tab overfull[i] over==true then continue;
end if
if tab overfull[i] enough==true then update tab overf ull(overf ull) end if
if tab overfull[i] not enough==true then update tab overf ull
(tab overf ull[i](storage available)) end if
end for
In the Algorithm 1, the sum of all the sources is greater than the destinations demand. This is an over-production. So,
for each overfull element, in order of priority, the algorithm stores the over-production. There are three cases: the overfull element is over, the overfull can take all the energies or the overfull can store a part of the over-production.
Algorithm 2 Under-Production:P < 0 Require: P < 0
tab backup ⇐ sort table backup(tab backup) for i=0;i;len(tab_backup);i++ do
if tab backup[i] empty==true then continue;
end if
if tab backup[i] enough==true then update tab backup(demand) end if
if tab backup[i] not enough==true then update tab backup
(tab overf ull[i](quantity available)) end if
end for
In the Algorithm 2, the sum of all the sources is lower than the destinations demand. This is an under-production. So, for each backup element, in order of priority, the algorithm takes the energy asked by the destination. There are three cases: the backup element is empty, the backup can offer all the energies or the backup can offer a part of the demand.
B. Study area
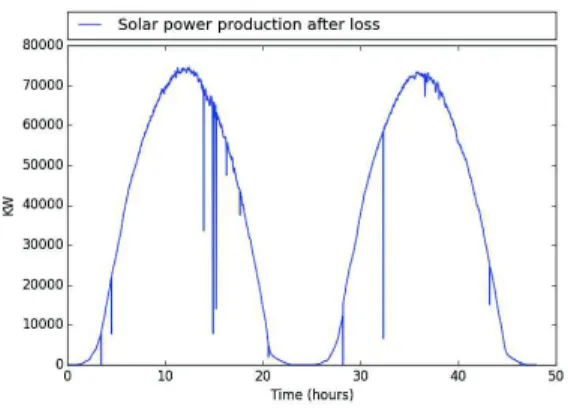
Fig. 3. RenewSim Architecture for the experimentation For the experiments, the micro-grid used is made of one supplier, one battery, a Data Center and a solar panels park. In the (Fig.3), CM1 to CM4 converters have the respective losses of 15%, 17%, 13% and 14%. The production of solar panels is derived from actual measurements. They come from ADREAM building4. For 48-hours, ADREAM solar
produc-4https://www.laas.fr/public/en/adream
tion provides 1648 measures. The Fig.4 shows two consecutive days of production with some production decline peaks. The decline peaks can be explained by cloud or bad weather at a timet.
Fig. 4. Solar panel production for the experiments
Fig. 5. RenewSim Entries
In Fig.5, the lower bell is the solar production panel after the converter (15% loss). Another input of the system is the Data Center demand (dashed curve). This demand is not known at each time t by the simulator. In the following experiments (section V), the energy costs of the supplier are the following: 0.2366e per kWh from 8pm to 8am (night) and 0.6173e per kWh from 8am to 9pm (day).
A(t) = Pee(t)/(1 − l) (3)
V (t) = V (t − 1) + Pee(t) × (1 − l) (4)
The power purchase and sale to the supplier is respectively modeled by the equations 3 and 4 with the power purchased and the power sold withA the power purchased, V the power sold, Pee the power for the supplier before the converter
module andl converter loss (CM4). The battery has a storage capacity of 10000 joules and a maximum power of 200 kW.
Eb(t) = Eb(t − 1) + Pbb×∆ (5)
Eb(t) = Eb(t − 1) − Pb×∆ (6)
The battery load and unload is respectively modeled by the equations 5 and 6, witht the time, ∆ conversion time interval from kW to joules, t the time, Pbb the power for the battery
after the converter module (CM2), andEbthe energy load into
the battery (joules).
VI. RESULTS
In this section, we experiment two different states of our model. The initial state of the solar panel and the power load required by the Data Center is given by the Fig.5
A. Experimentation 1: A renewable model
For this experiment, we used the following modeling: In TABLE IV
AMODELIZATION EXAMPLE: HOW TO USE LESS BROWN ENERGY
Source Destination Backup Overflow
Solar Panels 1 0 0 0
Data Center 0 1 0 0
Battery 0 0 1 1
Supplier 0 0 2 2
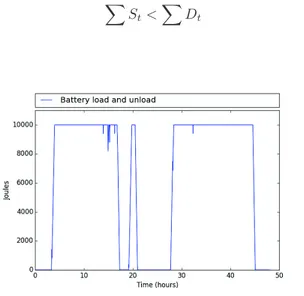
this case, RenewSim will purchase energy to the supplier only when the sum of all the destinations are upper than the sources (Equation 7) and also if the battery (backup element) is empty or cannot offer all the power (Algorithm 2).
X St<
X
Dt (7)
Fig. 6. Exp 1: Battery load at time t during two days
The battery load is represented by Fig.6. The battery can supply the Data Center when the solar production slows down. This is the same noise around t= 15 to 17 hours we saw inFig.4).
Fig. 7. Exp 1: Sum of all the power purchase to supplier during two days In Fig.7, this is the sum of all the power purchase to the supplier.
B. Experimentation 2: An economic model
For this experiment, we used the following modelings seen previously: the Table II and III (section IV. B).
Fig. 8. Exp 2: Battery load at time t during two days
In this case, RenewSim will always use the battery as a source during the day. It will store energy on it only during the night. RenewSim will never use the battery during the night (Fig.8), because the electricity is cheaper. It will buy the necessary power to supplier when it is cheaper by night (Fig.9). All the over-full of energy is sold to the supplier to earn money. During the second day, RenewSim never bought energy. The battery and the production is enough to feed the Data Center. In the Fig.8, the battery aims at supply the Data Center when the solar panel production is lower (15 hours).
VII. CONCLUSION
The goal of this paper was to present a model to represent each element of a micro-grid and improve the RenewSim con-trol module. The model allows a modular architecture which aims at make clever decision for the use of heterogeneous sources. The contribution of this article is a data model which allows the power redirection by labeled and prioritized the different sources of energy. In the future, this model will allow us to include predictions model and learning machine into the control module of RenewSim. Through two distinct scenarios, the control module can take decision in a purpose: use more renewable energy, or purchased as a low price. This model generalize all the process where we can move the power load, for example, water heater in apartment. There is a sociological study to do in the future to see what is the acceptability of the load shift and how to increase it. The more we come to accept people to increase it, the more we will have savings. Other scenario are possible as use more brown energy in order to keep the battery load for next hour. The RenewSim expansion prospects consist include: multi-objective optimization studies via heuristics, algorithms of learning and predictions (production / use) as well as most successful models. Finally, the purpose of RenewSim is also to be a co-simulation tool allowing communication simulators dedicated to each component.
ACKNOWLEDGMENT
The authors would like to thank the Universit´e Paul Sabatier for the funding of a PhD grant within the framework of neOCampus project.
REFERENCES
[1] D. S. Palasamudram, R. K. Sitaraman, B. Urgaonkar, and R. Urgaonkar, “Using batteries to reduce the power costs of internet-scale distributed networks,” in Proceedings of the Third ACM Symposium on Cloud
Computing, p. 11, ACM, 2012.
[2] V. Kontorinis, J. Sampson, L. E. Zhang, B. Aksanli, H. Homayoun, T. S. Rosing, and D. M. Tullsen, Battery Provisioning and Associated Costs
for Data Center Power Capping. Department of Computer Science and Engineering, University of California, San Diego, 2012.
[3] H. Casanova, A. Legrand, and M. Quinson, “Simgrid: A generic frame-work for large-scale distributed experiments,” in Computer Modeling
and Simulation, 2008. UKSIM 2008. Tenth International Conference on, pp. 126–131, april 2008.
[4] W. Liu, H. Li, W. Du, and F. Shi, “Energy-aware task clustering scheduling algorithm for heterogeneous clusters,” in Proceedings of the
2011 IEEE/ACM International Conference on Green Computing and Communications, pp. 34–37, IEEE Computer Society, 2011.
[5] A. Lebre, A. Legrand, F. Suter, and P. Veyre, “Adding storage simu-lation capacities to the simgrid toolkit: Concepts, models, and api,” in
Cluster, Cloud and Grid Computing (CCGrid), 2015 15th IEEE/ACM International Symposium on, pp. 251–260, IEEE, 2015.
[6] J.-C. Charr, R. Couturier, A. Fanfakh, and A. Giersch, “Energy con-sumption reduction with dvfs for message passing iterative applications on heterogeneous architectures,” in Parallel and Distributed Processing
Symposium Workshop (IPDPSW), 2015 IEEE International, pp. 922– 931, IEEE, 2015.
[7] R. N. Calheiros, R. Ranjan, A. Beloglazov, C. A. F. De Rose, and R. Buyya, “Cloudsim: a toolkit for modeling and simulation of cloud computing environments and evaluation of resource provisioning algo-rithms,” Software: Practice and Experience, vol. 41, no. 1, pp. 23–50, 2011.
[8] R. Buyya and M. Murshed, “Gridsim: A toolkit for the modeling and simulation of distributed resource management and scheduling for grid computing,” Concurrency and computation: practice and experience, vol. 14, no. 13-15, pp. 1175–1220, 2002.
[9] T. Guerout, T. Monteil, G. D. Costa, R. N. Calheiros, R. Buyya, and M. Alexandru, “Energy-aware simulation with dvfs,” Simulation
Modelling Practice and Theory, vol. 39, pp. 76 – 91, 2013. S.I.Energy efficiency in grids and clouds.
[10] ´I. Goiri, K. Le, T. D. Nguyen, J. Guitart, J. Torres, and R. Bianchini, “Greenhadoop: leveraging green energy in data-processing frameworks,”
Proceedings of the 7th ACM european conference on Computer Systems, pp. 57–70, 2012.
[11] ´I. Goiri, K. Le, M. E. Haque, R. Beauchea, T. D. Nguyen, J. Guitart, J. Torres, and R. Bianchini, “Greenslot: scheduling energy consumption in green datacenters,” Proceedings of 2011 International Conference for
High Performance Computing, Networking, Storage and Analysis, p. 20, 2011.