ARTICLE
Sexually dimorphic roles for the type 2 diabetes-associated
C2cd4b
gene in murine glucose homeostasis
S. Neda Mousavy Gharavy1&Bryn M. Owen2&Steven J. Millership1,3,4&Pauline Chabosseau1&Grazia Pizza1&
Aida Martinez-Sanchez1&Emirhan Tasoez5&Eleni Georgiadou1&Ming Hu1&Nicholas H. F. Fine1&David A. Jacobson6& Matthew T. Dickerson6&Olof Idevall-Hagren7&Alex Montoya3&Holger Kramer3&Zenobia Mehta1&
Dominic J. Withers3,4&Nikolay Ninov5&Paul J. Gadue8&Fabian L. Cardenas-Diaz8&Céline Cruciani-Guglielmacci9& Christophe Magnan9&Mark Ibberson10&Isabelle Leclerc1&Marianne Voz11&Guy A. Rutter1,12
Received: 11 June 2020 / Accepted: 28 October 2020 # The Author(s) 2021
Abstract
Aims/hypothesis Variants close to the VPS13C/C2CD4A/C2CD4B locus are associated with altered risk of type 2 diabetes in genome-wide association studies. While previous functional work has suggested roles for VPS13C and C2CD4A in disease development, none has explored the role of C2CD4B.
Methods CRISPR/Cas9-induced global C2cd4b-knockout mice and zebrafish larvae with c2cd4a deletion were used to study the role of this gene in glucose homeostasis. C2 calcium dependent domain containing protein (C2CD)4A and C2CD4B constructs tagged with FLAG or green fluorescent protein were generated to investigate subcellular dynamics using confocal or near-field microscopy and to identify interacting partners by mass spectrometry.
Results Systemic inactivation of C2cd4b in mice led to marked, but highly sexually dimorphic changes in body weight and glucose homeostasis. Female C2cd4b mice displayed unchanged body weight compared with control littermates, but abnormal glucose tolerance (AUC, p = 0.01) and defective in vivo, but not in vitro, insulin secretion (p = 0.02). This was associated with a marked decrease in follicle-stimulating hormone levels as compared with wild-type (WT) littermates (p = 0.003). In sharp contrast, male C2cd4b null mice displayed essentially normal glucose tolerance but an increase in body weight (p < 0.001) and fasting blood glucose (p = 0.003) after maintenance on a high-fat and -sucrose diet vs WT littermates. No metabolic disturbances were observed after global inactivation of C2cd4a in mice, or in pancreatic beta cell function at larval stages in C2cd4a null zebrafish. Fasting blood glucose levels were also unaltered in adult C2cd4a-null fish. C2CD4B and C2CD4A were partially localised to the plasma membrane, with the latter under the control of intracellular Ca2+. Binding partners for both included secretory-granule-localised PTPRN2/phogrin.
Conclusions/interpretation Our studies suggest that C2cd4b may act centrally in the pituitary to influence sex-dependent circuits that control pancreatic beta cell function and glucose tolerance in rodents. However, the absence of sexual dimorphism in the
* Guy A. Rutter g.rutter@imperial.ac.uk
1
Section of Cell Biology and Functional Genomics, Department of Metabolism, Digestion and Reproduction, Imperial College London, Hammersmith Hospital, London, UK
2 Section of Investigative Medicine, Department of Metabolism,
Digestion and Reproduction, Imperial College London, Hammersmith Hospital, London, UK
3
MRC London Institute of Medical Sciences, Imperial College London, Hammersmith Campus, London, UK
4
Institute of Clinical Sciences, Faculty of Medicine, Imperial College London, London, UK
5 DFG-Center for Regenerative Therapies, Technische Universität
Dresden, Dresden, Germany
6 Department of Molecular Physiology and Biophysics Vanderbilt
University, Nashville, TN, USA 7
Department of Medical Cell Biology, Uppsala University, Uppsala, Sweden
8 Children’s Hospital of Philadelphia, CTRB, Philadelphia, PA, USA
9
Regulation of Glycemia by Central Nervous System, BFA, UMR 8251, CNRS Université de Paris, Paris, France
10 Vital-IT Group, SIB Swiss Institute of Bioinformatics,
Lausanne, Switzerland 11
Laboratory of Zebrafish Development and Disease Models, University of Liège (ULg), Liège, Belgium
12 Lee Kong Chian School of Medicine, Nanyang Technological
University, Singapore, Singapore https://doi.org/10.1007/s00125-020-05350-x
impact of diabetes risk variants argues for additional roles for C2CD4A or VPS13C in the control of glucose homeostasis in humans.
Data availability The datasets generated and/or analysed during the current study are available in the Biorxiv repository (www.
biorxiv.org/content/10.1101/2020.05.18.099200v1). RNA-Seq (GSE152576) and proteomics (PXD021597) data have been
deposited to GEO (www.ncbi.nlm.nih.gov/geo/query/acc.cgi?acc=GSE152576) and ProteomeXchange (www.ebi.ac.uk/pride/ archive/projects/PXD021597) repositories, respectively.
Keywords C2CD4A/B . Follicle-stimulating hormone . Genome-wide association studies . Glucose homeostasis . Type 2 diabetes
Abbreviations
C2CD C2 calcium dependent domain containing protein E2 Oestradiol
eQTL Expression quantitative trait locus ER Endoplasmic reticulum
FSH Follicle-stimulating hormone GFP Green fluorescent protein GWAS Genome-wide association study HFD High-fat and -sucrose diet IA-2 Insulinoma-associated protein 2
IMPC International Mouse Phenotyping Consortium KREBH HEPES-buffered Krebs-Ringer medium LH Luteinising hormone
PTPRN Receptor-type tyrosine-protein phosphatase-like N RC Regular chow
Syt1 Synaptotagmin-1
TIRF Total internal reflection of fluorescence
WT Wild-type
Introduction
Type 2 diabetes risk is the product of both environmental and genetic factors. More than 200 loci have now been described as affecting the diabetes risk score [1]. While most of these impact insulin secretion [2], the identified variants usually lie within or between neighbouring genes and in only a few cases have the causal gene(s) been firmly established [3,4].
Chromosome 15q hosts a risk locus close to the VPS13C, C2CD4A and C2CD4B genes [5], which is associated with impaired proinsulin processing. Deletion of Vps13c (which encodes a lipid transporter [6]) selectively from the pancreatic
beta cell [7] has little effect on glucose homeostasis in the mouse. This finding argues that the other genes at this locus contribute towards the effect(s) of risk variants in humans.
Previous expression quantitative trait locus (eQTL) studies have demonstrated altered expression of VPS13C and C2CD4A [7], as well as C2CD4B [8], in islets from individ-uals carrying risk alleles. Recently, Kycia et al [9] reported that expression of C2CD4B, but not C2CD4A or VPS13C, was affected by risk alleles. However, the direction of effects of risk alleles differed between the reports, with expression lowered uniquely in females in the study of Mehta et al [7] but increased in the study by Kycia et al [9]. However, both of these studies involved relatively small sample numbers. These limitations emphasise the need for interventional studies involving gene inactivation in tractable model systems, such as rodents or fish, as an alternative means of understanding the roles of these genes in metabolic homeostasis.
C2CD4A and C2CD4B (also called NLF1 and NLF2) [10] encode low molecular mass (39 kDa) proteins of presently unknown function. Unlike the homologous C2CD4C gene (expressed from a distinct locus on chromosome 19 in Homo sapiens), neither C2 calcium dependent domain containing protein (C2CD)4A nor C2CD4B possess a canonical Ca2+ /phos-pholipid-binding C2-domain [11]. A partly functional Ca2+ -binding domain may be present in C2CD4B (see electronic supplementary material [ESM] Fig.1). Given the essential role for Ca2+in the control of insulin and other hormone secretion [12], an interaction with Ca2+might provide a means through which C2CD4A or C2CD4B influence these processes.
Originally described in endothelial cells as having a largely nuclear distribution, and inducible by cytokines [10], the role of C2CD4B has not been explored previously in beta cells or other metabolically relevant cell types. Nonetheless, silencing of the single homologous C2cd4a/b gene in the zebrafish (Danio rerio) led to a decrease in beta cell mass [13]. In contrast, silencing of the Drosophila melanogaster C2CD4A homologue, spenito (also known as nito), increased circulat-ing levels of the insulin-like molecule IIp2HF [14]. Inactivation of C2cd4c has no detectable effect on pancreatic development in mice [11].
A recent study [15] has indicated that regulation of C2cd4a expression in islets by forkhead box O1 (FOXO1) may be important for the control of insulin secre-tion. Thus, animals inactivated selectively in the beta cell for C2cd4a displayed abnormal insulin secretion in response to exposure to glucose plus arginine (the effects on secretion stimulated by glucose alone were not report-ed), as well as glucose intolerance in vivo and abnormal expression of beta cell signature and ‘disallowed’ genes [16]. However, these studies used the Ins2-dependent rat insulin promoter (RIP) to drive Cre expression, a strategy complicated by off-target recombination and ectopic expression of human growth hormone [17].
Here, we use the more direct approach of inactivating C2cd4b and C2cd4a globally in the mouse, and of deleting their homologue, C2cd4a, in the developing zebrafish (D. rerio), to explore the role of these genes in glucose homeostasis.
Methods
For detailed Methods and the reagents list, please refer to the
ESMMethods.
Mouse generation C2cd4a (C2cd4a-Del1724-EM1-B6N) and C2cd4b (C2cd4bem2Wtsi) mouse strains were generated at the International Mouse Phenotyping Consortium (IMPC;www.
mousephenotype.org/data/genes/MGI:3645763 and www.
mousephenotype.org/data/genes/MGI:1922947, respectively;
accessed November 2020), using CRISPR/Cas9. In vitro fertilisation was performed into super-ovulated C57BL/6 females, producing mixed B6N/B6J offspring, which were subsequently inter-crossed. Lean and fat mass were measured using an EchoMRI Quantitative Whole Body Composition analyser (Zinsser Analytic, USA) on unanaesthetised animals. The high-fat and -sucrose diet (HFD) contained 58% fat and 25% carbohydrate (catalogue no. D12331; Research Diets, New Brunswick, NJ, USA), given from 6 weeks of age. Glucose homeostasis Animals were fasted overnight prior to experiments. For IPGTTs, glucose (1 g/kg body weight) was injected into the abdomen. In OGTTs, glucose (2 g/kg body weight) was administered directly into the gut via oral gavage. Blood glucose levels were recorded using an automatic glucometer (Accucheck; Roche Diagnostics, Burgess Hill, UK). For insulin tolerance tests, animals were fasted for 5 h prior to experiments. Insulin was injected into the abdomen: Male and female mice (both C2cd4b-null and WT) on the regular chow (RC) diet were injected with a 1 or 0.75 U/kg body weight of insulin, respectively. HFD-fed male and female mice were injected with 1.5 or 0.75 U/kg body weight of insulin, respectively. Blood glucose levels were measured post injection at the time points indicated. To measure insulin secretion in vivo, animals were fasted overnight and glucose (3 g/kg body weight) was injected into the abdomen. Blood insulin levels were measured using an Ultra-Sensitive Mouse Insulin ELISA Kit (90,080; Crystal Chem, Zaandam, the Netherlands).
Measurement of circulating hormone levels For assessment of follicle-stimulating hormone (FSH) and luteinising hormone (LH), gonadectomy was conducted under isoflurane anaesthe-sia [18]. Plasma levels of testosterone and oestradiol (E2) were determined by ELISA (Enzo Life Sciences, Exeter, UK, and
BioVision, Cambridge BioScience, Cambridge, UK, respec-tively) 2 weeks later [18].
Insulin secretion from isolated islets Islet isolation [19] and measurements of insulin secretion [20] were measured as described previously, using ten size-matched islets incubated in triplicate in HEPES-buffered Krebs-Ringer medium (KREBH) and either 3 mmol/l glucose, 17 mmol/l glucose or 20 mmol/l KCl at 37°C. Insulin was measured using an Insulin Ultra-Sensitive Kit (Mercodia, Uppsala, Sweden). Generation of C2CD4A and C2CD4B FLAG- and -green fluores-cent protein-tagged constructs Human C2CD4A and C2CD4B cDNA sequences were cloned in-frame into plasmid P3XFLAG-CMV-14 (Addgene, www.addgene.org) to provide a C-terminal 3×FLAG epitope tag. Green fluorescent protein (GFP)-tagged proteins were generated by inserting the human C2CD4A and C2CD4B cDNA sequences into the C-terminus of GFP using plasmid pEGFP-C1 (Addgene). C2CD4A/B intracellular translocation INS1(832/13) cells [21] were grown on coverslips and transfected with either GFP-tagged C2CD4A, C2CD4B or synaptotagmin-1 (Syt1)-containing constructs. At 24 h post transfection, cells were incubated for 1 h at 37°C with aerated KREBH solution. Cells were confirmed to be mycoplasma free prior to experiments.
Study approval All mouse in vivo procedures were conducted in accordance with the UK Home Office Animal (Scientific Procedures) Act of 1986 (Project licence PA03F7F0F to IL) and approved by the Imperial College Animal Welfare and Ethical Review Body. All zebrafish work was approved by the ethical committee of the University of Liège (protocol no. 13-1557) or under European Union and German laws (Tierschutzgesetz), and with the approval of the TU Dresden and the Landesdirektion Sachsen (approval licence number: TVV 45/2018).
Zebrafish maintenance and generation of transgenic lines Zebrafish (D. rerio) were obtained from the Zebrafish International Resource Center (Zfin, Eugene, OR, USA) or from the European Zebrafish Resource Center at Karlsruhe Institute of Technology (www.ezrc.kit.edu/), and then bred at the host laboratory (University of Liège [ULg], Liège, Belgium, or Universität Dresden, Dresden, Germany, respectively). Genetically modified zebrafish were developed at the host laboratories. Zebrafish were raised and cared for according to standard protocols [22]. The transgene rs7163757C-cfos:eGFP was constructed by introducing a 1303 bp region carrying the genome-wide association study (GWAS)-identified gene variant rs7163757-C upstream of a c-fos minimal promoter driving enhanced GFP (EGFP)
expression (pGW_cfos-EGFP) [23, 24] via Gateway LR recombination (Invitrogen, Thermo Fisher Scientific, Waltham, MA, USA). The transgene was injected into zebrafish embryos and GFP expression patterns were analysed during development, in adulthood and in offspring, using a confocal microscope.
Whole-mount in situ hybridisation and immunohistochemis-try on zebrafish embryos Double fluorescent whole-mount in situ hybridisations were performed as previously described [25] with the antisense RNA probe for the different genes prepared as described [26]. Immunohistochemistry on whole-mount embryos was performed as previously described [27]. The proteins analysed were GFP, insulin, glucagon and somatostatin. Images were acquired with a confocal micro-scope and processed with ImageJ (https://imagej.nih.gov/ij/;
accessed December 2019) and figureJ (https://imagej.net/ FigureJ).
Pericardial glucose injection and live imaging in zebrafish larvae Glucose injection and live imaging of zebrafish primary islets were performed as described previously [28].
Blood glucose measurements in adult zebrafish Adult zebrafish were fasted for 24 h before glucose measurements. For post-prandial measurements, fasted fish were fed with live brine shrimp. Blood was collected from euthanised fish with a microcapillary needle and glucose levels were measured using a glucometer.
Immunofluorescence analysis of pancreatic slices Mouse pancreases were dissected at 24 or 25 weeks of age. Pancreases were fixed in 4% (wt/vol.) paraformaldehyde and embedded in paraffin for the measurement of insulin and glucagon via immunofluorescence.
Homogeneous time-resolved fluorescence (HTRF) assay The Insulin Ultra-Sensitive Kit (ref. 62IN2PEH; Cisbio, Codolet, France) was used according to the manufacturer’s instructions to measure released or total insulin levels in mouse samples. Each sample was measured in duplicate and incubated with europium cryptate and XL665 antibodies overnight before measuring the Fӧrster resonance energy transfer (FRET) efficiency.
Intracellular free [Ca2+] measurements Mouse islets were isolated and incubated with fluo2-AM (10 μmol/l; Teflabs, Austin, TX, USA) diluted in a KREBH buffer containing 3 mmol/l glucose. Imaging was performed essentially as described previously [29].
Whole-cell voltage-clamp electrophysiology Measurements were performed on single beta cells isolated from wild-type
(WT) and C2cd4b-knockout mice. Starting from a holding potential of−80 mV, and voltage-dependent Ca2+ currents (VDCC) currents were generated through application of sequential 10 mV depolarising steps ranging from−70 mV to 70 mV (500 ms).
Sample preparation for RNA sequencing Islets from five male mice/genotype at 22 weeks of age on regular chow diet were used for RNA purification. Generation of double-stranded cDNA and library construction were performed using NEBNext Ultra II Directional RNA Library Prep Kit for Illumina (NEB, Hitchin, UK). Sequencing was performed by the Imperial BRC Genomics Facility (Imperial College London, UK) as 75 bp paired end reads on a HiSeq4000 according to Illumina specifica-tions. Data are archived in the GEO repository (www.
ncbi.nlm.nih.gov/geo/query/acc.cgi?acc=GSE152576).
Quantitative reverse transcription PCR Quantitative reverse transcription PCR (RT-qPCR) was performed in triplicate using SYBR Green PCR Master Mix (Applied Biosystems, Foster City, CA, USA) and primers for mouse C2cd4a and β-actin genes.
Immunofluorescence and imaging for subcellular localisations Rodent (MIN6 [15], INS1[832/13] [21]) or human (EndoCβH1 [30]) beta cell lines (previously confirmed as being mycoplasma free) were cultured for 12 h or 24 h post transfection (with C2CD4A- or C2CD4B-FLAG tagged constructs) and fixed in 4% (wt/vol.) paraformalde-hyde (Sigma-Aldrich, Gillingham, Dorset, UK) before being incubated with anti-FLAG antibodies. Images were collected by a spinning disk microscope and a confocal inverted microscope.
Immunoprecipitation and mass spectrometry Mycoplasma-free MIN6 cells grown in standard culture conditions [31] were transfected in duplicate with FLAG-tagged-C2CD4A or -C2CD4B expressing plasmids or with a FLAG tag-only expressing plasmid using Lipofectamine 2000 (Thermo Fisher Scientific). Immunoprecipitation and affinity purification-MS (AP-MS) analysis were performed, as previously described [32], with minor modifications. The mass spectrometry prote-omics data have been deposited to the ProteomeXchange repository (www.ebi.ac.uk/pride/archive/projects/
PXD021597).
Statistical analysis Blinding was carried out for all mouse in vivo experiments. Data were analysed using GraphPad Prism 8.0 (San Diego, CA, USA; www.graphpad.com/
scientific-software/prism/, accessed 1 December 2019). A
p-value <0.05 was considered significant.
Results
C2CD4A and C2CD4B expression in mouse and human islets Human C2CD4A and C2CD4B are 83% homologous. Like their murine homologues, the two human genes are predicted to have evolved from a common ancestor (see phylogenetic tree, ESM Fig. 2a). Conservation of genomic architecture (synteny) at this locus argues for direct homology between the human and murine forms of each gene. The zebrafish (D. rerio) possesses two C2cd4-like genes homologous to H. sapiens and Mus musculus: C2cd4a and C2cd4c (ESM Fig. 2a). Scrutiny of gene expression databases (http://
Biogps.org, accessed March 2020), and previous
publications [33,34], reveals approximately tenfold higher levels of C2cd4b than C2cd4a mRNA in mouse islets and purified mouse beta cells (ESM Table1). In contrast, roughly equal levels of C2CD4A and C2CD4B mRNA are present in human islets [35] and purified beta cells [36]. Expression of both genes was detected in the pituitary in both human and mice (data source: GTEx data, analysed in The Human Protein Atlas; www.proteinatlas.org/ENSG00000198535-C2CD4A/
tissue and
www.proteinatlas.org/ENSG00000205502-C2CD4B/tissue; accessed November 2020). C2cd4a and
C2cd4b were both upregulated in pancreatic islets of high-fat-diet–fed DBA2J mouse model of diabetes following 30 and 90 days of the diet vs RC-fed mice (ESM Fig. 3a,b) [37]. No evidence of C2CD4A or C2CD4B upregulation was observed in the islets of individuals with type 2 diabetes vs normoglycaemic control participants [38].
Examination of the human VPS13C/C2CD4A/C2CD4B locus revealed multiple regulatory elements (Fig.1), consis-tent with recent findings [9]. A SNP, rs7163757, has recently been shown by fine mapping as the likely causal variant for type 2 diabetes risk at this locus [9]. Correspondingly, CRISPR activation (CRISPRa) or CRISPR interference (CRISPRi) at the rs7163757 site has the most marked effects on neighbouring genes [39], consistent with this being the effector variant (SNP). To explore in more detail the potential role of the enhancer around the diabetes risk variant rs7163757 [9] and whether it may play a role in gene expres-sion in disease-relevant tissues (notably the islet and brain/ pituitary), we introduced a reporter bearing 1303 bp nucleo-tides of the human sequence into the zebrafish genome, controlling the production of GFP from a minimal cFos promoter (ESM Fig. 2b). Expression was restricted to the endocrine pancreas and brain at all stages (ESM Fig.2c,e), and was detected in all islet cell types, most strongly in delta cells (ESM Fig.2d). No significant differences were seen in the pattern of expression in embryos expressing either the C-or the T variants, with 10% (8/80 C-or 10/100, respectively) of embryos showing fluorescence in the pancreas.
Whole-mount fluorescent in situ hybridisation of 30 h-post-fertilisation (hpf) embryos revealed that endogenous
c2cd4a is expressed in the forebrain (ESM Fig.2f), ventral spinal cord (ESM Fig.2g) and pancreas (ESM Fig. 2c,h). Double fluorescent in situ hybridisation revealed presence of the c2cd4a transcript in sst2+, ins+and gcgb+cells (ESM Fig.
2d,i–k).
Role ofc2cd4a in the zebrafish larvae Zebrafish possess a single gene, C2cd4a (formerly c2cd4ab), that is homologous to the two mammalian counterparts (ESM Fig. 2a). As a convenient proxy for insulin secretion in the larvae of fish inactivated for c2cd4a or in WT controls (ESM Fig.4 a,b), glucose-stimulated Ca2+dynamics were monitored in vivo by imaging the fluorescence of a gCaMP6 transgene. Fasting and postprandial blood glucose levels were compara-ble between WT and c2cd4a mutant animals (ESM Fig.4c) and glucose-induced Ca2+ changes did not differ between genotypes (ESM Fig.4d–h). These findings argue against a
role for c2cd4a in beta cell function during zebrafish development.
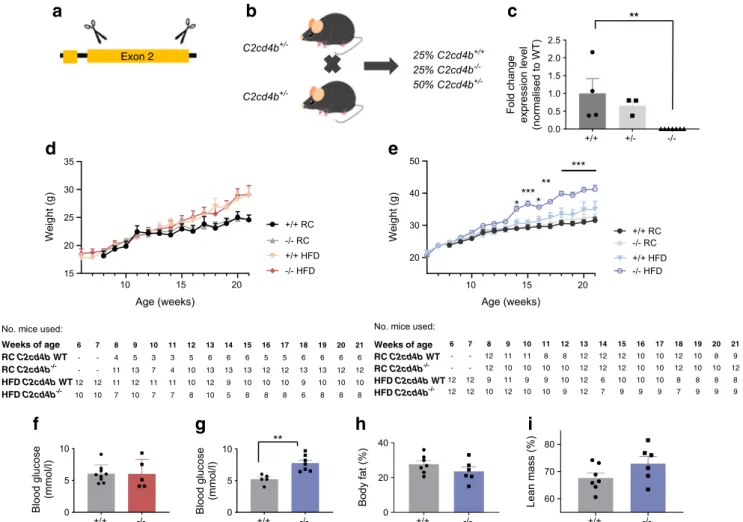
Effects ofC2cd4b deletion on glucose homeostasis are more marked in female than male mice Given the substantially higher expression of C2cd4b than C2cd4a in mouse islets (ESM Table1), we studied mice in which the former gene was deleted (Fig.2a). Inter-crossing of heterozygous animals produced pups at the expected Mendelian ratio (Fig.2b) and resulted in complete elimination of C2cd4b mRNA from isolated islets of C2cd4b−/−mice (Fig.2c). Female C2cd4b-null mice gained weight at the same rate as control littermates whether maintained on RC or a HFD (Fig. 2d) and no
differences were apparent in fed or fasting blood glucose levels either on an RC diet (ESM Fig.5a,c) or an HFD (Fig.
2fand ESM Fig.5e).
Beta cell mass, as assessed by histochemical analysis of pancreatic slices, was unaffected by deletion of C2cd4b in both females (ESM Fig.6a–d) and males (ESM Fig.6e–h).
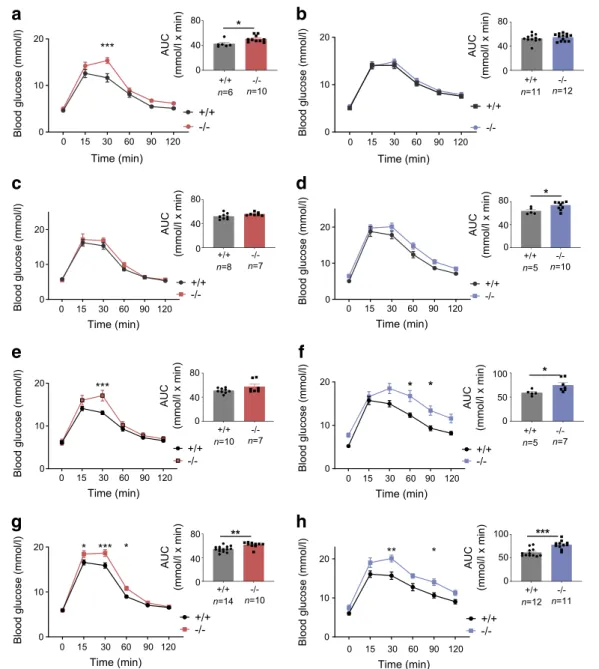
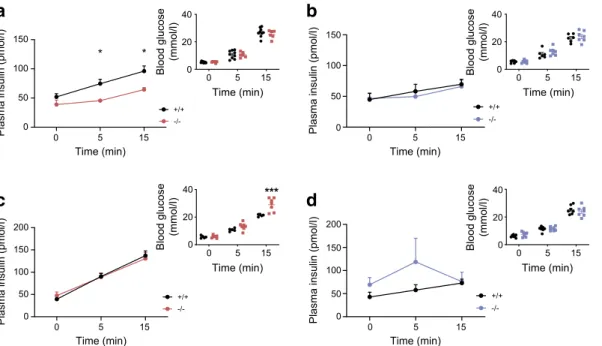
Intraperitoneal glucose tolerance was examined for animals maintained on an RC diet or HFD from 8 to 22 weeks of age. Females displayed abnormalities at 12, 20 and 22 weeks of age when fed an RC diet (ESM Fig.7a,c,e,g), and at 8 and 23 weeks on an HFD (ESM Fig.8a,c,e and Fig.3a; p < 0.001 at 22 weeks on an HFD) vs control littermates. While oral glucose tolerance was normal on in RC-fed female mice vs controls (Fig.3c), defects were observed in HFD-fed mice (Fig.3g). For female mice on the RC diet, these changes were associated with defective insulin secretion in vivo (Fig. 4a; p = 0.02), as also indicated by unchanged insulin levels after glucose injection despite elevated plasma glucose levels in female knockout mice maintained on an HFD (Fig. 4c). Furthermore, insulin sensitivity was not different between C2cd4b null and WT female mice (ESM Fig.9a,c).
When maintained on an RC diet, male C2cd4b null mice gained weight at the same rate as WT littermates. When main-tained on an HFD, in contrast to females, male mutant mice gained substantially more weight from 14 weeks of age vs WT littermates (Fig. 2d,e; p < 0.001 betwee18 and 21 weeks of age), and had raised fasting blood glucose levels (Fig.2g; p = 0.03). However, significant differences in body fat and lean mass were not apparent (Fig. 2h,i) vs WT mice. Intraperitoneal glucose tolerance was normal in males
Regulatory elements 50 kb VPS13C C2CD4A C2CD4B RNA 90 -0 _ ATAC-seq 30 -0 _ MED1 80 -0 _ H3K4me3 70 -0 _ H3K27ac 40 -0 _ NKX2.2 50 -0 _ FOXA2 40 -0 _ NKX6.1 40 -0 _ PDX1 60 -0 _ 0 0.1 0.2 0.3 0.4 0.5 0.6 0.7 Functional PP rs7163757 Fig. 1 Genomic context of type 2
diabetes variants in the VPS13C/ C2CD4A/C2CD4B locus. SNP at rs7163757 is located in an open chromatin region between C2CD4A and C2CD4B, as assessed by Assay for Transposase-Accessible Chromatin sequencing (ATAC-seq) data. Chromatin
immunoprecipitation and next generation sequencing (ChIP-seq) data reveals binding sites for transcription factors involved in the development and function of beta cells, including forkhead box protein A2 (FOXA2), NK2 homeobox 2 (NKX2.2), NK6 homeobox 1 (NKX6.1) and pancreatic and duodenal homeobox 1 (PDX1). MED1, mediator complex subunit 1. Functional PP, functional posterior probability. Data from
maintained on an RC diet at most ages examined, with genotype-dependent differences only at 16 weeks (ESM Fig.
7b,d,f,h and Fig. 3b). Although unaltered in younger male mice after maintenance on an HFD (ESM Fig.8b,d,f), glucose tolerance was impaired at 23 weeks of age by C2cd4b deletion (Fig.3f,h) as compared with controls.
As observed in females, insulin sensitivity (ESM Fig.9b,d) was unaltered in male C2cd4b-null mice vs littermate controls. Effects of C2cd4b deletion on beta cell function in vitro Glucose-stimulated insulin secretion was not different between islets from WT or C2cd4b-null female mice maintained on an RC diet (ESM Fig.10a) but was slightly elevated in those from female null mice maintained on an HFD (ESM Fig. 10c).
Likewise, in the isolated islets from female C2cd4b-null mice, we observed no alterations in glucose or KCl-stimulated stim-ulated Ca2+dynamics (ESM Fig.11a,b) or in beta cell–beta cell
coupling (ESM Fig. 11c–f). Correspondingly, no changes in
voltage-activated Ca2+currents were apparent in patch-clamp recordings (ESM Fig.12a–c).
In line with the above findings, massive parallel sequenc-ing (RNA-Seq) of islets from C2cd4b−null or control animals confirmed the lowering of C2cd4b expression in islets of null mice vs WT mice, and revealed a significant (~75%) increase in C2cd4a expression (ESM Table 2), though this was not confirmed by independent qRT-PCR analysis (data not shown). However, no other mRNAs were significantly affect-ed by C2cd4b deletion (ESM Table2).
10 15 20 20 30 40 50 Age (weeks) Weight (g) +/+ RC-/- RC +/+ HFD -/- HFD * *** * ** *** 10 15 20 15 20 25 30 35 Age (weeks) Weight (g) +/+ RC -/- RC +/+ HFD -/- HFD
a
b
d
e
c
+/+ -/-0 5 10 +/+ -/-0 5 10 Blood glucose (mmol/l) Blood glucose (mmol/l) **f
g
C2cd4b +/-25% C2cd4b+/+ 25% C2cd4b -/-50% C2cd4b +/-C2cd4b +/-+/+ -/-0 20 40 Body fat (%)h
i
+/+ +/- -/-0.0 0.5 1.0 1.5 2.0 2.5 Fold change expression level (normalised to WT) ** +/+ -/-60 70 80 Lean mass (%) Weeks of age 6 7 8 9 10 11 12 13 14 15 16 17 18 19 20 21 RC C2cd4b WT - - 4 5 3 3 5 6 6 6 5 5 6 6 6 6 RC C2cd4b-/- - - 11 13 7 4 10 13 13 13 12 12 13 13 12 12 HFD C2cd4b WT12 12 11 12 11 11 10 12 9 10 10 10 9 10 10 10 HFD C2cd4b-/- 10 10 7 10 7 7 8 10 5 8 8 8 6 8 8 8 Weeks of age 6 7 8 9 10 11 12 13 14 15 16 17 18 19 20 21 RC C2cd4b WT - - 12 11 11 8 8 12 12 12 10 10 12 10 8 9 RC C2cd4b-/- - - 12 10 10 10 10 12 12 12 10 10 12 10 10 12 HFD C2cd4b WT12 12 9 11 9 9 10 12 6 10 10 10 8 8 8 8 HFD C2cd4b-/- 12 12 10 12 10 10 9 12 7 9 9 9 7 9 9 9No. mice used: No. mice used:
Exon 2
Fig. 2 Characterisation of C2cd4b-null mice. (a) C2cd4b global null
mice (C2cd4bem2Wtsi) were generated by the IMPC. Using CRISPR/
Cas9, the encoding exon from murine C2cd4b (exon 2) was deleted. (b)
C2cd4b+/−(heterozygous) animals were setup as breeding pairs and the
WT (C2cd4b+/+) and homozygous (C2cd4b−/−) littermates were studied.
(c) RT-qPCR was performed on RNA from isolated islets and showed a significant decrease in C2cd4b mRNA levels in homozygous animals
(p=0.0092). C2cd4b+/+ n=4, C2cd4b+/− n=3, C2cd4b−/− n=7.
**p<0.01, unpaired Student’s t test. (d, e) Changes in weight of
C2cd4b+/+and C2cd4b−/−female (d) and male (e) mice over time on
an RC diet or HFD. RC: female (F)+/+n=3–6; F−/−n=4–13; male (M)+/+
n=8–12; M−/−n=10–12. HFD: F+/+n=9–12, F−/−n=5–10–12; M+/+n=6–
12, M−/−n=7–12. (f, g) Fasting blood glucose level in female (f) and male
(g) mice on an HFD were measured at 23 weeks of age. F+/+n=9; F−/−
n=5; M+/+n=5; M−/−n=7. (h, i) Percentage of body fat (h) and lean mass
(i) in males maintained on an HFD at 20 weeks of age. *p<0.05, **p<0.01, ***p<0.001, mixed-effect analysis, RC-fed WT vs RC-fed mutant mice or HFD-fed WT vs HFD-fed mutant mice at each time point
(d, e), or Student’s t test (c, f–i). Data were assessed for significance using
an unpaired Student’s t test or two-way ANOVA where two genotypes
Glucose or KCl-stimulated insulin secretion from isolated islets were also unaltered in male C2cd4b-null mice vs litter-mate controls (ESM Fig.10b,d).
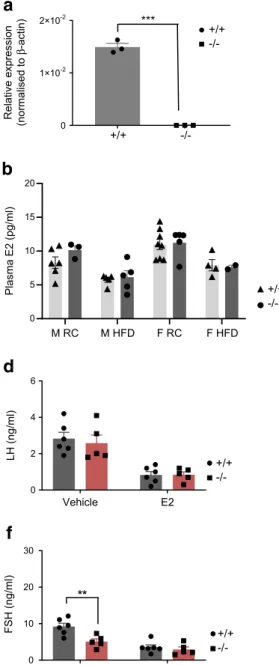
Effects ofC2cd4b deletion on pituitary function Given the absence of clear defects in insulin secretion in isolated C2cd4b-null islets, and the expression of both C2cd4a and C2cd4b in the pituitary (data source: GTEx data, analysed in The Human Protein Atlas; www.proteinatlas.org/
ENSG00000198535-C2CD4A/tissueand www.proteinatlas.
org/ENSG00000205502-C2CD4B/tissue; Fig. 5a), we next
assessed whether deletion of this gene might affect the production of sex hormones and, thus, provoke gender-specific differences in glucose homeostasis. E2 and testoster-one levels were unaltered in both male and female C2cd4b-null mice maintained on an RC diet or HFD vs WT animals (Fig. 5b,c). In order to remove the negative feedback loop through which hormones secreted from the gonads repress 0 15 30 60 90 120
0 10 20
Blood glucose (mmol/l)
Blood glucose (mmol/l)
Blood glucose (mmol/l)
Blood glucose (mmol/l)
Blood glucose (mmol/l)
Blood glucose (mmol/l)
Blood glucose (mmol/l)
Blood glucose (mmol/l)
+/+ -/-*** +/+ n=11 -/-n=12 +/+ n=5 -/-n=10 +/+ n=5 -/-n=7 +/+ n=12 -/-n=11 +/+ n=6 -/-n=10 +/+ n=8 -/-n=7 +/+ n=10 -/-n=7 +/+ n=14 -/-n=10 0 40 80 AUC (mmol/l x min) 0 40 80 AUC (mmol/l x min) 0 40 80 AUC (mmol/l x min) 0 40 80 AUC (mmol/l x min) *
a
b
0 15 30 60 90 120 0 15 30 60 90 120 0 15 30 60 90 120 0 10 20 +/+-/-c
d
0 10 20 +/+ -/-*** 0 10 20 +/+ -/-* * * 0 10 20 +/+ -/-* * *** ** 0 10 20 +/+ -/-** * 0 50 100 AUC (mmol/l x min) 0 50 100 AUC (mmol/l x min) ***e
f
0 10 20Time (min) Time (min)
0 15 30 60 90 120 0 15 30 60 90 120
Time (min) Time (min)
0 15 30 60 90 120 0 15 30 60 90 120
Time (min) Time (min)
Time (min) Time (min) +/+ -/- 0 10 20 +/+ -/-*
g
h
0 40 80 AUC (mmol/l x min) 0 40 80 AUC (mmol/l x min)Fig. 3 C2cd4b-null mice display glucose intolerance in glucose tolerance tests (IPGTTs/OGTTs). (a, b) IPGTTs were performed on female (a) and male (b) mice maintained on an RC diet, at 22 weeks of age. (c, d) OGTTs were performed on C2cd4b-null and WT female (c) and male (d) mice on an RC, at 20 weeks of age. (e, f) IPGTTs were performed on C2cd4b-null and WT female (e) and male (f) mice maintained on an HFD, at 23 weeks of age. (g, h) OGTTs were performed on C2cd4b female (g) and male (h) mice on an HFD, at 20 weeks of age. AUC
analyses are also shown. The n values under bar graphs represent the number of animals used (the same number of samples were used for blood glucose and AUC graphs). *p<0.05, **p<0.01, ***p<0.001 vs mutant animal at same time point or as indicated. Blood glucose curves assessed
by two-way ANOVA with Bonferroni’s multiple comparison test; AUC
analyses assessed using an unpaired Student’s t test. Values represent
FSH and LH release from the pituitary gland, animals between 12 and 15 weeks of age were gonadectomised prior to these experiments. Compared with WT littermates, female C2cd4b-null mice displayed ~50% lower circulating FSH levels, with no difference in LH levels (Fig.5d,f; p = 0.003). No differ-ences in LH or FSH levels were apparent between WT and C2cd4b-null male mice (Fig.5e,g).
C2cd4a-null mice display no metabolic abnormalities To determine whether C2cd4a inactivation might also have an impact on glucose homeostasis, we next examined metabolic phenotypes in male and female C2cd4a-null mice (ESM Fig.
13a–c). In contrast to their C2cd4b-null counterparts, C2cd4a-null mice displayed no evident metabolic abnormalities up to 22 weeks of age, with neither weight gain, glucose homeosta-sis nor insulin secretion differing between WT and null mice for either sex (ESM Fig.13d–i). Likewise, as measured
in vitro, glucose and KCl (depolarisation)-stimulated insulin secretion were unaltered in islets isolated from male C2cd4a-null mice (ESM Fig.13j).
C2CD4A but not C2CD4B C2 domains support Ca2+ -depen-dent intracellular translocation We next sought to explore the mechanism(s) through which C2CD4B or C2CD4A may influence beta cell (and, potentially, pituitary gonadotroph) function. Both proteins have been suggested to lack a func-tional C2 domain [11], consistent with a reported localisation in the nucleus in COS7 cells [10]. In contrast to earlier find-ings reporting nuclear subcellular localisation, when overexpressed as GFP- or FLAG- tagged chimaeras in rodent
(MIN6, INS1[832/13]) or human (EndoCβH1) beta cell lines, C2CD4A and C2CD4B were found at the plasma membrane and in the cytosol and the nucleus (ESM Fig.14 and ESM Fig.15). In the majority of cells, C2CD4A and C2CD4B were primarily localised to the cytoplasm and nucleus. Co-localisation with readily iden-tified intracellular sub-compartments, including the secre-tory granule (insulin), trans-Golgi network (TGN46), endosome/lysosome (LAMP1) or endoplasmic reticulum (ER; KDEL), was not apparent in the above cell lines (ESM Fig. 16; data only shown for MIN6 cells but results were consistent in all three cell lines).
The above findings suggested that the C2 domain of either protein may bind to Ca2+and contribute to localisation at, and/ or shuttling between, subcellular compartments in living cells. To test this hypothesis, we explored phospholipid-dependent recruitment of these proteins to the plasma membrane in INS1(832/13) beta cells [21] expressing either a control construct, in which Syt1 (bearing five C2 domains) was fused to GFP [40] or equivalent C2CD4A or C2CD4B constructs (N-terminal linkage). In response to an increase in intracellular free Ca2+, provoked by 50μmol/l extracellular Ca2+and the calcium ionophore ionomycin (50 ng/ml), Syt1–GFP translocated from intracellular (likely ER-bound) sites to the plasma membrane. This movement was readily visualised by simultaneous live-cell wide-field and total internal reflection of fluorescence (TIRF) imaging (Fig.6a,b,d). A similar, but smaller change in the localisation of C2CD4A–GFP in response to Ca2+was also observed. In contrast, no response was detected for C2CD4B-GFP (Fig.6c,e–g).
+/+ -/-0 50 100 150
Plasma insulin (pmol/l) 0
50 100 150
Plasma insulin (pmol/l)
Plasma insulin (pmol/l)
+/+ -/-* * *** 0 5 15 0 20 40 Time (min) 0 5 15 Time (min) 0 5 15 Time (min) 0 5 15 Time (min) Blood glucose (mmol/l) 0 20 40 Blood glucose (mmol/l) 0 20 40 Blood glucose (mmol/l) 0 20 40 Blood glucose (mmol/l) 0 5 15 0 50 100 150 200
Plasma insulin (pmol/l) 0 50 100 150 200 Time (min) 0 5 15 Time (min) 0 5 15 Time (min) 0 5 15 Time (min) +/+
-/-a
b
c
d
+/+-/-Fig. 4 Effect of C2cd4b deletion on in vivo glucose-stimulated insulin
secretion. (a–d) In vivo insulin levels during IPGTT in C2cd4b-null and
WT females (a, c) and males (b, d) on an RC diet, at 23 weeks of age (a,
b) or an HFD at 19 weeks of age (c, d). RC: female (F)+/+n=9; F−/−n=6;
male (M)+/+n=6; M−/−n=7. HFD: F+/+n=5; F−/−n=7; M+/+n= 7; M−/−
n=7. *p<0.05, ***p<0.001, WT vs mutant animal at same time point,
two-way ANOVA with Bonferroni’s multiple comparison test. Values
Identification of C2CD4A and C2CD4B binding partners by mass spectrometry The above experiments demonstrated that C2CD4A, and possibly C2CD4B, may participate in Ca2+ -dependent signal transduction. To gain further insight into possible mechanisms of action, we performed an unbiased proteomic screen using immunoprecipitation and mass spec-trometry to identify potential binding partners. Normalising to the negative control, and ranking in order of protein abun-dance, we generated lists of possible interacting proteins for
human C2CD4A, C2CD4B (ESM Tables3,4) or both (ESM Table5). MIN6 cells transfected with human C2CD4A or C2CD4B were used for this analysis, given the low transfec-tion efficiency of human-derived EndoCβH1 cells. Interacting partners included proteins involved in Ca2+ bind-ing (torsin-2A [TOR2A] and EF-hand calcium-bindbind-ing domain-containing protein 5 [EFCAB5; [41] and www.
genecards.org/), NF-κB signalling (sequestosome-1
[SQSTM1] and programmed cell death protein 11
Vehicle 0 2 4 6 LH (ng/ml) FSH (ng/ml) M RC M HFD F RC F HFD M HFD 0 5 10 15 20 Plasma E2 (pg/ml) M RC F RC F HFD 0 50 100 150 Plasma testosterone (ng/ml)
a
c
0 10 20 30 0 10 20 30 FSH (ng/ml) ** Vehicle E2 Vehicle Testosterone Testosterone Vehicle E2 0 2 4 6 LH (ng/ml) +/+ -/-0 1×10⁻² 2×10⁻² Relative expression (normalised to β -actin) +/+ -/-***b
d
e
f
g
+/+ -/-+/+ -/-+/+ -/-+/+ -/-+/+ -/-+/+-/-Fig. 5 Effect of deletion of C2cd4b on sex hormones and hormone release from the pituitary gland. (a) RT-qPCR on samples from the pitu-itary glands shows basal level of mRNA expression of C2cd4b in animals deleted for this gene compared with WT mice. (b, c) Measurement of E2 and testosterone levels upon deletion of C2cd4b in female and male mice maintained on either an RC diet or an HFD. (d, e) Circulating LH levels in C2cd4b-null and WT female (d) and male (e) mice after injections with
saline (154 mmol/l NaCl; vehicle), E2 or testosterone (animals were maintained on an RC diet). (f, g) Circulating FSH levels in C2cd4b-null and WT female (f) and male (g) mice after injections with saline (vehicle), E2 or testosterone (animals were maintained on an RC diet). Female
(F)+/+ n=6, F−/− n=5; male (M)+/+ n=4; M−/− n=5. **p<0.01,
[PDCD11]) and protein trafficking (proprotein convertase subtilisin/kexin type 9 [PCSK9], neural precursor cell expressed, developmentally down-regulated 4, E3 ubiquitin protein ligase [NEDD4], Ras-proximate-1 [Rap1] and GTPase-activating protein [GAP2]). Receptor-type tyrosine-protein phosphatase-like N (PTPRN; insulinoma-associated protein 2 [IA-2]) and PTPRN2; phogrin/IA-2β/islet cell anti-gen 512 [ICA512]) bound to both C2CD4A and C2CD4B. These protein tyrosine phosphatase-like transmembrane proteins are granule-resident and implicated in granule traf-ficking and exocytosis [42].
Discussion
The overall aim of this study was to examine the biological roles of C2cd4b and C2cd4a in vivo, focusing on the pancre-atic beta cell and pituitary gland. These questions have been pursued using mouse and fish knockout models and relevant cell lines. In contrast to earlier findings [15], we observed that global C2cd4a deletion in the mouse exerted no effects on insulin secretion in vitro or in vivo. These findings are consis-tent with the considerably (tenfold) lower expression of C2cd4a than C2cd4b in mouse islets and mouse-derived beta cell lines (ESM Table1), though we should emphasise that no attempt was made here to quantify protein (rather than mRNA) levels. The reasons for the differences between the present study and that of Kuo et al [15] with respect to C2cd4a are presently unclear.
Deletion ofC2cd4b leads to weight gain in males, but defec-tive insulin secretion in female mice Our findings reveal a strikingly sexually dimorphic phenotype of C2cd4b-null mice, which is also strongly dependent upon diet. In contrast to females, male C2cd4b null mice displayed no evident meta-bolic abnormalities at most ages when maintained on an RC diet. Although mutant male mice exhibited a substantial increase in body weight on the HFD, fasting glucose and glucose tolerance were impaired only in older (>20 weeks) animals. In stark contrast, female mutant mice displayed abnormal glucose tolerance from as early as 12 weeks when fed an RC diet and 8 weeks when fed an HFD (with a tenden-cy towards abnormal glucose tolerance [p > 0.05] being observed at 8 weeks in RC-fed mice), despite unaltered body weight. Non-significant changes in lean mass were observed in male C2cd4b-null mice on HFD, which are reminiscent of findings from the IMPC (www.mousephenotype.org/data/
genes/MGI:1922947, accessed November 2020) when this
line was fed an RC diet. The mechanisms underlying these changes remain unclear but are unlikely to involve elevated testosterone levels in knockout animals, since these were not observed in our study.
Although earlier human studies were not stratified by sex, we note that a statistically significant (p = 0.004) impact of the human type 2 diabetes-associated variant rs7172432 (which is in perfect linkage disequilibrium with rs7163757: R2= 1.0) [15] at the VPS13C/C2CD4A/C2CD4B locus on waist circumference has previously been reported [43], and may be related to the alterations in body weight we observed here in male C2cd4b-knockout mice.
What factors underlie these sex-dependent differences in insulin secretion between WT and C2cd4b-null mice? Our findings suggest that beta cell-extrinsic mechanisms, possibly involving circulating factors, contribute to (and may even be the drivers of) altered insulin secretion in the living animal. Potential contributors are changes in FSH levels [44,45] in female C2cd4b-null mice, reflecting altered expression of the gene in the pituitary. Decreased FSH production is expected, in turn, to decrease circulating oestrogen levels. We note, however, that measurements of oestrogen are complicated in fertile mice due to fluctua-tions in the oestrous cycle [46]. Positive actions of oestrogen on beta cell insulin content (via oestrogen recep-tor α) and secretion (via oestrogen receptor β) are well known [44,47] and may thus underlie the weaker insulin secretion in C2cd4b-knockout mice. Consistent with a requirement for sexual maturity, no differences were apparent in beta cell function between genotypes in the living fish embryo (ESM Fig.4) at stages where differences in circulating sex hormones are not anticipated, and fasting blood glucose levels did not differ between WT and knock-out fish at adult stages. These findings are in contrast to earlier studies in zebrafish larvae using oligonucleotide-mediated C2cd4a gene knockdown [13], which reported alterations in beta cell mass.
Such sexual dimorphism on the impact of variants at this locus, however, has not been reported in human GWAS data [48,49]. One possible explanation is that dimorphism in mice reflects well-known differences in the response of males and females to HFD [50]. More likely, in our view, is that in rodent islets (and pituitary; see below), C2cd4b expression predom-inates over C2cd4a, while in humans, C2CD4A and C2CD4B expression are comparable. Consequently, in humans, chang-es in both C2CD4A and C2CD4B may mediate the effect of the GWAS signal for type 2 diabetes, dampening a sexually dimorphic effect of changes in C2CD4B expression.
Might altered genetic risk for type 2 diabetes in humans result from changes in C2CD4A or C2CD4B expression in the brain? Importantly, high levels of expression of C2CD4A and C2CD4B in the pituitary (GTEx data, The Human Protein Atlas; www.proteinatlas.org/ENSG00000198535-C2CD4A/
tissue and
www.proteinatlas.org/ENSG00000205502-C2CD4B/tissue; accessed November 2020) are consistent
with this view. Correspondingly, an eQTL for C2CD4A is reported for rs7163757 in the pituitary (www.gtexportal.org/
home/snp/rs7163757#sqtl-block, accessed November 2020), with a (non-significant) tendency towards decreased expres-sion of C2CD4A and, more strongly, VPS13C in carriers of C (risk allele) vs T alleles.
Intracellular signalling byC2cd4a and C2cd4b Our observa-tion that neither C2CD4A nor C2CD4B are localised exclusive-ly in the nucleus, as previousexclusive-ly reported in COS7 cells [10], islets and MIN6 cells [15], was unexpected, but implies a more
e
0 2 4 6 8 0.9 1.0 1.1 1.2 1.3 0.9 1.0 1.1 1.2 1.3Time (min) Time (min)
Time (min) Fluorescence intensity (fold change) Fluorescence intensity (fold change) Fluorescence intensity (fold change) Fluorescence intensity change (%) 0 2 4 6 8 0.9 1.0 1.1 1.2 1.3 0 2 4 6 8 GFP-Syt1 C2CD4A-GFP C2CD4B-GFP Ca2+/iono GFP-Syt1 Membranes
Ca
2+ W id e fie ld T IRF Before T IRF After Before Afterd
Ca2+/iono Ca2+/ionoa
b
f
g
T IRFc
W id e field W id e fie ld Before After Syt1 C2CD4A C2CD4B -20 0 20 40 60 **dynamic role for both C2CD4A, and possibly C2CD4B, in intracellular signalling. We note that the present study explored the subcellular distribution of the H. sapiens protein, rather than the M. musculus homologue examined previously [15], provid-ing a potential explanation for these differences. Interestprovid-ingly, predictions from the primary structure [11] indicate that neither C2CD4A nor C2CD4B (human or mouse) possesses a C2 domain with a bona fide Ca2+-binding site [51, 52]. Nevertheless, we provide a direct demonstration of Ca2+ -depen-dent recruitment of C2CD4A to the plasma membrane (Fig.6), whereas C2CD4B would appear to exert its function indepen-dently of Ca2+binding.
What signalling mechanism(s) may lie downstream of C2CD4A (or C2CD4B)? The interacting protein PTPRN2 (also known as phogrin and IA-2β) is of particular interest [42]. Inactivation of PTPRN2/phogrin, a secretory granule-localised protein [53], leads to defective insulin secretion in mice [54,55]. Importantly, double knockout of PTPRN2/ phogrin and the closely-related Ptprn (IA-2) gene leads to defective FSH and LH production and female infertility [54], implying an important role in the anterior pituitary. An interaction between C2CD4A or C2CD4B and PTPRN2 in the pituitary (and possibly the beta cell) may, therefore, contribute to the effects of altered expression on diabetes risk. Limitations of the study The present work was undertaken using animals on a mixed C57BL6N:C57BL6J background and future studies are required to confirm the findings here in pure-bred strains [56]. The impact of C2cd4b deletion on fertil-ity, and on the role of C2cd4a and C2cd4b in the pituitary, remain to be explored, as does the contribution of changes in
food intake or energy expenditure to differences in body weight. More work will also be necessary to determine whether c2cd4a-null zebrafish display beta cell deficiency.
Restrictions imposed by the coronavirus disease-2019 (COVID-19) pandemic prevented further explorations of these points during the present study.
Supplementary Information The online version contains peer-reviewed
but unedited supplementary material available athttps://doi.org/10.1007/
s00125-020-05350-x.
Acknowledgements We thank I. Cebola (Division of Systems Medicine, Imperial College London, London, UK) for her comments and revision of the manuscript. We also thank S. Rothery and other members of the Imperial College Facility for Imaging by Light Microscopy (FILM; Imperial College London) for training and use of the wide-field and confo-cal microscope. We also thank H. M. Muhitu and X. Li (Section of Cell Biology and Functional Genomics, Imperial College London) for quantifi-cation of mouse islet beta cell mass and for plasmid cloning, respectively. This work was presented at the Diabetes UK Annual Conference Manchester (2017), Diabetes UK Annual Professional Conference (2018), and the EASD Annual Conference, Berlin (2018).
Data availability The datasets generated and/or analysed during the
current study are available in the Biorxiv repository, (www.biorxiv.org/
content/10.1101/2020.05.18.099200v1). RNA-Seq (GSE152576) and
proteomics (PXD021597) data have been deposited to GEO (www.
n c b i . n l m . n i h . g o v / g e o / q u e r y / a c c . c g i ? a c c = G S E 1 5 2 5 7 6) a nd
ProteomeXchange (www.ebi.ac.uk/pride/archive/projects/PXD021597)
repositories, respectively.
Funding GAR was supported by Wellcome Trust Senior Investigator (WT098424AIA) and Investigator (WT212625/Z/18/Z) awards, MRC Programme grants (MR/R022259/1, MR/J0003042/1, MR/L020149/1, MR/R022259/1) and Experimental Challenge Grant (DIVA, MR/ L02036X/1), MRC (MR/N00275X/1), Diabetes UK grants (BDA/11/ 0004210, BDA/15/0005275, BDA 16/0005485) and Imperial Confidence in Concept (ICiC) grants. This project has received funding
from the European Union’s Horizon 2020 research and innovation
programme via the Innovative Medicines Initiative 2 Joint Undertaking under grant agreement No 115881 (RHAPSODY) to GAR. Work in the DJW laboratory was funded by the Medical Research Council (MC-A654-5QB40). SJM was supported by an Imperial College/Wellcome Trust ISSF Springboard Fellowship.
Authors’ relationships and activities GAR has received grant funding
and consultancy fees from Sun Pharmaceuticals and Les Laboratoires Servier. All other authors declare that there are no relationships or activ-ities that might bias, or be perceived to bias, their work.
Contribution statement GAR, SNMG, NN, BMO and MV designed the research. SNMG, SJM, MV, NN and GAR wrote the manuscript. AM-S, AM, CC-G, CM, DAJ, ET, EG, MH, NHFF, MTD, HK, ZM, NN, SNMG, PC, GP, SJM, BMO, MV and MI performed all experiments and data analysis and revised the article. DJW, FLC-D, OI-H, IL, PJG and HK contributed reagents and revised the article. IL oversaw and helped design all animal procedures and liaised with the UK Home Office and local ethics committee over licensing for the work. All authors read and approved the manuscript and contributed according to the
ICMJE criteria (www.icmje.org/). GAR supervised the work. GAR
serves as the guarantor of this work
Fig. 6 Changes in C2CD4A and C2CD4B localisation in response toincreased intracellular [Ca2+]. (a) Schematic showing the principle of
Ca2+-dependent translocation of C2 domains to the plasma membrane.
The ribbon diagram reproduced from [57] under the terms of the Creative
Commons Attribution 4.0 International License (http://creativecommons.
org/licenses/by/4.0/), which permits unrestricted use, distribution, and
reproduction in any medium. (b) Localisation of GFP-Syt1 in cells incubated in KREBH buffer with 3 mmol/l glucose, shown before and
after an increase in intracellular Ca2+levels (achieved by addition of 50
ng/ml ionomycin), obtained by simultaneous wide-field and TIRF image acquisition (positive control). (c) Localisation of GFP-tagged C2CD4A and -C2CD4B before and after addition of ionomycin, obtained by simultaneous wide-field and TIRF image acquisition. (d, f) Time courses for the translocation of the GFP-tagged proteins, Syt1 (d), C2CD4A (e) or C2CD4B (f) obtained by TIRF imaging before and
after addition of ionomycin (iono). (d–f) Solid black lines represent
mean; SEM shown by grey bars. (g) Assessment of fluorescence intensity change (%) reveals an increase in C2CD4A intensity at the
plasma membrane after the imposed increase in intracellular Ca2+
levels, which was similar to that observed for Syt1 protein translocation, whilst C2CD4B translocation was significantly lower than Syt1. For each condition, n=3 independent experiments were performed; n=44 cells were tracked in Syt1, n=29 cells were tracked in the case of C2CD4A, and n=30 cells were tracked in the case of
Open Access This article is licensed under a Creative Commons Attribution 4.0 International License, which permits use, sharing, adap-tation, distribution and reproduction in any medium or format, as long as you give appropriate credit to the original author(s) and the source, provide a link to the Creative Commons licence, and indicate if changes were made. The images or other third party material in this article are included in the article's Creative Commons licence, unless indicated otherwise in a credit line to the material. If material is not included in the article's Creative Commons licence and your intended use is not permitted by statutory regulation or exceeds the permitted use, you will need to obtain permission directly from the copyright holder. To view a
copy of this licence, visithttp://creativecommons.org/licenses/by/4.0/.
References
1. Mahajan A, Taliun D, Thurner M et al (2018) Fine-mapping of an
expanded set of type 2 diabetes loci to single-variant resolution using high-density imputation and islet-specific epigenome maps.
Nat Genet:245506.https://doi.org/10.1101/245506
2. Prokopenko I, McCarthy MI, Lindgren CM (2008) Type 2 diabetes:
new genes, new understanding. Trends Genet 24(12):613–621.
https://doi.org/10.1016/j.tig.2008.09.004
3. Carrat GR, Hu M, Nguyen-Tu M-S et al (2017) Decreased
STARD10 Expression Is Associated with Defective Insulin
Secretion in Humans and Mice. Am J Hum Genet 100(2):238–
256.https://doi.org/10.1016/j.ajhg.2017.01.011
4. Rutter GA, Chimienti F (2015) SLC30A8 mutations in type 2
diabetes. Diabetologia 58(1):31–36. https://doi.org/10.1007/
s00125-014-3405-7
5. Prokopenko I, Poon W, Mägi R et al (2014) A Central Role for
GRB10 in Regulation of Islet Function in Man. PLoS Genet 10(4):
1–13.https://doi.org/10.1371/journal.pgen.1004235
6. Kumar N, Leonzino M, Hancock-Cerutti W et al (2018) VPS13A
and VPS13C are lipid transport proteins differentially localized at
ER contact sites. J Cell Biol 217(10):3625–3639.https://doi.org/10.
1083/jcb.201807019
7. Mehta ZB, Fine N, Pullen TJ et al (2016) Changes in the expression
of the type 2 diabetes-associated gene VPS13C in theβ-cell are
associated with glucose intolerance in humans and mice. Am J
Physiol Endocrinol Metab 311(2):E488–E507.https://doi.org/10.
1152/ajpendo.00074.2016
8. Varshney A, Scott LJ, Welch RP et al (2017) Genetic regulatory
signatures underlying islet gene expression and type 2 diabetes.
Proc Natl Acad Sci 114(9):2301–2306.https://doi.org/10.1073/
pnas.1621192114
9. Kycia I, Wolford BN, Huyghe JR et al (2018) A Common Type 2
Diabetes Risk Variant Potentiates Activity of an Evolutionarily Conserved Islet Stretch Enhancer and Increases C2CD4A and
C2CD4B Expression. Am J Hum Genet 102(4):620–635.https://
doi.org/10.1016/j.ajhg.2018.02.020
10. Warton K, Foster NC, Gold WA, Stanley KK (2004) A novel gene
family induced by acute inflammation in endothelial cells. Gene
342(1):85–95.https://doi.org/10.1016/j.gene.2004.07.027
11. Omori H, Ogaki S, Sakano D et al (2016) Changes in expression of
C2cd4c in pancreatic endocrine cells during pancreatic
develop-ment. FEBS Lett 590:2584–2593.
https://doi.org/10.1002/1873-3468.12271
12. Gilon P, Chae H-Y, Rutter GA, Ravier MA (2014) Calcium
signal-ing in pancreaticβ-cells in health and in Type 2 diabetes. Cell
Calcium 56(5):340–361.https://doi.org/10.1016/j.ceca.2014.09.
001
13. O’Hare EA, Yerges-Armstrong LM, Perry JA, Shuldiner AR,
Zaghloul NA (2016) Assignment of functional relevance to genes
at type 2 diabetes-associated loci through investigation ofβ-Cell
mass deficits. Mol Endocrinol 30(4):429–445.https://doi.org/10.
1210/me.2015-1243
14. Peiris H, Park S, Louis S et al (2018) Discovering human
diabetes-risk gene function with genetics and physiological assays. Nat
Commun 9(1):3855.https://doi.org/10.1038/s41467-018-06249-3
15. Kuo T, Kraakman MJ, Damle M, Gill R, Lazar MA, Accili D
(2019) Identification of C2CD4A as a human diabetes
susceptibil-ity gene with a role inβ cell insulin secretion. Proc Natl Acad Sci U
S A 116(4):20033–20042. https://doi.org/10.1073/pnas.
1904311116
16. Pullen TJ, Huising MO, Rutter GA (2017) Analysis of purified
pancreatic islet beta and alpha cell transcriptomes reveals 11
β-hydroxysteroid dehydrogenase (Hsd11b1) as a novel disallowed
gene. Front Genet 8:41.https://doi.org/10.3389/fgene.2017.00041
17. Brouwers B, De Faudeur G, Osipovich AB et al (2014) Impaired
islet function in commonly used transgenic mouse lines due to human growth hormone minigene expression. Cell Metab 20(6):
979–990.https://doi.org/10.1016/j.cmet.2014.11.004
18. Owen BM, Bookout AL, Ding X et al (2013) FGF21 contributes to
neuroendocrine control of female reproduction. Nat Med 19(9):
1153–1156.https://doi.org/10.1038/nm.3250
19. Ravier MA, Rutter GA (2010) Isolation and culture of mouse
pancreatic islets for ex vivo imaging studies with trappable or recombinant fluorescent probes. In: Ward A, Tosh D (eds) Mouse cell culture: methods and protocols. Humana Press, Totowa, pp
171–184
20. Nguyen-Tu M-S, da Silva Xavier G, Leclerc I, Rutter GA (2018)
Transcription factor-7-like 2 (TCF7L2) gene acts downstream of
the Lkb1/Stk11 kinase to control mTOR signaling,β cell growth,
and insulin secretion. J Biol Chem 293(36):14178–14189.https://
doi.org/10.1074/jbc.RA118.003613
21. Hohmeier HE, Mulder H, Chen G, Henkel-Rieger R, Prentki M,
Newgard CB (2000) Isolation of INS-1-derived cell lines with robust ATP-sensitive K+ channel-dependent and -independent
glucose-stimulated insulin secretion. Diabetes 49(3):424–430.
https://doi.org/10.2337/diabetes.49.3.424
22. Westerfield M (1995) The zebrafish book. A guide for the
labora-tory use of zebrafish (Danio rerio), 3rd edition. Univ Oregon Press, Eugene
23. Fisher S, Grice EA, Vinton RM et al (2006) Evaluating the
biolog-ical relevance of putative enhancers using Tol2
transposon-mediated transgenesis in zebrafish. Nat Protoc 1(3):1297–1305.
https://doi.org/10.1038/nprot.2006.230
24. Fisher S, Grice EA, Vinton RM, Bessling SL, McCallion AS (2006)
Conservation of RET regulatory function from human to zebrafish
without sequence similarity. Science 312(5771):276–279.https://
doi.org/10.1126/science.1124070
25. Mavropoulos A, Devos N, Biemar F et al (2005) sox4b is a key
player of pancreatic alpha cell differentiation in zebrafish. Dev Biol
285(1):211–223.https://doi.org/10.1016/j.ydbio.2005.06.024
26. Thisse C, Thisse B (2008) High-resolution in situ hybridization to
whole-mount zebrafish embryos. Nat Protoc 3(1):59–69.https://
doi.org/10.1038/nprot.2007.514
27. Flasse LC, Pirson JL, Stern DG et al (2013) Ascl1b and Neurod1,
instead of Neurog3, control pancreatic endocrine cell fate in
zebrafish. BMC Biol 11(1):78.
https://doi.org/10.1186/1741-7007-11-78
28. Salem V, Silva LD, Suba K et al (2019) Leaderβ-cells coordinate
Ca2+ dynamics across pancreatic islets in vivo. Nat Metab 1(6):
615–629.https://doi.org/10.1038/s42255-019-0075-2
29. Hodson DJ, Mitchell RK, Bellomo EA et al (2013) Lipotoxicity
disrupts incretin-regulated humanβ cell connectivity. J Clin Invest
30. Ravassard P, Hazhouz Y, Pechberty S et al (2011) A genetically
engineered human pancreatic β cell line exhibiting
glucose-inducible insulin secretion. J Clin Invest 121(9):3589–3597.
https://doi.org/10.1172/JCI58447DS1
31. Miyazaki J-I, Araki K, Yamato E et al (1990) Establishment of a
pancreaticβ cell line that retains glucose-inducible insulin
secre-tion: special reference to expression of glucose transporter isoforms.
Endocrinology 127(1):126–132.
https://doi.org/10.1210/endo-127-1-126
32. Millership SJ, Da Silva Xavier G, Choudhury AI et al (2018)
Neuronatin regulates pancreaticβ cell insulin content and
secre-tion. J Clin Invest 128(8):3369–3381. https://doi.org/10.1172/
JCI120115
33. Benner C, van der Meulen T, Cacéres E, Tigyi K, Donaldson CJ,
Huising MO (2014) The transcriptional landscape of mouse beta cells compared to human beta cells reveals notable species differ-ences in long non-coding RNA and protein-coding gene
expres-sion. BMC Genomics 15(1):620.
https://doi.org/10.1186/1471-2164-15-620
34. Kone M, Pullen TJ, Sun G et al (2014) LKB1 and AMPK
differ-entially regulate pancreaticβ-cell identity. FASEB J 28(11):4972–
4985.https://doi.org/10.1096/fj.14-257667
35. Marselli L, Thorne J, Dahiya S et al (2010) Gene expression
profiles of Beta-cell enriched tissue obtained by laser capture microdissection from subjects with type 2 diabetes. PLoS One
5(7):e11499.https://doi.org/10.1371/journal.pone.0011499
36. Blodgett DM, Nowosielska A, Afik S et al (2015) Novel
observa-tions from next-generation RNA sequencing of highly purified human adult and fetal islet cell subsets. Diabetes 64(9):3172–
3181.https://doi.org/10.2337/db15-0039
37. Cruciani-Guglielmacci C, Bellini L, Denom J et al (2017)
Molecular phenotyping of multiple mouse strains under metabolic challenge uncovers a role for Elovl2 in glucose-induced insulin
secretion. Mol Metab 6(4):340–351. https://doi.org/10.1016/j.
molmet.2017.01.009
38. Solimena M, Schulte AM, Marselli L et al (2018) Systems biology
of the IMIDIA biobank from organ donors and pancreatectomised patients defines a novel transcriptomic signature of islets from
indi-viduals with type 2 diabetes. Diabetologia 61(3):641–657.https://
doi.org/10.1007/s00125-017-4500-3
39. Miguel-Escalada I, Bonàs-Guarch S, Cebola I et al (2019) Human
pancreatic islet three-dimensional chromatin architecture provides
insights into the genetics of type 2 diabetes. Nat Genet 51(7):1137–
1148.https://doi.org/10.1038/s41588-019-0457-0
40. Idevall-hagren O, Lü A, Xie B, De Camilli P (2015) Triggered Ca 2
+ influx is required for extended membrane tethering. EMBO J
34(17):2291–2305
41. Shichiri M, Ishimaru S, Ota T, Nishikawa T, Isogai T, Hirata Y
(2003) Salusins: newly identified bioactive peptides with
hemody-namic and mitogenic activities. Nat Med 9(9):1166–1172.https://
doi.org/10.1038/nm913
42. Suckale J, Solimena M (2010) The insulin secretory granule as a
signaling hub. Trends Endocrinol Metab 21(10):599–609.https://
doi.org/10.1016/j.tem.2010.06.003
43. Grarup N, Overvad M, Sparsø T et al (2011) The diabetogenic
VPS13C/C2CD4A/C2CD4B rs7172432 variant impairs glucose-stimulated insulin response in 5,722 non-diabetic Danish
individ-uals. Diabetologia 54(4):789–794.
https://doi.org/10.1007/s00125-010-2031-2
44. Alonso-Magdalena P, Ropero AB, Carrera MP et al (2008)
Pancreatic Insulin Content Regulation by the Estrogen Receptor
ERα. PLoS One 3(4):e2069
45. Mauvais-Jarvis F, Clegg DJ, Hevener AL (2013) The Role of
Estrogens in Control of Energy Balance and Glucose
Homeostasis. Endocr Rev 34(3):309–338.https://doi.org/10.1210/
er.2012-1055
46. Saito T, Ciobotaru A, Bopassa JC, Toro L, Stefani E, Eghbali M
(2009) Estrogen contributes to gender differences in mouse
ventric-ular repolarization. Circ Res 105(4):343–352.https://doi.org/10.
1161/CIRCRESAHA.108.190041
47. Mauvais-Jarvis F (2017) Epidemiology of gender differences in
diabetes and obesity. In: Mauvais-Jarvis F (ed) Sex and gender factors affecting metabolic homeostasis, diabetes and obesity.
Springer International Publishing, Cham, pp 3–8
48. Strawbridge RJ, Dupuis J, Prokopenko I et al (2011) Genome-wide
association identifies nine common variants associated with fasting proinsulin levels and provides new insights into the
pathophysiol-ogy of type 2 diabetes. Diabetes 60(10):2624–2634.https://doi.org/
10.2337/db11-0415
49. Mahajan A, Wessel J, Willems SM et al (2018) Refining the
accu-racy of validated target identification through coding variant
fine-mapping in type 2 diabetes article. Nat Genet 50(4):559–571.
https://doi.org/10.1038/s41588-018-0084-1
50. Ingvorsen C, Karp NA, Lelliott CJ (2017) The role of sex and body
weight on the metabolic effects of high-fat diet in C57BL/6N mice.
Nutr Diabetes 7(4):e261–e267.https://doi.org/10.1038/nutd.2017.6
51. Corbalán-García S, Gómez-Fernández JC (2010) The C2 domains
of classical and novel PKCs as versatile decoders of membrane
signals. BioFactors 36(1):1–7.https://doi.org/10.1002/biof.68
52. Nalefski EA, Falke JJ (1996) The C2 domain calcium-binding
motif: Structural and functional diversity. Protein Sci 5(12):2375–
2390.https://doi.org/10.1002/pro.5560051201
53. Pouli EA, Karajenc N, Wasmeier C et al (1998) A phogrin–
aequorin chimaera to image free Ca2+ in the vicinity of secretory
granules. Biochem J 330(3):1399–1404.https://doi.org/10.1042/
bj3301399
54. Kubosaki A, Nakamura S, Clark A, Morris JF, Notkins AL (2006)
Disruption of the transmembrane dense core vesicle proteins IA-2
and IA-2β causes female infertility. Endocrinology 147(2):811–
815.https://doi.org/10.1210/en.2005-0638
55. Saeki K, Zhu M, Kubosaki A, Xie J, Lan MS, Notkins AL (2002)
Targeted disruption of the protein tyrosine phosphatase-like mole-cule IA-2 results in alterations in glucose tolerance tests and insulin
secretion. Diabetes 51(6):1842–1850.https://doi.org/10.2337/
diabetes.51.6.1842
56. Fontaine DA, Davis DB (2016) Attention to Background Strain Is
Essential for Metabolic Research: C57BL/6 and the International
Knockout Mouse Consortium. Diabetes 65(1):25–33.https://doi.
org/10.2337/db15-0982
57. Wang S, Li Y, Ma C (2016) Synaptotgmin-1 C2B domain interacts
simultaneousy with SNAREs and membranes to promote
membrane fusion. ELife 5:e14211.https://doi.org/10.7554/eLife.
14211
Publisher’s note Springer Nature remains neutral with regard to