Université de Montréal
Impact of the elderly on household health
expenditure in Bihar and Kerala, India
par David Loutfi
Département de médecine sociale et préventive Faculté de médecine
Mémoire présenté à la Faculté des études supérieures en vue de l’obtention du grade de Maîtrise
Août 2013 © David Loutfi, 2013
i
IDENTIFICATION DU JURY
Université de Montréal Faculté des études supérieures
Cette mémoire intitulée:
Impact of the elderly on household health expenditure in Bihar and Kerala, India
Présentée par: David Loutfi
a été évaluée par un jury composé des personnes suivantes :
[ ], président-‐rapporteur
Jean-‐Frédéric Lévesque, directeur de recherche Subrata Mukherjee, codirecteur
iii
Résumé
Dans le contexte d’une population vieillissante, nous avons étudié l’impact de la présence de personnes âgées sur les dépenses catastrophiques de santé (DCS), ainsi que leur impact sur trois effets reliés (le fait d’éviter des traitements, la perte de revenu, et l’utilisation de sources de financement alternatives). Nous avons utilisé les données d’une enquête du National Sample Survey Organization (Inde) en 2004, portant sur les dépenses reliées à la santé. Nous avons choisi un état développé (Kerala) et un état en voie de développement (Bihar) pour faire une comparaison des effets de la présence de personnes âgées sur les ménages. Nous avons trouvé qu’il y avait plus de DCS au Kerala et que ceci était probablement lié à la présence accrue de personnes âgées au Kerala ce qui mène à plus de maladies chroniques. Nous avons supposé que l’utilisation de services de santé privés serait lié à une augmentation de DCS, mais l’effet a varié en fonction de l’état, du présence d’une personne âgée, et du type de service utilisé (ambulatoire ou hospitalisation). Nous avons aussi trouvé que les femmes âgées au Bihar utilisait les services de santé moins qu’elle ne devrait, que les ménages ayant plus de 4 personnes ont possiblement un effet protecteur pour les personnes âgées, et que certains castes et group religieux ont dû emprunter plus souvent que d’autres groupes pour payer les frais de santé. La présence de personnes âgées, les maladies chroniques, et l’utilisation de services de santé privées sont tous liés aux DCS, mais, d’après nos résultats, d’autres groupes retardent les conséquences économiques en empruntant ou évitant les traitements. Nous espérons que ces résultats seront utilisés pour approfondir les connaissances sur l’effet de personnes âgées sur les dépenses de santé ou qu’ils seront utilisés dans des discussions de politiques de santé.
Mots clés : Dépenses catastrophiques de santé, personnes âgées, maladies
Summary
In the context of an ageing population in India, we have examined the impact of the elderly on catastrophic health expenditure (CHE) and three related access impacts (avoidance of treatment, loss of income, and alternate sources of funding). We used data from the National Sample Survey Organization (India) survey on healthcare in 2004. We chose one developed state (Kerala) and one developing state (Bihar) to compare and contrast the impact of ageing on households. Our results showed that CHE was higher in Kerala and that this was likely due to more elderly that in turn have more chronic disease. We expected the use of private treatment to lead to higher levels of CHE, and while it did for some households, the impact of private treatment on CHE, varied by state, presence of elderly, and type of health service (inpatient or outpatient). We also found that elderly females in Bihar were at a disadvantage with regards to health services utilizations, that larger household size might have a protective effect on elderly households, and that some scheduled caste and Muslim households have to borrow more often than other groups in order to fund their treatment. While the elderly, chronic disease and private treatment are linked to CHE, our results suggest that other groups may simply be delaying the consequences of paying for healthcare, by avoiding treatment or borrowing money. We hope that these results be used to explore the impact of the elderly in more detail in future research, or that it contribute to health policy discussions.
Key words: Catastrophic health expenditure, elderly, chronic disease, private
v
Table of Contents
Résumé ... iii
Summary ... iv
List of tables ... vii
List of figures ... viii
List of Abbreviations ... ix
Acknowledgements ... xi
1 Introduction ... 1
1.1 Our focus ... 2
1.2 Relevance of the topic ... 3
1.3 Structure of this document ... 4
2 Literature Review ... 5
2.1 Introduction ... 5
2.2 Health expenditure ... 5
2.2.1 Government health expenditure ... 5
2.2.2 Household health expenditure ... 6
2.2.3 Catastrophic health expenditure ... 7
2.3 The elderly ... 12
2.3.1 The elderly in the world ... 12
2.3.2 The elderly in India ... 12
2.3.3 Health Policy for the elderly in India ... 14
2.4 Access to healthcare ... 15
2.4.1 Factors influencing access to healthcare in India ... 16
2.5 Other access related impacts ... 19
2.5.1 Avoidance of treatment ... 19
2.5.2 Loss of income ... 20
2.5.3 Source of funding for treatment ... 21
3 Conceptual framework ... 22
4 Methodology ... 26
4.1 Study Trip to India ... 26
4.2 Source of data ... 27
4.2.1 The National Sample Survey on Morbidity, Health care and the Aged ... 27
4.2.2 Sampling design of survey ... 27
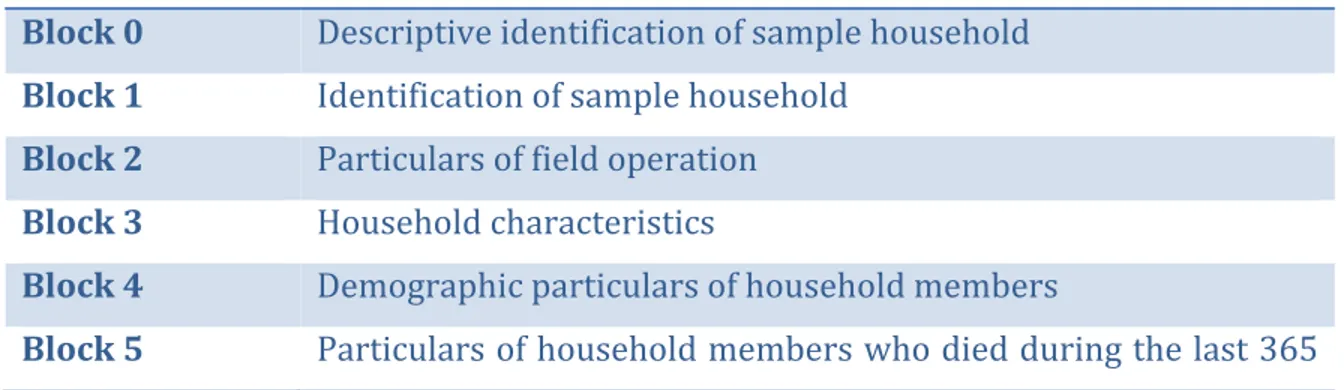
4.2.3 Description of survey ... 28
4.3 Defining our variables ... 29
4.3.1 Primary dependent variable (Catastrophic Health Expenditure) ... 29
4.3.2 Independent variables ... 32
4.3.3 Secondary dependent variables ... 37
4.4 Statistical analyses ... 38
4.4.1 Descriptive statistics ... 38
4.4.2 Bivariate analyses ... 39
4.4.3 Logistic regression ... 39
4.4.4 Analysis of secondary dependent variables ... 39
5.1 Introduction ... 41
5.1.1 Objectives, research questions, hypotheses ... 42
5.2 Methods ... 43
5.2.1 Data collection ... 43
5.2.2 Defining the variables ... 43
5.2.3 Statistical Analysis ... 45
5.3 Results ... 46
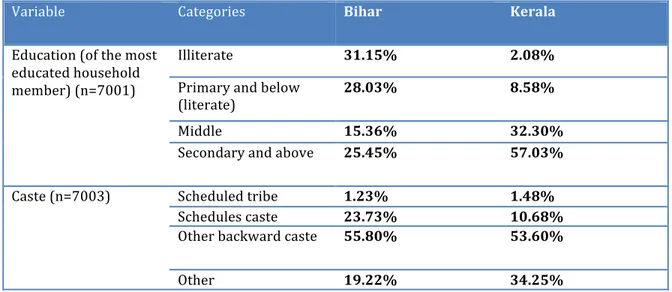
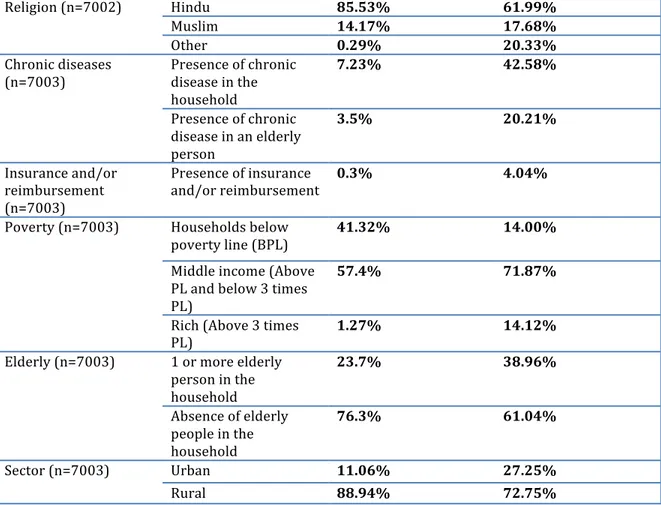
5.3.1 Description of sample ... 46
5.3.2 Level of CHE in Kerala and Bihar ... 47
5.3.3 Impact of chronic disease ... 47
5.3.4 Impact of private care on CHE ... 48
5.3.5 Logistic regression stratified by presence of elderly and state ... 48
5.3.6 Other access related impacts ... 50
5.3.7 Summary of primary findings ... 51
5.4 Discussion ... 52
5.4.1 Impact of chronic disease ... 52
5.4.2 Impact of private inpatient treatment on CHE ... 53
5.4.3 Impact of private outpatient treatment on CHE ... 55
5.4.4 Access to healthcare ... 56
5.5 Conclusion ... 58
6 Additional Results ... 61
6.1 Impact of disease type on CHE ... 61
6.2 Impact of private healthcare use on CHE ... 61
6.2.1 Impact of private healthcare use on CHE (inpatient) ... 62
6.2.2 Impact of private healthcare use on CHE (outpatient) ... 62
6.3 Impact of gender on utilization ... 63
6.4 Impact of household size ... 64
6.5 Source of funding ... 65
7 Discussion ... 66
7.1 Framework for analysis ... 67
7.2 Structure of discussion ... 68
7.3 Did Kerala have more catastrophic health expenditure than Bihar? ... 68
7.4 Level of CHE in Kerala: Is it the elderly or the chronic disease? ... 69
7.5 Did private healthcare use lead to increased CHE? ... 70
7.5.1 Impact of using private healthcare on CHE (all households combined) ... 71
7.5.2 Impact of using private healthcare on CHE (stratified by presence of elderly) ... 72
7.6 Lack of insurance ... 77
7.7 Women in Bihar ... 78
7.8 Household size ... 81
7.9 Return to our conceptual framework ... 83
7.10 Strength and Limitations ... 86
7.10.1 Limitations: Avoidance, recall period for health expenditure. ... 86
7.10.2 Strengths ... 90
7.11 Summary of discussion ... 91
8 Conclusion ... 88
8.1 Goal ... 88
8.2 Data ... 88
8.3 Findings ... 88
vii
8.5 Implications for policy and research ... 90
9 Appendices ... xii
List of tables
Table 2-‐I Summary of factors increasing risk of CHE ... 10Table 4-‐I Rural stratification ... 27
Table 4-‐II Urban stratification ... 27
Table 4-‐III Second level stratification (Urban and Rural) ... 28
Table 4-‐IV Division of Schedule 25.0 of 60th round of NSSO Survey ... 28
Table 4-‐V Impact of Sector on Loss of Income ... 40
Table 4-‐VI Impact of Sector on Avoidance of Treatment ... 40
Table 4-‐VII Impact of Sector on Source of Funding ... 41
Table 5-‐I Comparison of demographic variables in Kerala and Bihar ... 46
Table 5-‐II Households with catastrophic health expenditure ... 47
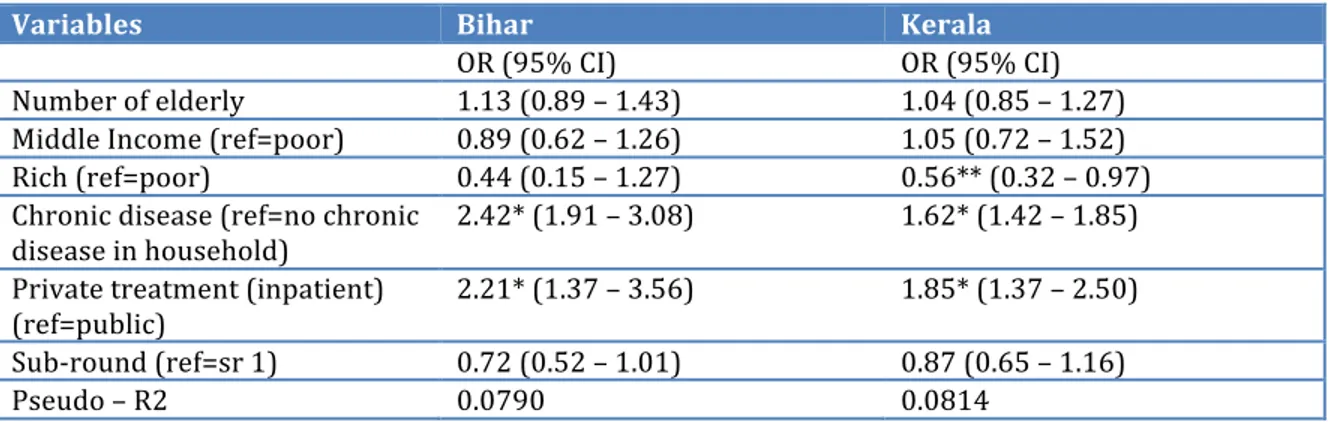
Table 5-‐III Odds Ratios for Catastrophic Health Expenditure (elderly and non-‐ elderly households combined) ... 48
Table 5-‐IV Odds Ratios for Catastrophic Health Expenditure (stratified by presence of elderly) ... 49
Table 5-‐V Impact of presence of the elderly on loss of income, avoidance, and source of funding ... 50
Table 5-‐VI Impact of presence of elderly, chronic disease, and private treatment on CHE and related access impacts ... 52
Table 5-‐VII Distribution of households with chronic disease ... 52
Table 6-‐I Impact of disease type (chronic/acute) on CHE ... 61
Table 6-‐II Average healthcare expenditure ... 61
Table 6-‐III Impact of private healthcare use on CHE (inpatient) ... 62
Table 6-‐IV Percentage of households using private healthcare (inpatient) ... 62
Table 6-‐V Impact of private healthcare use on CHE (outpatient) ... 62
Table 6-‐VI Number of treatments per thousand population over the last 15 days ... 63
Table 6-‐VII Impact of household size ... 65
Table 7-‐I Impact of presence of elderly, chronic disease, and private treatment on CHE and related access impacts ... 67
Table 7-‐II Households with catastrophic health expenditure ... 68
Table 7-‐IV Comparison of definitions of CHE (Households that incurred CHE) ... 87
Table 9-‐I Bihar, no elderly ... xii
Table 9-‐II Bihar, elderly ... xii
Table 9-‐III Kerala, no-‐elderly ... xiii
Table 9-‐IV Kerala, elderly ... xiii
Table 9-‐V Percentage of households with CHE in Bihar (10% of total household expenditure) ... xiv
Table 9-‐VI Percentage of households with CHE in Kerala (10% of total household expenditure) ... xv
List of figures
Figure 3-‐1 Conceptual Framework ... 22 Figure 6-‐1 Number of treatments per thousand population over the last 15 days ... 64
ix
List of Abbreviations
BPL Below poverty line CAD Canadian dollars
CHE Catastrophic health expenditure DALY Disability adjusted life year FSU First stage units
GDP Gross domestic product INR Indian rupees
NSS National Sample Survey
NSSO National Sample Survey Organization OBC Other Backward Castes
OOP Out of pocket PL Poverty line
PPSWR Probability proportional to size with replacement
RSBY Rashtriya Swasthya Bima Yojna (Hindi name for a health insurance scheme)
SC Scheduled Caste ST Scheduled Tribe SR Sub-‐round
SRSWOR Simple random sampling without replacement USU Ultimate stage units
xi
Acknowledgements
I would like to thank my supervisor Jean-‐Frédéric Lévesque for his insight and encouragement throughout the writing of this thesis. Next, my co-‐supervisor Subrata Mukherjee deserves special thanks for graciously hosting me for a summer and for introducing me to India and all its complexities.
I would like to thank all the staff and students at the Institute for Development Studies Kolkata, at the Center for Development Studies Thiruvananthapuram and at Université de Montréal.
Lastly, I would like to thank my family, friends, and roommates for supporting me throughout this process.
1 Introduction
The world’s population is estimated to have passed 7 billion in 2011. India currently has the second largest population in the world and given current population growth rates, India is expected to surpass China as the largest country in the world by 2030 (Bloom 2011).
India is undergoing a demographic and epidemiological transition. Better control of infectious diseases is leading to lower infant death rates and longer life expectancy (Jeyalakshmi et al. 2011) This leads to a population that lives longer and thus develops more chronic diseases. As people age and develop these diseases, they will require more health services and it is estimated that in 2030 almost 50% of the Indian health burden as measured by disability adjusted life years (DALYs) will be borne by the elderly (over 60 years of age) (Chatterji et al. 2008). An ageing population will thus put a strain on the health care system if it is not adapted to the changing needs of the population (Bhattacharjya 2005).
Three quarters of health expenditure in India is currently paid for privately (out-‐of-‐pocket (OOP) or private insurance) (Balarajan et al. 2011). Insurance coverage estimates vary widely including 1.6% (Joglekar 2008), 3% (Ellis et al. 2000), 10% (Balarajan et al. 2011) and 25% (Reddy, Selvaraj, et al. 2011)1. Since poorer populations generally have less health insurance, they tend to pay for health services through OOP expenditures. For many, these expenditures can be crippling and this is known as catastrophic health expenditure (CHE). In practice a household is said to have incurred CHE if the amount of household income spent on healthcare exceeds a certain percentage (often 10%) of total household expenditure. In India it is estimated that around 269 million people live below the poverty line (Planning Commission 2013). CHE exacerbates this problem, as 39 million people fall below
1 The breadth of insurance coverage is rapidly changing in India. There is currently a project to supply all households below the poverty line with up to 30 000 INR
(about 550 CAD) of health insurance. While this should expand insurance coverage substantially, the project was implemented after our data was collected so the lower
2
the poverty line each year due to these expenses (Balarajan et al. 2011). In 2004-‐ 2005, 10% of urban and 14% of rural households in India incurred catastrophic health expenditure (Selvaraj & Karan 2009).
1.1 Our focus
Given the ageing population of India, it is relevant to examine the impact of the elderly on catastrophic health expenditure. We have chosen to examine one developed state (Kerala) and one less-‐developed state (Bihar). We have chosen these two states due to their differences in economic and social development.
With regards to economic development, both states have had important economic growth in the past few years. The growth rate of the net state domestic product (NSDP) from 2000 to 2009 was 7.8% in Kerala and 9.0% in Bihar, compared with 7.1% in India as a whole. Though Bihar is experiencing strong growth, its per capita income is still the lowest in the country. Many workers in Bihar lack job security and social security due to the large informal sector. Using NSSO data, Naik estimates that 94% of the workforce in Bihar is in the informal sector, while only 63% of the workforce is in the informal sector in Kerala (Naik 2009). Further, in 2004-‐2005, poverty rates in Bihar were 41.4% and 15% in Kerala (Institute of Applied Manpower Research (India) 2011).
While social or human development is difficult to measure, Huq and Sen have developed the human development index (HDI) in order to ascribe one number to describe the human development of an area. It combines measures of life expectancy, literacy, and gross domestic product to produce one number ranging from zero to one that can be used to compare different areas. The HDI in India is 0.467 and this puts it a medium level of human development. However, this masks a difference between Indian states. The HDI in Kerala is 0.790, which is comparable to countries such as Mexico and Chile. In Bihar, the HDI is much lower at 0.367. This is similar to countries such as Zimbabwe and Ethiopia (Institute of Applied Manpower Research (India) 2011). Literacy rates are also higher in Kerala (94%) than Bihar (62%) (Office of the Registrar General and Census Commissioner, India 2011) and higher literacy has also been linked to higher utilization of health services (Grosse & Auffrey 1989).
We would expect the presence of an elderly person in the household to increase the probability of CHE due to their increased use of health services. However, different states in India are at different stages of the demographic transition. For example, the percentage of elderly is substantially higher in Kerala (11.24%) than it is in Bihar (5.58%). Further, given the differences in access to healthcare and development, we expect the impact of the elderly on health expenditure to differ in these two states. For example, the elderly in Bihar might be less of an economic burden on their households simply because they cannot reach any health services. Therefore, we have examined the impact of the presence of elderly people on the economic consequences of healthcare on households in both states using data from the National Sample Survey of India, 60th round (NSS) carried out in 2004.
One limitation in many studies of catastrophic health expenditure is that its definition (as health expenditure as a proportion of total expenditure) does not cover all households that the concept aims to include. There are three specific cases in which this measure of CHE is incomplete. First, households could choose to avoid treatment altogether, knowing that it would be too expensive. Second, a household could lose income, either due to the sick person not working, or due to another family member taking time off work to help treat them. Third, households may choose to sell assets in order to pay for healthcare. This may enable them to avoid catastrophic health expenditure in the short term but may have longer-‐term consequences on the household. We will thus examine catastrophic health expenditure and these three related consequences to develop a more complete view of the impact of these increased healthcare needs due to an ageing population.
1.2 Relevance of the topic
This topic is important because the aging population of India combined with poor health infrastructure (lack of universal health insurance and often limited access to health care at affordable price ) will likely cause an increase in health payments and thus CHE. This can significantly affect the living standards of many families and will push many into poverty and worsen the state of those who are already poverty stricken (Balarajan et al. 2011). Kerala is further along in the demographic and epidemiological transitions and is more developed than Bihar.
4
Understanding the current impact of the elderly on Kerala should help educate us on the potential challenges and solutions available to Bihar in the future. As well, poor health can have adverse economic effects through reduced productivity, and poor economic development is linked to poorer health (Sahn 2012). To avoid this vicious circle that could keep Bihar in an underdeveloped state, we should strive to understand the links between the current population structure and health expenditure. More generally, deepening our understanding of the factors causing CHE will allow policy makers to promote various initiatives and policies that could reduce CHE (Pal 2010).
1.3 Structure of this document
This thesis is divided into five parts. First, we review the literature on catastrophic health expenditure in the world and in India in particular. Second, we discuss the frameworks used in our conceptualization and analysis. Third, we examine the methodology used to analyze our data. Fourth, we present our results in the form of an article. Last, we discuss our findings in the context of an ageing population before concluding. Supplementary results of our can be found in the appendices.
2 Literature Review
2.1 Introduction
In this literature review, we first give some context with regards to health expenditure before discussing what has been studied about catastrophic health expenditure in the world and in India. Given that the impact of the elderly is our focus, the next section discusses literature covering the state of ageing in the world, and then in India, with some discussion of current policies regarding the elderly in India. Next we discuss some of the factors that affect access in the Indian context. We end with a review of literature covering some of the other potential economic consequences of falling sick, such as avoiding treatment, losing income, or using alternate sources of funding.
2.2 Health expenditure
2.2.1 Government health expenditure
A country the size of India necessarily has huge health expenditure. In the years 2004-‐05, health expenditure was approximately 24 billion Canadian dollars and is 4.25% of GDP. Of this amount, only about 20% is paid for by the public sector, while most of the rest is paid out of pocket by households when they fall ill (Government of India, Ministry of Health and Family Welfare 2009). Unlike many developed countries, there is very little coverage by health insurance, with estimates ranging from 1.6% to 25% (Joglekar 2008; Ellis et al. 2000; Balarajan et al. 2011; Reddy et al. 2011). This means Indian citizens will fall in one of three categories. First, those who can afford healthcare pay and receive treatment. Second, those who have less money spend a large proportion of their income on treatment and have to forgo other essential items (Wagstaff & Doorslaer 2003). Third, those who can’t afford it at all avoid treatment altogether and suffer the consequences. This is due to the lack of government spending on healthcare both by the central and by state governments in India. A comparison with nearby countries shows that government
6
health spending account for only 17.3% of total health spending in India while this rose to 28.1% and 26.3% for Bangladesh and Nepal, respectively. The proportion of government spending in developed countries such as Canada (69.8%), the USA (44.7%), and the UK (86.3%) was much higher (Government of India, Ministry of Health and Family Welfare 2009). In 2003-‐04, only 4.97% of the state government’s budget was spent on healthcare. In Bihar, this was slightly lower at 4.84% and slightly higher in Kerala at 5.42%. Unfortunately, these percentages have been decreasing (from 7.02% in 1985-‐86 to 4.97% in 2003-‐04) (Ghuman & Mehta 2009). The central government spent only 2% of its budget on healthcare (Bhaumik 2013). Public health expenditure is less than 1% of GDP and this is partially due to the economic liberalization policy introduced in 1991 (Ghuman & Mehta 2009). Finally, public health expenditure accounts for only 19.67% of total health expenditure, while the private sectors accounts for 78.05%, with the rest being attributed to external flows (e.g. NGOs) (Government of India, Ministry of Health and Family Welfare 2009).
2.2.2 Household health expenditure
As private health insurance is extremely limited, households have to spend a large amount on healthcare should they fall sick. Indeed, it was estimated that 80% of health expenditure was paid for out-‐of-‐pocket in 2006 (Bhattacharjya & Sapra 2008). Inpatient care, outpatient care or the cost of medication can each impose a substantial burden on household (Saksena et al. 2010). Unfortunately, paying for healthcare is sometimes a choice that households have to pass up. As such, higher healthcare expenditure is often not an indication of the amount of illness but rather the ability to pay. We can take the obvious examples of healthcare expenditure by households in the United States and in India. We expect Americans to have better health despite higher health expenditure. This concept can be expanded to compare states within India. A more developed state like Kerala has higher household health expenditure than a less developed state such as Bihar (Sen 2002). This expenditure is something that is worthwhile in that it improves people’s health. However, the downside to the treatment is the economic impact on the household. Massive health
expenditure can impact household spending on other essential items and when this expenditure becomes too large, we call it catastrophic health expenditure (CHE).
2.2.3 Catastrophic health expenditure
Catastrophic health expenditure is a concept that has often been used in designing policy to protect households or individuals from the economic impacts of health expenditure. The goal is to set a threshold above which we can say that households are spending too much of their income on healthcare. Once these households are identified, policy can then be designed to protect these households. Wyszewianski describes a few different definitions of CHE (Wyszewianski 1986). He first mentions a 1979 definition that considers health expenditure to be catastrophic if it exceeds a fixed amount (2000.00 USD used in the Long-‐Ribicoff catastrophic health insurance bill). This definition is necessarily incomplete since some households would be expected to be able to pay 2000.00 USD without suffering much, while for other families this would be a much larger part of their income.
Many authors have defined CHE as a percentage of income. Feldstein proposed 10% of income spent on healthcare as being catastrophic (Feldstein 1971). This is an improvement over the use of a fixed amount, but still does not completely address the fact that 10% of a rich household’s income may not force them to make any significant changes, but poorer households may need this 10% to pay for essential subsistence items. As a solution, different thresholds for different levels of income have been proposed (Wyszewianski 1986). Finally, given the arbitrary nature of defining catastrophe, people have used different thresholds such as 5%, 10%, 15% or 20%.
Since the conceptual definition of CHE involves an amount that causes a change in the household’s lifestyle, some authors have used a household’s capacity to pay rather than their total income as the denominator. Capacity to pay is defined as the household’s income minus their spending on essential items such as food (Xu, Klavus, et al. 2003). If the amount spent on healthcare exceeds a certain percentage of a household’s capacity to pay, then this is considered catastrophic. If a poor household spends most of its income on food, but spends all the rest on healthcare, this definition considers it catastrophic, while the previous ones do not. There are
8
many definitions of CHE and defining catastrophe is necessarily arbitrary to a certain extent. However, it is useful as a concept for policymakers and a consistent definition is useful in that context. Some literature in the Indian context defines CHE as 10% of total household expenditure (a proxy for income (Xu, Klavus, et al. 2003)) (O’Donnell et al. 2005; Selvaraj and Karan 2009) this is the definition that we will use, keeping in mind its limitations.
2.2.3.1 CHE in the world
Catastrophic health expenditure is a concept that has been studied in many different contexts around the world. Its primary use is to examine the economic impact of healthcare on households with the goal of helping to improve health policy.
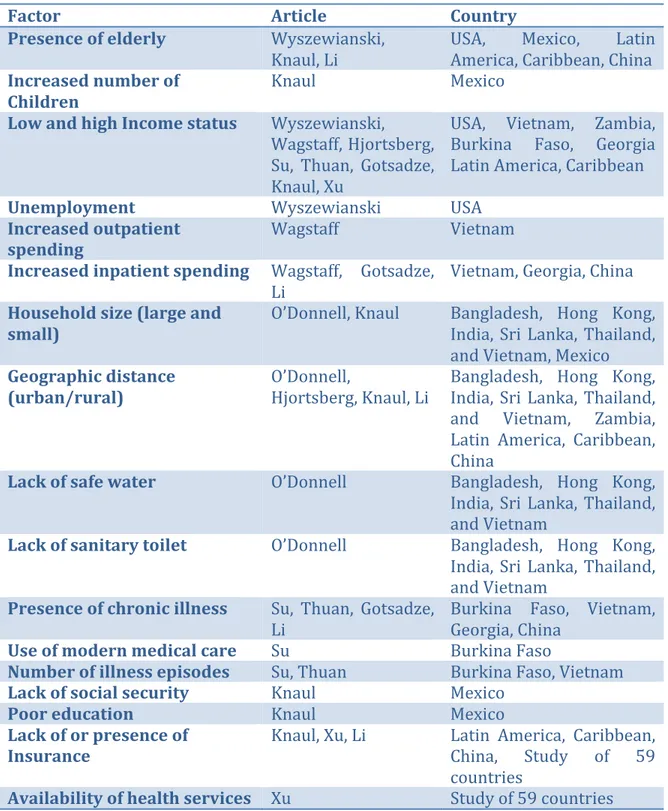
In 1986, Wyszewianski studied the characteristics of American families who incurred CHE. He found that these households were often low-‐income, headed by an unemployed person, or headed by an elderly person (Wyszewianski 1986). In 2003 Wagstaff studied the impact of paying for healthcare in Vietnam and found that the primary cause was not inpatient spending, but rather outpatient spending. Further, he found that the poor were often pushed further into poverty but that the non-‐poor were less often pushed below the poverty line (Wagstaff & Doorslaer 2003). In a 2005 working paper, O’Donnell et al. studied 6 Asian countries or territories (Bangladesh, Hong Kong, India, Sri Lanka, Thailand, and Vietnam) to find the determinants of CHE (defined as 10% of total household expenditure). They show that larger household size in Bangladesh, Hong Kong and Thailand increase CHE while larger household size decreases CHE in India. Households in a rural area, lack of access to safe drinking water, and lack of a sanitary toilet were also linked to increased CHE. They also show that CHE increases as household expenditure (a proxy for income) increases (O’Donnell et al. 2005). This suggests that richer households often incur more CHE. In a 2003 study of Zambia, Hjortsberg showed that economic status and geographical access to healthcare (e.g. distance) were the main determinants of increased health expenditure (Hjortsberg 2003). In 2006, a study in Burkina Faso by Su showed that low economic status, utilization of modern healthcare, number of illness episodes, and presence of a household member with a chronic illness were the main determinants of CHE (defined with multiple
thresholds of 20%, 30%, 40%, and 60% of non-‐food expenditure) (Su et al. 2006). In 2006 study of Vietnam, Thuan et al. showed that chronic illnesses were a main determinant of CHE (defined as 40% of capacity to pay) and that these chronic illnesses were more prevalent in poorer sections of the population. They also showed that CHE was most often due to repetitive visits for more common illness rather than accidents or one-‐time expenditures (Thuan et al. 2006). Knaul et al. also showed in 2007 that in Mexico, households with elderly members or children incurred more CHE (defined as 30% of non-‐food expenditure). Surprisingly they showed that household size increased excessive spending on healthcare, but decreased CHE. This is perhaps due to rich families being able to support a large family and thus also have the means to pay for healthcare. They also show that access to social security and higher education of the head of household are linked to decreased CHE (Knaul et al. 2007). In 2009, Gotsadze et al. studied CHE in Georgia and showed that hospitalization, presence of chronic illness and low economic status of the household were all linked to CHE (defined as 40% of capacity to pay). They also note that the low amount of prepayment (e.g. insurance) is likely increasing CHE (Gotsadze et al. 2009). In 2011, Knaul et al. studied CHE in twelve Latin American and Caribbean countries (Argentina, Bolivia, Brazil, Chile, Colombia, Costa Rica, Dominican Republic, Ecuador, Guatemala, Mexico, Nicaragua, and Peru). Though there was variation across the countries, CHE (defined using 30% of capacity to pay) was linked to low-‐income, rural residence, presence of elderly, and lack of insurance (Knaul et al. 2011). Most recently, in 2012, Li et al. studied the impact of universal health insurance on CHE (defined as 40% of capacity to pay) in China. Their results indicate that hospitalization, presence of an elderly person, chronic illness, and living in a rural or poor area increased the likelihood of incurring CHE. Interestingly, they also showed that health insurance might increase CHE if its breadth of coverage is insufficient since it can increase utilization rates (Li et al. 2012). Finally, in 2003, Xu et al. summarized the results of CHE studies in 59 countries. They found that low capacity to pay, lack of insurance, and availability of health services requiring payment were the main causes of CHE (Xu, Evans, et al. 2003).
10
Table 2-‐I Summary of factors increasing risk of CHE
Factor Article Country
Presence of elderly Wyszewianski,
Knaul, Li
USA, Mexico, Latin America, Caribbean, China
Increased number of Children
Knaul Mexico
Low and high Income status Wyszewianski, Wagstaff, Hjortsberg, Su, Thuan, Gotsadze, Knaul, Xu
USA, Vietnam, Zambia, Burkina Faso, Georgia Latin America, Caribbean
Unemployment Wyszewianski USA
Increased outpatient
spending Wagstaff Vietnam
Increased inpatient spending Wagstaff, Gotsadze,
Li
Vietnam, Georgia, China
Household size (large and
small) O’Donnell, Knaul Bangladesh, Hong Kong, India, Sri Lanka, Thailand, and Vietnam, Mexico
Geographic distance
(urban/rural) O’Donnell, Hjortsberg, Knaul, Li Bangladesh, Hong Kong, India, Sri Lanka, Thailand, and Vietnam, Zambia, Latin America, Caribbean, China
Lack of safe water O’Donnell Bangladesh, Hong Kong,
India, Sri Lanka, Thailand, and Vietnam
Lack of sanitary toilet O’Donnell Bangladesh, Hong Kong,
India, Sri Lanka, Thailand, and Vietnam
Presence of chronic illness Su, Thuan, Gotsadze,
Li Burkina Faso, Vietnam, Georgia, China
Use of modern medical care Su Burkina Faso
Number of illness episodes Su, Thuan Burkina Faso, Vietnam
Lack of social security Knaul Mexico
Poor education Knaul Mexico
Lack of or presence of
Insurance Knaul, Xu, Li Latin America, Caribbean, China, Study of 59 countries
Availability of health services Xu Study of 59 countries CHE has a number of influencing factors both from the side of the user and of the provider. Only some of the factors above are available in our data set and so while we do not examine every potential variable of interest, we nonetheless cover a good number of these.
2.2.3.2 CHE in India
Now let us examine CHE in the Indian context. There is a large range of development in India, and many different authors in many different states and contexts have studied CHE. In 2005, George studied CHE in Kerala and found that as many as 25% to 30% of households in Kerala incurred CHE at the 10% threshold level. It is the highest rate of CHE of all states in India and the author attributes this to higher utilization and better access to healthcare (George 2005). In 2009, Gupta studied the impact of health expenditure on poverty estimates. Poverty lines are defined for rural and urban areas in each state based on the cost of basic nutritional requirements. They found that inclusion of health expenditure as necessary expenditure increased poverty estimates by 3.6% and 2.9% for rural and urban areas respectively. The adjustment to poverty estimates is important as some healthcare is now considered essential in the same way that food is (Gupta 2009). van Doorslaer showed that 78 million additional people in Asia would be considered poor if healthcare spending was deemed essential (van Doorslaer et al. 2006). Also, in 2009, Selvaraj studied the change in Indian healthcare spending from 1986 to 2005. They show that utilization of public health services has diminished in this period and that the average cost of hospitalization is increasing. Their analysis shows that approximately 13% of households incurred CHE (defined as 10% of total household expenditure) in India in 2004. Furthermore, they show an increase in the number of people being pushed below the poverty line due to this out-‐of pocket expenditure. While 26 million people were pushed below the poverty line in 1993-‐ 94, 39 million people were pushed below the poverty line in 2004-‐05 (Selvaraj & Karan 2009). In 2010 Pal examined the factors that affect CHE. She found that economic well-‐being, safe cooking methods, female heads of household, and higher education were linked to reduced CHE, while households size, number of elderly, number of children, and lower social status were linked to increased probability of CHE (defined as 40% of capacity to pay).(Pal 2010). Mondal et al. studied CHE in West Bengal in 2010. They found that around 25% of the population incurred CHE (defined as 40% of capacity to pay), and that the rural population was more vulnerable to CHE than the urban population. They also found that the type of
12
treatment (public/private), chronic illness, hospitalization, multiple minor illnesses, and institutional birth deliveries often lead to CHE. One important finding is that medical care for repeated minor illnesses was a greater contributor to CHE than chronic illness or hospitalization (Mondal et al. 2010). In 2010, Ghosh studied CHE (defined as 10% of total household expenditure) across the whole of India and found that the amount of CHE ranged from about 3.5% in Assam to over 30% in Kerala. The author also found an increase in out-‐of-‐pocket health expenditure from 1994 to 2005 as well as higher expenditure for more developed states (Ghosh 2010).
2.3 The elderly
Our primary interest is the impact of the elderly on health expenditure so here we examine the state of ageing in the world and in India. In many developed countries elderly are defined as being 65 and older, with some countries such as Japan considering even higher ages. Many developing countries, including India, define the elderly as being 60 or older.
2.3.1 The elderly in the world
In developed countries, the proportion of elderly in the population is increasing substantially. Good control of infectious diseases has caused a decrease in death rate, and subsequently birthrates, while good control of chronic diseases is causing people to live longer. This ageing of the population has many effects on households, the economy and the healthcare system. Of interest to us is the impact on healthcare spending. As the population ages, they will develop more chronic diseases and these diseases tend to be more expensive to treat. In developed countries the global burden of disease (measured in Disability Adjusted Life Years (DALYs)) due to chronic diseases will increase from 85% in 2002 to 89% in 2030 while in developing countries, it will increase from 44% to 54% over the same time period (Kinsella & He 2009, p.58). These changes are also occurring in developing countries, although to a lesser extent.
2.3.2 The elderly in India
Over the past 60 years, the number and proportion of elderly in India has increased substantially. The number of elderly has increased from 19.1 million in
1951 to 77 million in 2001 and is projected to reach 140 million by 2021. This is almost 5 times the population of Canada or half the population of the USA. Not only is the absolute number increasing, but the proportion of elderly in the total population is also increasing. In 1951, 5.4% of the population was above 60, and by 2001 this had increased to 7.4%. By 2026, 12.4% of the population is expected to be above the age of 60 (Jeyalakshmi et al. 2011). As well, by the year 2042, the number of elderly is expected to exceed the number of children (Chatterji et al. 2008). This will mean that there will be fewer people of working age available to support the elderly in the long run. However, in the short run, there will be fewer children for parents to support, so in theory there should be more resources available to support the elderly (Bloom 2011). Nonetheless, a large proportion of the elderly (70% of women and 30% of men) are totally dependent on others for economic support (Jeyalakshmi et al. 2011).
The sex ratio is also changing. While there were 1028 females per 1000 males in 1951, in 2001, there were only 972 females per 1000 males. Despite this decrease, female life expectancy is increasing. Male life expectancy was higher until about 1980 (unlike most developed countries) but since then female life expectancy has surpassed it. During the period of 2002-‐06, life expectancy was 62.6 years for males and 64.2 for females (Jeyalakshmi et al. 2011).
Nonetheless, the elderly population is far from homogeneous. As an example, let us look at literacy rates, which will likely impact earning, and potentially health expenditure. Only 50% of elderly males and 20% of elderly females were literate through formal schooling by 2007 (Jeyalakshmi et al. 2011). As well, the 2001 census shows that elderly males are substantially more literate than elderly females. Further it shows that the urban population is more literate than the rural one (Kinsella & He 2009, p.96). Given these differences in the elderly population, we would expect some difference in health expenditure by gender and by region.
The risks associated with an ageing population only lead to problems given certain conditions. Much of the developed world has an older population than India and will not have to deal with the same consequences. This is primarily due to access to healthcare and to financial protection from its costs. Ageing populations in
14
developed countries do have a major impact, though it tends to be on government expenditure, as the government must pay for pensions and healthcare for the elderly. This differs from developing countries where less than 11% of elderly Indians have a pension (Uppal & Sarma 2007) and only about 6% have health insurance as of 2007. Recent government initiatives have increased this percentage closer to 25% (Reddy et al. 2011). Therefore, the burden of ageing in India will fall largely on households.
Traditionally, the family support system has been relatively strong in India. Extended families would live together and the elderly would live with their adult children. This is gradually changing however, and means that the elderly are increasing isolated. In fact, the number of elderly living alone has increased from 2.4% to 5% from 1992-‐93 to 2005-‐06 and the number of elderly living only with a spouse has almost doubled from 6.6% to 13.7% in the same time period (Kumar et al. 2011).
Contrary to many developed countries, many of the elderly still work in developing countries. This is likely due to a lack of social security, and a lack of an ability to save during their lifetime. In fact, about 40% of the elderly population in India still works (Jeyalakshmi et al. 2011).
2.3.3 Health Policy for the elderly in India
There are a number of government ministries that have policies relating to the elderly. The Ministry of Social Justice and Empowerment is the primary government agency that deals with programs and policies for the elderly. The Ministry of Health and Family Welfare also plays an important role, having set up two institutes of ageing and geriatric departments in many medical colleges. The Ministry of Rural Development contributes programs such as a pension scheme that benefits the elderly residing in households below the poverty line. As well, the Ministry of Railways and the Ministry of Civil Aviation have discounts, while the Ministry of Finance has different tax exemptions for the elderly. The department of Pensions and Pensioner Grievances works to provide information on pensions and to adjust the amounts should the need arise. There is also an Inter-‐Ministerial Committee on Older Persons whose responsibility it is to conceive and coordinate