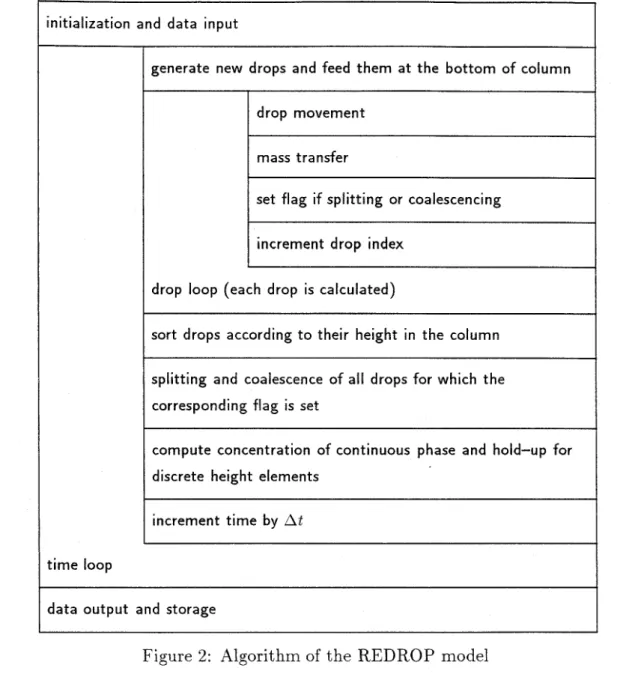
Simulation of Packed Extraction Columns with the REDROP Model
Texte intégral
Figure

Documents relatifs
The Eulerian Multi-Fluid model has proven its capa- bility to simulate the size-conditioned dynamics of poly- disperse sprays including coalescence with a first order resolution
The Eulerian Multi-Fluid model has proven its capability to simulate the size-conditioned dynamics of polydisperse sprays including coalescence with the resolution of one moment of
Sellens [21] explained that the unrealistic behavior of the number-based drop-size distribution he obtained with Brzustowski (Equation 23) at small drop diameter
13 Expressed in words, the gross income associated with any social rank increases, implying that the social rank, G(y), associated with any income level, y, decreases.. One can see
Given that the buyer believes the seller to be selfish when observing a deviation, a seller gets share γ of the trade surplus if and only if he chooses the equilibrium investment..
When increasing the liquid flow rate, the liquid film does not follow the shape of the structured wall anymore, a static hold- up (recirculation zone) form in the cavities and grows
The coefficients of different mass formulae derived from the liquid drop model and including or not the curvature energy, the diffuseness correction to the Coulomb energy, the
For partial coalescence to occur, the horizontal constriction of the interface, driven by the surface tension on the sides of the drops, must overcome the vertical collapse driven
