Given the natural resource curse, is there
an economic interest for EU members to
exploit shale gas?
Professor: Jacques Olivier
Executive Summary
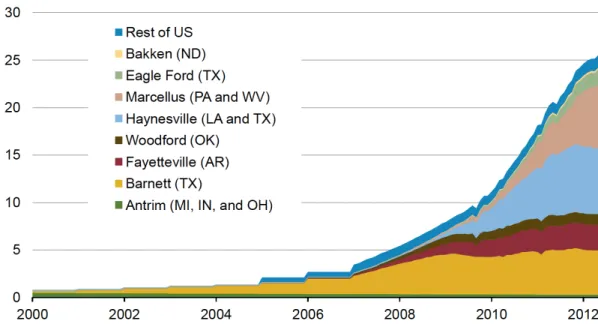
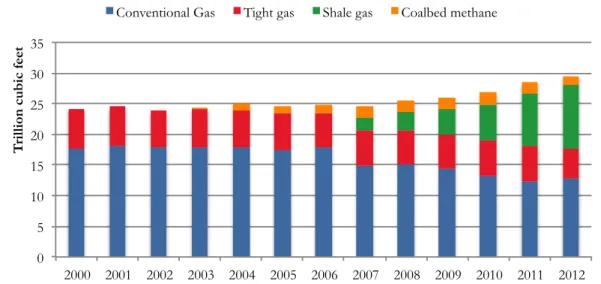
Over the last ten years, shale production in the United States has increased from less than 2% of the domestic gas production to more than 35%, slashing domestic gas prices while raising hopes of the US becoming energy independent by 2035. The hype around this shale gas revolution has drawn the attention of many, including over-indebted and energy dependent Europe. However, various economic concerns surround the hypothetic shale gas development in the European Union. First, resource windfalls do not always have the expected positive impact on economic growth. Second, numerous recent studies - based on plummeting production rate in US shale plays – have begun to question shale gas actual profitability. Last, what could be profitable in the US might well not be in the EU, as key differences regarding reserves, techniques, financing or legal frameworks could prevent the reproducibility of the US shale gas revolution in the EU. The aim of this paper was to elaborate on these topics, in order to determine whether or not the EU members should consider shale gas an economic opportunity.
The first point seems rather odd, even paradoxical. Indeed, if shale gas was to be considered a resource windfall, then resources rents and additional exports could be used to import more goods, boost capital investment and build up the economy. Therefore it should be considered a blessing. However, a member of the EU, the Netherlands, knows better than many that a gas windfall does not always benefit the economy. Their discovery of a massive natural gas field in 1959 rather had the opposite effect, a phenomenon infamously known as the Dutch Disease. Similarly, modern economic theory has recently shown resource abundant countries have tended to growth less rapidly than their resource poor counterparts – fathers labeled this the Natural Resource Curse. A new theory, the Carbon Curse, which also focuses on the detrimental effects of resource abundance, suggests fossil fuel rich countries are condemned to high carbon intensity*.
Given the current real EU price of carbon at circa €5 per ton and its implicit cost that could be between 5 and 9 times higher, this latter curse is also an economic one. Fortunately, those curses are not written in stone and several countries managed to overcome them, most notably oil and gas rich Norway. We identified four risks related to the Natural Resource Curse and discussed whether or not the EU could overcome them if shale gas was to be a resource windfall.
1. The resource movement effect, which could switch human and capital resources away from the manufacturing sector (supposedly driver of long-term growth) towards the shale gas sector, is a limited risk. Human resources could be drawn out of unemployment (currently at 11.7% in the EU) and the current financial market development should insure proper access to financing.
2. The spending effect happens when extra spending from the resource rent leads to a real increase in the real exchange rate. The threat of a (even) higher exchange rate could be avoided if governments spend their share of the extra income wisely. For example, most EU members could first work on reducing their debt. Would the income happen to be very significant, further measures such as establishing a saving/ sovereign fund or pledging to a capped exchange rate, could be envisaged. 3. The rent-seeking risk, which could arise with easily appropriable resources (e.g., diamonds)
in countries with weak institutions, is mitigated given shale gas is hardly technologically appropriable and EU institutions are generally strong.
4. The increased exposition to volatile commodity prices, which could lead to lower
accumulation of physical capital, is of importance. However given the EU economic diversification (and the relative low current importance of the gas sector) and the hedging tools available thanks to developed financial market, this risk is well constrained.
In a nutshell, if we have faith in our democratic system and believe our political leaders will implement the right forward-looking policies (rather than short term demagogic ones), then EU members have the tools in hand to turn the hypothetic European shale gas revolution into an economic blessing. On the other hand, given the undetermined impact on fuel mix*, the risks associated with the Carbon Curse are more ambiguous.
Still, we believe emissions from fuel extraction (especially methane) and lower incentive to invest in energy efficiency would likely result in a carbon intensification of the economy. So while the Natural Resource Curse does not seem a sufficient to reject shale gas development in the EU, it appears there already is a tradeoff between shale gas development and low carbon intensity.
Although, it is now unquestionable that the US has known a gigantic energy revolution over the last decade, the second point that is left to discuss is whether their shale gas
revolution was and will be truly beneficial. Driven by technological improvements (namely
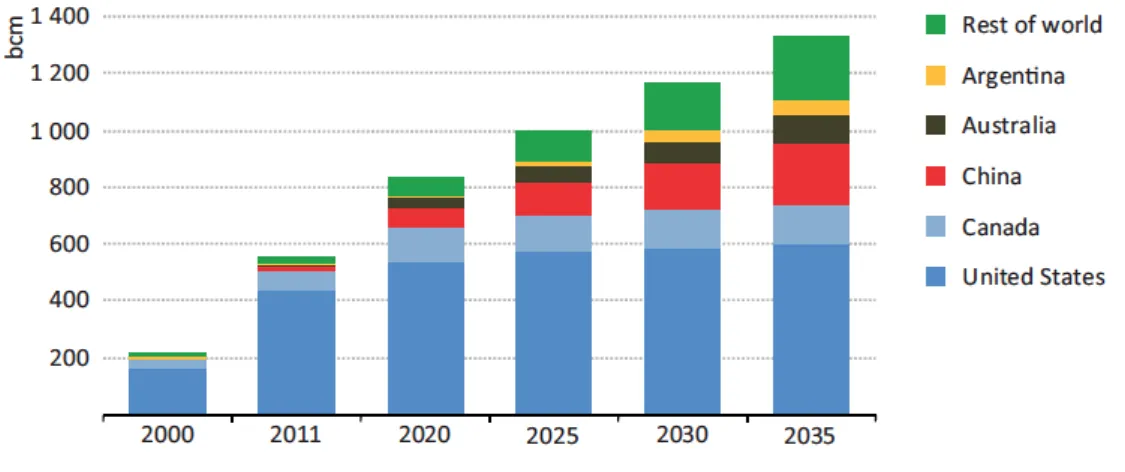
combining fracking and horizontal drilling), surging fuel prices (till summer ’08) and decreasing conventional gas production; the US produced approximately 260 billion cubic meters of shale gas in 2012 up 10x since 2006.
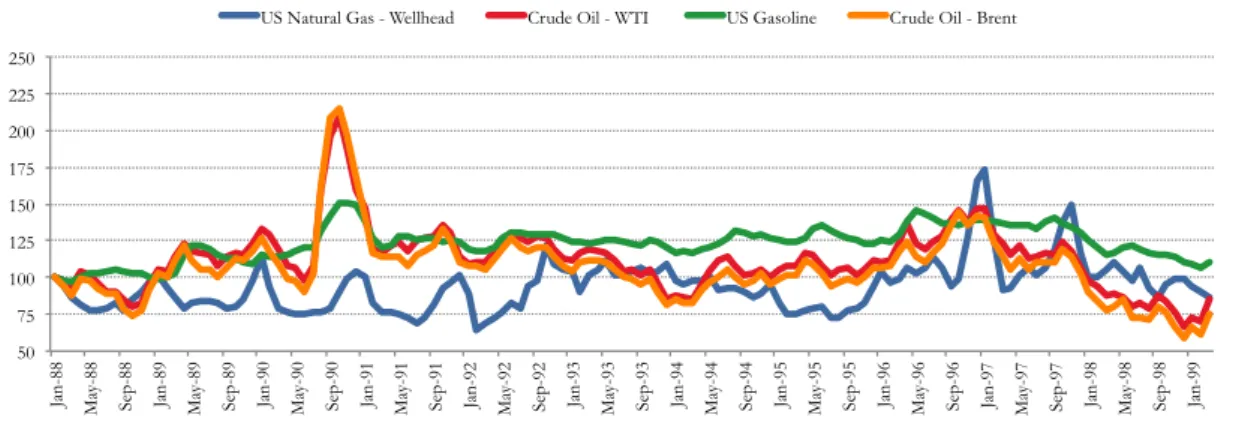
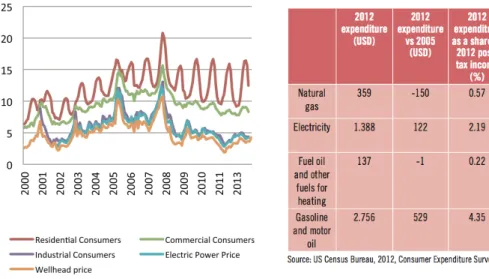
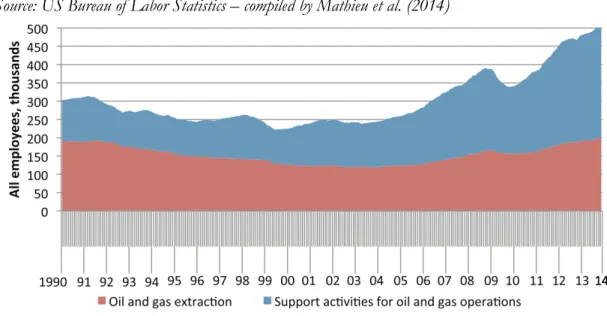
The results of this massive supply of gas were plentiful. First, US gas prices fell impressively. Although they are currently trading at the Henry Hub at $4.5 per MBtu, 2.5x higher than their 2012 low point, there are still c. 3x lower than in Europe and have largely de-correlated from US oil prices (which have roughly bounced back to their pre-crisis level). Second, they US electricity price reached a plateau around 2008. Third, while it did have a local impact on the US manufacturing sector – for gas intensives sectors (e.g., fertilizers and petrochemicals) – the impact on US household purchasing power was very limited. Regarding jobs created to date, we estimated it to be lower than 0.25% of the total US workforce. All in all without shale gas, the US GDP in 2012 would likely be maximum 1% lower.
Regarding profitability, shale gas requires significant upfront investment, which should have easily been paid back. Problems arise when facing with production rate declining typically between 80 and 95% within 36 months (versus sweet spots forecasts) and very low selling prices. In 2012, the gap to finance between revenues and required investment just to maintain production was estimated at $9.5 bn. As per Rex Tillerson, ExxonMobil’s CEO: “we are not making money, it is all in red”.
Regarding the environmental consequences, many will argue shale gas had a major role in the US 9.1% decrease in CO2 emission between ’07 and ’13, allowing for a switch from
coal to gas. While this is a major achievement especially given the 6% real growth in output, we claim at least 80% of this decrease comes from the US decrease in energy consumption and the switch away from fossil energy (towards renewables). Furthermore, we argue cheap shale gas reduces incentives to invest in renewables and this 9.1% decrease might have been bigger without shale gas. Besides, side effects from shale gas exploitation encompass: substantial water usage, more emissions of GHGs (especially methane), earthquakes and public health concerns regarding chemicals used. While a new
experimental technique based on heptafluoropropane could one day prove clean on a large scale, there is no further evidence yet. Last thing we can draw from the past on US shale gas development is that it received a lot of support from the public sector, most notably thanks to R&D funding (via the Gas Technology Institute) and the infamous “Halliburton loophole” in the “Safe Drinking Water Act”. The latter exempts fracking from federal oversight, freeing them from (environmental and regulation associated) costs they would otherwise face.
Looking forward, there are two visions. On the one hand, the enthusiasts (such as the EIA and the IEA) believe US shale gas production will increase at an average yearly rate of 6% between 2011 and 2020 (a total 152 bcm increase). This could allow the US to become net gas exporter before 2020 and greatly reduce* its energy dependence for 2035.
These estimates are based on 207 tcm of technically recoverable resources (TRR) of shale gas worldwide (though only 1.3% are proven), of which the US has 9% (19 tcm) or 84x 2011 production. In a nutshell, there is no problem, they say, keep driving. On the other hand, shale gas detractors argue the EIA has generally been overstating fuel fossil production and they do so because they overstate TRR. They overestimate TRR because they disregard decline in production rate and overstate average recovery efficiency of shale gas (versus conventional gas). Their view is that US TRR are around (6.8 bcm) or 10x 2011 production. Yet, they agree in situ resources are gigantic, but they believe the enthusiasts underestimate the economic barrier (technology and price) and the Energy Return On
Energy Invested barrier (EROEI). You hit the first economic barrier when it becomes
unprofitable or technically impossible to exploit the resource. You hit the second (EROEI) barrier when the energy returned (from the resource) is lower then the energy invested. Indeed, it takes energy to get energy. If the EROEI is below 1:1, then the resource cannot be considered a net source of energy and should rationally not be exploited. The EROIE barrier does not include financial investment and environmental costs, the more general Energy Return on Investment (EROI) includes them, which further raise the bar, hence the TRR. We believe measuring the EROI ratio for shale gas, estimating the necessary energy required to extract shale gas while fairly pricing the associated environmental costs, will prove the tipping point between the enthusiasts and the detractors.
The third and last point we have touched upon in this paper is to what extent the US shale gas revolution could be and should be replicated in Europe where shale gas is still at an infant stage. Indeed, while the US drilled more than 12,000 exploratory wells between ’05 and ’10, in the EU barely 50 explorative shale gas wells have been drilled to date. Knowing US Shale gas TRR estimates are still highly volatile, it is clear that European estimates are speculative, at best. Guesstimates (from the enthusiastic EIA) currently add up to 13.3 trillion cubic meters of shale gas TRR in the EU (vs 19 tcm in the US), of which more than 60% is supposedly located in Poland and France. The total TRR estimated represents 27x total consumption of natural gas in the EU in 2011. However, many believe these TRR numbers are overly optimistic*. So to begin with,
TRR are likely to be smaller but also EU plays are supposedly harder to exploit given geological factors. Second, shale gas requires space and the EU is on average 3.5x more densely populated and has a much more fragmented landscape, which would require specific regulation (such as the US “pooling and unitization” system). Third, the US has developed a technical edge regarding unconventional resource exploitation, implying higher EU production costs. Fourth, more stringent legal framework such as complete ban in France or temporary suspension in the Netherlands, could simply forbid shale gas development. While on the other side of the ocean, difference in landholder ownership and Halliburton loophole, make the US legal landscape generally more favorable to shale gas exploitation. Last, stronger environmental concerns and risks associated to oil & gas producers PR image could prevent European corporates to develop shale gas (e.g., BP feared to “attract the wrong kind of attention”).
Given the specificities discussed here above, we believe it would not be possible for the EU to replicate the US shale gas boom. Moreover, despite this gigantic production boom, the revolution did not have a huge economic impact in the US. The real GDP per capita grew, in fact, at a faster rate in the EU (than in the US) over the ’05 – ’12 period. Besides, would the energy required (for shale gas production) be accurately measured and environmental costs be fairly priced (e.g., abolishing the Halliburton loophole), shale gas real EROI could imply much smaller TRR (than expected), greatly reducing its future potential. What is more, other energy sources, which are carbon neutral and infinite, show – in opposition to fossil fuels – increasing trend in terms of EROI. By definition, renewables do not deplete, hence they are the only long-term way to become energy
independent. While we acknowledge we are uncertain of shale gas potential in the US (and in EU), our recommendation would be not to consider shale gas development an economic priority for the EU members but rather focus on enhancing renewable development. On the one hand, would the shale gas actually happen to be a truly beneficial for the US, Europe will share a part of the benefits with cheaper gas prices given LNG development. Further, if scientists were to develop a clean efficient method to exploit shale gas resources, EU TRR will not have vanished over the waiting time; we can keep this real option open. On the other hand, would shale gas prove uneconomic and environmentally dangerous, EU would have developed an edge in another source of energy that we know for sure yields increasing EROI and would have avoided a costly waste of time and energy.
In conclusion, we believe EU members should not (currently) consider shale gas an economic opportunity, despite rejecting the Natural Resource Curse. We acknowledge current US low gas prices might be luring European corporates, however we hope government will not listen to Oscar Wilde and “resist then temptation by not succumbing” to shale gas development. Indeed, money is not the prime mover of the economy; in fact it is energy that gets things done. On the long run, the only long-term way to provide profitable and environmental friendly sources of energy is to engage on the renewable path. We believe the earlier the better. Hence, our opinion is shale gas should not be considered an economic opportunity, but rather a real option, which might well remain unexercised.
Table of Contents
EXECUTIVE SUMMARY ... 1
INTRODUCTION ... 9
PART 1: THE NATURAL RESOURCE CURSE ... 11
1. ACADEMIC REVIEW ... 11
A. THE DUTCH DISEASE MODEL ... 13
B. SUMMARY FINDINGS ... 15
C. THE CARBON CURSE ... 21
2. CASE STUDY ON NORWAY ... 28
A. HISTORIC BACKGROUND ... 28
B. EVIDENCES OF SUCCESS ... 28
C. NORWAY’S PATH TO SUCCESS ... 30
3. WOULD SHALE GAS BE A CURSE FOR THE EU MEMBERS? ... 38
PART 2: SHALE GAS ECONOMICS IN THE US ... 42
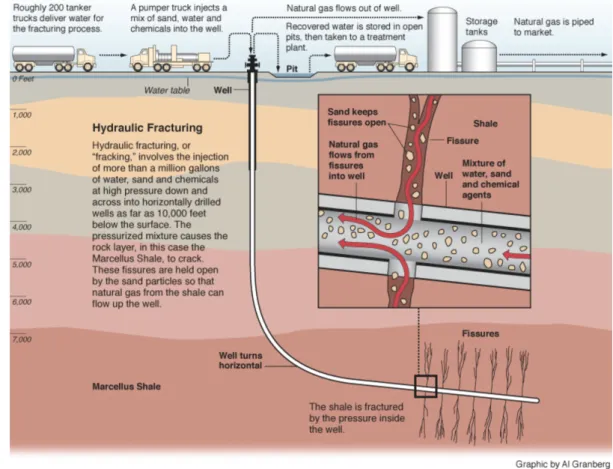
1. WHAT IS SHALE GAS? ... 42
2. EVOLUTION OF SHALE GAS IN THE US TILL TODAY ... 46
A. EVOLUTION OF THE PRODUCTION OF SHALE GAS ... 46
B. SHORT-TERM IMPACTS ON THE US ECONOMY ... 51
C. ECONOMIC PROFITABILITY OF SHALE GAS AT CURRENT PRICES ... 57
D. ENVIRONMENTAL IMPACT OF SHALE GAS AND THE NEW TECHNOLOGY ... 61
E. LEGAL AND INSTITUTIONAL FRAMEWORK ... 68
3. EXPECTED DEVELOPMENT OF SHALE GAS EXPLOITATION:2 POINTS OF VIEW ... 70
A. THE ENTHUSIASTS ... 71
B. THE DETRACTORS ... 78
4. IS SHALE GAS AN ECONOMIC PROGRESS FOR THE UNITED STATES? ... 85
PART 3: SHALE GAS ECONOMICS IN THE EU ... 88
1. CURRENT EUSITUATION VERSUS THE UNITED STATES ... 89
A. ECONOMIC ASSESSMENT ... 89
B. POTENTIAL SHALE GAS RESOURCES IN THE EU ... 91
C. EUROPE FUEL MIX ... 93
2. KEY DIFFERENCES FOR SHALE GAS DEVELOPMENT IN THE EU VS THE US ... 94
APPENDICES ... 104
1. APPENDIX 1:GENERAL ENERGY DATA ... 104
2. APPENDIX 2:NORWAY’S SELECTED ENVIRONMENTAL ACTS AND TAXES ... 108
3. APPENDIX 3:ARE METHANE HYDRATES THEN NEXT REVOLUTION-IN-WAITING? . 109 4. APPENDIX 4:USSHALE GAS PLAYS BY D.HUGHES ... 110
5. APPENDIX 5:EIA FORECASTS FOR USNATURAL GAS PRODUCTION ... 112
6. APPENDIX 6:SELECTED GDP PER CAPITA IN PPS RELATIVE TO EU(28) ... 113
REFERENCES ... 114 1. ACADEMIC LITERATURE ... 114 2. OTHER REPORTS ... 115 3. BOOKS ... 116 4. PRESS REVIEW ... 116 5. WEBSITES ... 117
Introduction
Within the last ten years shale gas production in the United States has increased tremendously. Starting from less than 2% of US total natural gas, it is now their single biggest gas supply source. Some experts argue the shale gas revolution, which slashed US energy cost, helped them overtake the latest financial crisis, created hundreds of thousands of jobs and could allow them to become energy independent before 2035.
Although this formidable boom has raised many environmental concerns, it is foremost the impressive economic opportunity that is currently at the heat of the discussion. Indeed, many believe shale gas could be a solution for over indebted and energy dependent Europe. However, even leaving aside the environmental aspects, many economics concerns remain.
First, History shows that natural-resource rich countries have not all enjoyed the expected positive impact on their economy. For example, the real average annual output growth of the OPEC members was one percent* lower between 1965 and 1998 than
peers, despite their large oil & gas production. This phenomenon, labeled Natural Resource
Curse, is known for taking place in developing countries where specific factors such as
corruption or despotism are more likely to hinder the use of the resource. More surprisingly, developed country – most infamously the Netherlands in the 60s – endured similar faith following the discovery of a new resource. Specifically, the Dutch discovered a massive natural gas field in Groningen in 1959, which quickly made them a net massive gas exporter. Appreciation of the real exchange rate and relative deindustrialization swiftly moved the country into recession. Although, this economic failure – labeled Dutch
Disease – is a real treat, it is by no mean unavoidable. Several countries such as the
Botswana, Chile or Norway have fruitfully managed the opportunity of a new resource via strong institutions and forward-looking policies.
Second, many authors have began to question the seemingly overly optimistic forecasts of the US shale gas boom… Recent studies indeed show that shale gas wells production rate decreases much faster than initially forecasted, raising concerns regarding the
* OPEC members experienced a real GDP annual growth rate of 1.3% versus 2.2% for other developing
profitability of the investment made and the actual size of the technical recoverable resources.
Third, major differences exist between the US and the EU and what could turn profitable for Uncle Sam might well not be elsewhere. The amount of the shale gas recoverable, the availability of techniques to do so, the willingness to finance the required heavy infrastructure, the readiness to bet on the environment, or even the legal framework surrounding shale gas, might all prove tipping points regarding shale gas development in the EU.
The aim of this paper is to discuss these economic concerns in order to elaborate a thoughtful judgment on whether or not shale gas should be considered an economic opportunity by the EU members.
Part 1: The Natural Resource Curse
1. Academic Review
Natural resources are a blessing. The Mythology told us Zeus grew up and survived thanks to Cornucopia (the horn of plenty), which had the supreme power of providing unending nourishment. Back on earth, an abundance of natural resources should also foster (economic) growth. Indeed, additional exports and resources rents could be used to import more goods, boost capital investment and build up the economy. However, most resource-rich countries, mostly in Africa, the Arab World and South America, have in fact underperformed.
Although the term (Natural Resource) Curse first appeared in 1988, when it was used in Gelb’s book (1988) “Oil windfall, blessing or curse?”, the course of history has seen numerous resource-rich economies toppled by resource-poor ones. For example, relatively resource-poor Netherlands in the seventeenth century became the continental economic power despite Spain’s large inflow of resources (e.g., gold, silver) from its colonies in the Americas. Over the last two centuries, Japan resource-poor economy eclipsed Russia and its abundant resources. Nevertheless, this “Robin-Hood peculiarity of the poor taking over the rich” does not always hold. The abundance of a specific resource (e.g., coal and iron) also proved key to the development of economies, as coal and iron was for the UK and the US in the nineteen-century or diamonds to Botswana over the last century. However, failing transport costs (paradoxically driven by the rise of our carbon-based economy) made the necessity – to have a specific resource within an economy to achieve a strong economic growth – nowhere as important as it was two centuries ago. The advantage of owning natural resources has thus been partly offset by the decrease in cost of transport. Still, the question remains open: how this blessing could de facto be a disadvantage not to mention a curse?
Several early hypotheses can already be drawn to explain this oddity:
From a social perspective, one could simply argue that easy riches lead to laziness; the “lazy kings” – of the seventh and eight century – are another example of History. A more sophisticated approach from Lane and Torrel (1995), argued that politicians in resource-rich economies are more subject to rent-seeking behavior, which could lead to a “feeding frenzy” were competing factions deplete the resource fighting each other. This
is unfortunately best illustrated with Nigeria, were oil revenue per capita increased form US$*33 in 1965 to $365 in 2000. While, income per capita stagnated around $1100 and
inequality skyrocketed putting Nigeria in one of the 15 poorest populations in the world. From a strict economic point of view, Prebish and Singer (1950) among others argued that a resource-based growth would be ineffective as the world prices of primary exports relative to manufactures have long term negative trends. Similar views state that the global demand for manufactured goods will outpace the one for primary products. Moreover, economies relying on a primary resource are more exposed to swing in prices and external economic shocks. Furthermore, papers from Hirschman (1958), Seers (1964) and Baldwin (1966) converge with the main idea being manufacturing requires a more complex division of labor, as opposed to resource-based production, which leads to a higher standard of living.
Later van Wijnbergen (1984) and Matsuyama (1992) developed models of “forward and
backward linkages”. The later postulated that a surge in primary goods exportation could
negatively affect economic growth through these linkages. His model has two sectors, agriculture and manufacturing. The latest has “learning economies (i.e., learning-by-doing)”, meaning the sector efficiency is positively correlated with the total manufacturing output. If resources shift away from manufacturing to agriculture, this could hinder the learning, hence future economic growth (in case of a small open economy).
In conclusion, many relevant theories were developed prior to the work of Sachs and Warner †(1995) that could help explain the paradox raised by the natural resource curse.
If we were to vulgarize, we could say they all fit into two boxes. The first category encompasses the theories that state weak institutions and short-sited governments led to a misuse of the resource. The second argues it is a switch away from the manufacturing sector – supposedly guarantor of long-term economic growth – that had negative impact on output. We have purposely omitted the work of Corden and Neary (1982) on the Dutch Disease, as we considered it core to the explanation of the Natural Resource Curse and decided to detail it in the section hereafter.
* $ stands for US$, unless otherwise stated. † See 1.B Summary Findings
a. The Dutch Disease Model
Corden and Neary (1982) developed what is now considered the core Dutch Disease model. The framework evolves around a small open economy, which consists of three sectors: a tradable natural resource sector, a tradable (non-resource) manufacturing sector and a non-traded sector. Under several assumptions* and different cases, they studied the
impact of a resource boom on the economy through two main effects: the resource movement effect and the spending effect.
The resource movement effect illustrates the fact that the boom in the natural resource sector raises the marginal products of the mobile factors employed there (e.g., a higher equilibrium wage rate, higher return on capital) and so draws resources out of other sectors.
The spending effect translates the impact of the increase in income of a country (through a boom in the natural resource sector). Higher real income leads to extra spending on both tradables (e.g., manufacturing) and non-tradables (e.g., services), which raises their prices. However tradable goods prices are set internationally, hence extra spending leads to a relative increase of the prices (and wages) of the non-tradable sector versus manufacturing and results in an increase in the real exchange rate. Moreover, it switches mobile factors (e.g., labor, capital) out of the manufacturing sector.
As a result, the real exchange rate appreciates and the manufacturing sector shrinks, this phenomenon is called the “disease”. Although there is nothing wrong in itself in the shift away from a manufacturing sector, this could lead to future chronic slow growth if manufacturing is characterized by positive externalities (i.e., linkages and learning economies). With other words, a country – that could trigger a boom in its natural resource sector (e.g., following the discovery of a new resource) – faces a trade-off between short-term economic improvements (thanks to the new revenues from the resource) against potential long-term cost of a lagging-manufacturing sector. However, the authors remind us that governments could play a major role in offsetting the spending effect, hence partially preventing the deindustrialization. Indeed, a large part of
* Major assumptions include: models are purely real ones that ignore monetary considerations, all goods are
used for final consumption only (later relaxed), national output and expenditure are always equal (so that trade is always balanced overall), real wages are perfectly flexible (ensuring full employment, later relaxed).
the rents of the natural resource sector typically goes to the government via taxes or state-owned enterprises. The manner in which the public authority decides to devote this extra income could switch the magnitude and even the direction of the spending effect (e.g., exchange-rate protection).
b. Summary Findings
Sachs and Warner (1995) work is considered the classical most comprehensive on the Natural Resource Curse. They empirically demonstrated, through cross-country regressions, a negative correlation between abundant natural resources and economic growth*. Their paper shows that, even controlling for other relevant variables, economies
with a high ratio of natural resource exports to GDP experienced significant sub-par growth rate between 1971 and 1989. Interestingly, other factors seem to have statically significant positive impact on economic growth such as Openness or the integration within the global economy (i.e., trade policy), characterized by low tariffs and quotas as opposed to protectionism; Investment relative to GDP; initial real GDP per capita; and the quality of
Bureaucracy. The terms of trade volatility or the income inequality did not prove significant when
controlling for the other variables.
The authors conclude that natural resource intensity and openness represent additional explanations for economic growth even in the presence of other variables. Moreover there were only two† cases of resource-rich developing economies, Malaysia and
Mauritius, which manage to achieve a per capita growth rate of at least 2% over the period. The authors argue that this is very interesting as both are very open economies with zero tariff Export Processing Zone to stimulate manufacturing exports. They argue that even in this case, the growth was rather driven by their manufacturing exports than by their abundant resources. Finally, they conclude with a recommendation to resource-rich governments not to solely focus on promoting non-resource industries via subsidies or other protection. Indeed, exploiting new natural resources may prove valuable for consumption (though less for growth) and simpler policies such as open trade should have a more significant impact on growth. While acknowledging the quality of their work, several authors (among others van der Ploeg (2010) – see hereafter) suggest several other factors should be taken into account (e.g., volatility, education, wars) and highlight the necessity to move from cross-country regressions to panel data. Nevertheless, their work and findings are considered key to this paper.
* As measured by real growth rate of purchasing power parity adjusted GDP. † Botswana would probably also have been included but observations were missing.
Auty (2003) states that there are two main reasons to explain the better economic performance of the resource-poor countries. First, these countries are more likely to develop independent political system focusing on raising the welfare of the entire population (i.e., the staple strap model). Second, chances are they diversify much faster into manufacturing, bringing high and efficient investment to this sector (i.e., the competitive industrialization model).
In the same paper Auty also provides guidance on how to manage different type of resources, more interestingly for this work, finite resources. Despite the apparent contradiction, economists believe it is feasible to exploit finite resources in a sustainable way. Indeed, sustainability does not require the resource to be passed onto the next generation but rather the capacity to sustain the income stream from the finite resource, with for example an educated workforce. At the local level, he recommends communities to avoid increasing their dependence on the resource and save a fraction of the rent to latter provide alternative employment opportunities and restore the environment to its pre-exploitation state. At the national level, the capital-intensive characteristics of many finite resources (e.g., oil, gas, mining) versus more labor-intensive renewable sources (e.g., forest, agriculture), leads to concentration of the resource within few hands including the government through taxation and state-owned operations. This greatens the risk of policy failure due to an accelerated absorption of the finite resource rent, compare to the higher savings rate one could expect from a larger number of individuals (e.g., farmers). Indeed, governments tend to overspend while most individuals have a greater tendency to save. The author suggests the use of environmental and natural resource accounting (EARA) tools to avoid these policy failures. First, he goes in the direction of Pearce (1996) arguing the ENP (defined hereafter) should not be declining over time. Second, he introduces the concept of genuine savings (GS, defined hereafter) stating that newly industrialized countries have high and rising GS/ GDP ratio between 20 and 30%. Whereas, resource-rich economies show low to negative numbers, suggesting part of their growth is not sustainable. EARA key finding suggest these resource-abundant countries should reallocate resources away from depleting these resources towards diversified investments in order to lower their reliance on finite resources.
1) ENP2 = GNP – DP – DR – DE + E
! ENP2 = environmental national product adjusted for depletion of finite and
environmental resources ! GNP = gross national product ! DP = depreciation of produced assets
! DR = depletion of finite natural resource assets
! DE = depletion of environmental assets (i.e., pollution, destruction)
! E = net increase in education
2) GS= ENP2 – C – G
! C = private consumption ! G = government consumption
More recently, van der Ploeg (2010) discusses the factors that differentiate natural resource abundance from being a blessing rather than a curse. Based on his work enriched with the views of the authors he refers to, we were able to summarize key effects of a natural resource windfall. As previously discussed, a resource windfall leads to appreciation of the real exchange rate (spending effect), a draw of resource out of the manufacturing sector (resource movement effect), which leads to deindustrialization (i.e., the Dutch Disease model). Moreover, it can also result in a global decrease in the quality of
institutions and an increased exposure to volatile commodity prices.
i. Quality of Institutions
The vast majority of studies tend to agree that the quality of institutions (including government) has a strong positive correlation with economic growth. Unfortunately, a resource windfall could result in a worsening of their quality unless they were strong and resilient enough. Indeed, resource-rich governments have more power and more value to be in power. Thanks to their resources, they can, among others, buy off political opponents (e.g., Mobutu) or bribe citizens (e.g., grant private license, offering well-paid inefficient public job) to remain in power and therefore lowering their political accountability. While grabbing the (short-term) rent of their policy, political elite actions could also result in a reduced overall transparency and efficiency of the legal system – hence effectiveness of property right – increased in corruption, crimes, conflicts and even wars. So the behavior of the people in charge could clearly lower the quality of
institutions, which could have disastrous impact on economic growth and social welfare. Here is how.
First, weak institutions incentivize rent-seeking behavior. This is true for political leaders, which in extreme cases could lead to armed conflicts or civil wars with the well known disastrous impacts. But also for productive entrepreneurs who might enjoy higher return rent seeking if, for example, property rights are neglected. In equilibrium, there are fewer productive entrepreneurs and the economy is worse off. This is especially proven if the resources are easily appropriable from both a technical and an institutional point of view. With other words, Boschini and his colleagues (2007) demonstrated that the more a resource is valuable, can be easily transported, stored and sold (e.g., diamonds or gold) the more attractive it is to rent seeking, hence the larger the negative impact on growth. Interestingly, they also showed that the quality of institutions could completely offset the economic impact of a resource on a given economy. That means, when provided with the appropriate institutional framework, any resource could prove an economic boost.
Second, a false sense of confidence – given by the resource bonanza – might lead governments to take on unsustainable policies. A common mistake made by resource-rich countries was to borrow excessive amount using the resource as collateral. When the resource price fell this led countries into debt crisis. Another example of unsustainable policies is the response of the Dutch governments following the discovery of the natural gas plan. They built a too generous welfare state, among others expanding unemployment and disability benefits and raising the minimum wage. After what, it took them more than two decades to put their economy back on track.
Third, it is self-obvious that weak institutions result in a reduced social welfare. A weaker juridical system will induce more crimes, a lower education and more poverty. So long as welfare can be measured, this results in lower life expectancy and human development index score.
On the contrary, Acemoglu et al. (2001) have shown African colonialist institutions have in general persisted and have had a very important impact on current institutions. So the view institutions could be worsened should be taken with precaution, tough History shows governments have often behaved unwisely following a resource windfall.
ii. Exposure to volatile resource prices
Given the (short-term) low price elasticity of their supply, resource prices and revenues are highly volatile. As previously discussed volatile resource prices can throw countries into debt crisis. Besides, Cashin (2004) empirically found out a relationship between resource prices and real exchange rate of the resource-exporting country. Hence an increased volatility of the real exchange rate or with other words increased uncertainty for foreign investors. This increased risk coupled with a poorly developed financial system (where for example only debt is available) may result in liquidity issues leading to costly bankruptcy. As a result, interest rates rise, there is less investment and reduced economic growth. Furthermore, increased volatility and risk encourages rent seeking, which destroys value.
The perverse effect of volatility on growth is especially strong for countries with technically appropriable resources with weak financial institution. In this context volatility is not only bad for growth and investment but also for income distribution, poverty and educational attainment (Aizenman and Marion, 1999).
Leong & Mohaddes (2011) revisits the resource curse paradox and argues that volatility, rather than abundance per se, drives the curse. Their results not only show the expected negative effect of resource rent volatility on growth, but it also indicates that resource abundance (proxied by real resource rent per capita growth) has, in fact, a positive impact on economic growth. Moreover, their findings suggest that sound policies and good institutions can offset part of the negative growth effect of the volatility. Indeed, good institutions can help set up accountable and transparent government bodies, which will productively use the rents and prevent rent-seeking behaviors. They go further suggesting resource-rich (developed) countries could offset the volatility curse by setting up forward-looking institutions such as Sovereign Wealth fund or stabilization fund (saving when prices are high – spending when they are low). Proceeds could be used to further develop institutions and human capital in order to enhance productivity and ultimately growth. Last, they join many authors highlighting the role of financial market in reducing uncertainty, hence volatility. In a later article, Mohaddes et al. (2012) illustrated how commodity price volatility impacted the three growth channels: total productivity factor, physical capital accumulation and human capital acquisition. Their results suggest volatility mostly lowers the accumulation of physical capital. This is likely
for three reasons. First, economic agents might perceive the resource rent as permanent source of future income, therefore saving less. Second, risk adverse agents would choose to accumulate less physical capital if its value is highly volatile. Third, macro-economic volatility negatively affect the default risk, increasing interest rate and lowering the borrowing capacity. All in all, volatility seems to negatively impact output growth through lower accumulation of physical capital. This result is in line with many authors including Papyrakis and Gerlagh (2004), Gylfason and Zoega (2006) and Esfahani (2009). Data from the World Bank and authors previously cited (Auty and van der Ploeg) also show that resource-rich countries often have negative genuine savings rate.
In a tentative to recapitulate, we would try to end this section on a bright note. Indeed, we share the opinions of many and are convinced a natural resource windfall is not per se a curse. With strong institutions preventing rent seeking and forward-looking governments putting in place the appropriate policies, it could well be a blessing. As Gandi said “the world has enough for everyone’s need, but not enough for everyone’s greed”.
c. The Carbon Curse
Friedrichs and Inderwildi (2013) have developed the Carbon Curse: a new theory, related to the Natural Resource Curse but standing on its own. Their findings suggest fuel rich countries are condemned to high carbon intensity*. While both theories focus on
detrimental effects of resource abundance (i.e., curses), the Carbon Curse stands on its own and seems less paradoxical. When most would expect a fuel rich country to emit more CO2, little would believe a resource windfall to have a negative effect on growth.
Even if less paradoxical, the Carbon Curse is still highly interesting given the undesirable effect of green house gases (GHGs) on climate change and the “new” economic cost of CO2 emission. Even though current carbon world prices are quite low, the Economist in
December 2013 highlighted how the internal carbon price used by some companies was much higher. At the time, the market price was €4.90 ($6.70) per ton of CO2 in the EU
and $11.50 in California; while internal prices for big oil company were above $34 (up to $60 for Exxon Mobil). Moreover, the US administration recently estimated the social cost of carbon at $37 a tone. At these prices, the Carbon Curse becomes more than an environmental curse; it becomes an economic one.
The researchers based their findings on an explanatory data analysis, yet using a representative sample. Figure 1 shows oil-rich countries in red and coal-rich countries in blue†; it clearly indicates how fuel rich economies tend to emit more CO
2 to produce the
same amount of GDP all other things being equal. When, technically advanced resource
* Measured by CO2 per GDP.
† While Russia could be considered oil, ga zand coal rich. Figure 1: National Carbon Intensities in 2008.
poor economies show lower carbon intensity. The only outliers are Norway, Nigeria and Angola. While Norway is a positive outlier we will later discuss. Nigeria and Angola relative low carbon intensity is explained by a lower income per capita and level of industrialization.
Interestingly, the Carbon Curse is not a static theory. The authors also looked at how the carbon intensive evolved between 1996 and 2008 to determine whether or not they would be able to draw significant patterns in term of decarbonization. As a matter of fact, they distinguished three groups:
1. Seven countries managed an absolute decrease in carbon emission over the period. All of them were highly developed, technically advanced and fuel poor (e.g., France, Denmark, Germany, Singapore, Sweden). With the only partial exception of UK, which could have been considered fuel rich*.
2. Others reduced their relative carbon intensity but at a slower pace than the growth of their economy. The compounding effect resulted in an absolute increase in carbon emissions. This group, unfortunately, includes the largest players such as China, India and the US. Friedriechs (2013) stated: “during the 2000’s the (global) economy decarbonized by 0.77% per annum but this was more than offset by average economic growth. As a result, global CO2 emissions kept rising.”
3. The last group suffered massive emission intensification due to a relative increase in carbon intensity coupled with output growth. All countries within this group are either major coal producers or petro-states. Moreover, they are all OPEC members but for Norway.
Invariably, countries with the highest absolute growth of CO2 are fossil-rich.
Trying to explain this phenomenon, the authors suggest the Carbon Curse has, at least, four roots. The extractive emissions from fuel, the fuel-related resource movement
* British Oil & Gas production peeked around the year 2000 and they became net importer five years later.
effect, the reduced incentive to invest in energy efficiency research and the pressure to provide cheap fuel.
i. Extractive emissions from fuel
First, it takes energy to get energy. Hence, fuel-rich countries emit significant amount of GHGs in the extraction of their domestic fuel. This is the concept of energy returned on
energy invested (EROEI), which will greatly be developed in the part 2. Different sources
yield different results, but people tend to agree these rates are declining and while Old Conventional Oil yielded 100:1, New Conventional Oil is closer to 25:1, Tar Sands between 5 and 3:1 and first generation biodiesel below 2:1. Even with a highly beneficial EROEI, the mere size of the extracting sector is sufficient to generate significant emissions. But when focusing on harder resources to exploit, like Tar Sands in Canada, lower EROEI results in even more CO2. Interestingly for this paper, unconventional
sources (e.g., shale gas) are characterized with (much) lower EROEI than conventional sources (see Part 2).
ii. Fuel-related resource movement effect
Second, the Dutch Disease plays a (dual) role. As previously discussed, a resource windfall through the resource movement effect leads to deindustrialization. Although, this first effect could have a negative impact on output growth, this has a positive impact on carbon intensity. The manufacturing sector being one of the most polluting, a deindustrialization reduces the amount of CO2 emissions keeping all other things equal. Sadly, this is no the end of the story. Easy access to domestic resource greatly influences country fuel mix. For example, Saudi Arabia generates 65% of its electricity via oil, despite a high potential for renewables and vast gas resources.
As a rule of thumb, coal has the biggest carbon footprint of all fossil fuels, while gas has the smallest and oil is somewhere in between. Figure 2 helps distinguish three groups.
1. In green, fuel-poor countries all show a small relative size of their extracting industries and a low carbon intensity. Even the negative outlier, South Korea has modest carbon intensity.
2. In blue, coal powered countries (including Canada with its Tar Sands) have higher carbon intensity while maintaining small mining & utilities sectors. The authors argued this happened for historical reasons; coal has first enabled their industrial development rather than being directly massively exported. However the dramatic carbon footprint of coal results in disproportionately high carbon intensity with regards to their extracting sectors.
3. In red, oil-rich countries may show very different carbon intensity. Some countries manage to effectively fight extractive emissions and crowding out effect, such as Norway. While others use the resource wealth for high-carbon Figure 2. Relationship between carbon intensity and the size of mining and utilities relative to GDP.
lifestyle such as Saudi Arabia. Even worst, Iraq, one of the most carbon intensive countries, is also in the top-five of gas flaring countries according to the World Bank.
iii. Lower incentive to invest in energy efficiency
Third, fuel abundance tends to weaken incentive countries may have to invest in energy efficiency research. Obviously, this results in higher energy consumption per GDP unit. The security and sense of confidence given by their cheap source of abundant energy, lowers their needs to spare. One could argue that high world prices could suggest more domestic conservation for fuel rich countries, however people within fuel-rich economies often deal with heavily subsidized prices.
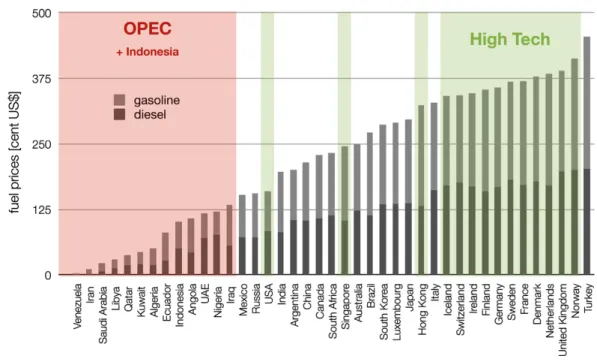
iv. Pressure to provide cheap fuel
Fourth, people in fuel-rich economies often feel birthright to enjoy low fuel prices, which put pressure on governments to offer them so. Moreover, given the large spread between the market price and the production cost, subsidizing fuel is often not a fiscal expenditure but rather an opportunity cost. For fuel rich a loss of potential export income is more acceptable than a direct cost. This leads to very different prices per countries.
On Figure 3, one could see combined pump prices for diesel and gasoline per country. This is used as a proxy of the net affect of subsidies and taxes on fuel. First, it is remarkable to see the wide rang of prices for one litter of gasoline plus one litter of diesel, starting at $0.03 in Venezuela to reach $4.55 in Turkey. Leaving aside the Turkish outlier, the upper range consists of only high tech countries*, while all† the OPEC
countries are at the bottom. This highlights the correlation between fuel-rich and fuel subsidy. Not only were those 12 OPEC countries heavily subsidizing fuel, but also none of them saw a decrease in emission between 1996 and 2008. Moreover, 8 of them have even seen a worsening of their carbon intensity.
To finish on a brighter note, the authors looked at the positive outliers, namely Norway and to a lower extent (see here above) the UK. Despite Norway being one of the world largest oil exporters, their carbon intensity – tough increasing – is on par with other developed fuel-poor countries (see Figures 1 and 2). Their recipe lies between high R&D investments in energy efficiency (e.g., leader in carbon capture and storage (CSS)), strong regulators managing the resources and imposing hefty taxes on fuel (see Figure 3) and aggressive promotion of renewable energies. Similarly to the Natural Resource Curse,
* The fifteen most advanced high-tech economies as defined by the Global Competitiveness Report. † Indonesia considered OPEC, as they were a member till 2008
Figure 3. Combined fuel price for diesel and gasoline as of November 2010.
strong (environmental) institutions seem to be a (if not the) solution to the Carbon Curse. However, the later seems even harder to tackle, as even developed countries are not immune to it. In December 2011, Canada announced its withdrawal from the Kyoto Protocol to further exploit its tar sands. The Carbon Curse could also affect Australia and Germany (though a leader in renewable energy), which heavily rely on coal. Even more dramatic, the authors suggest: “there may even be a be a Carbon Curse at the planetary level. Climate change would be less severe if the planet were less richly endowed with fossil fuels, or if fossil fuels were harder to get (…)”. Fortunately, all is not gloom and there are also positive outliers who prove the Natural and the Carbon Curses are not written in stone. The next section will be a focus on the notorious Norway example to get a better understanding on how they overcame these curses.
2. Case Study on Norway
*Norway is a cold northern sparsely populated country, . According to the CIA, there are just over 5.1 millions inhabitants, which ranked Norway 121st most populated country.
However, it is of economic significance with a GDP estimated at $516 billions (slightly larger than Belgium or Poland). But we are not interested per se into their economics muscles, what drew our attention to this country is what lies underneath their grounds (and seas) – most notably how they successfully exploited it. Indeed, Norway is respectively the 3rd and 9th largest net exporter of natural gas and crude oil in the world
(see Appendix 1). As previously discussed, one could expect Norway’s economy and carbon intensity to be (largely) lagging behind peers due to the combined effect of the Natural Source and Carbon Curses. However they managed to vastly overcome both curses and we are going to study how.
a. Historic Background
First known through the Vikings, the first sign of a united Norway kingdom is to be found around the year 900. After half a millenary of sovereignty, Norway was included in a union with Denmark till 1814. That year, they resisted a cession of their country to Sweden and adopted their own constitution. This did not last long, as Sweden invaded Norway shortly after. In 1905, a referendum finally led to Norway’s independence. They have remained independent, though occupied by the Nazis during World War II, until today. Discovery of large offshore oil and gas reserves in the late 1960s led to strong economic growth. In 1972 and 1994, their population voted against joining the European Union.
b. Evidences of success
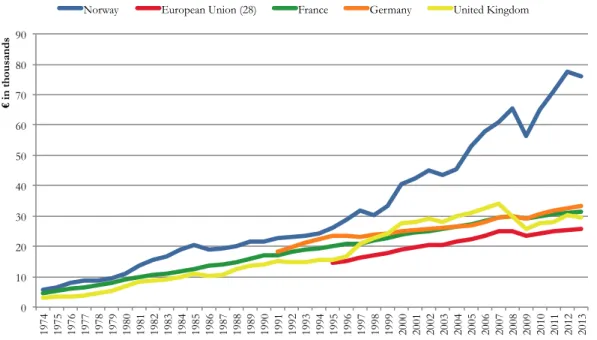
With the Figure 4 below, we wanted to highlight Norway’s economic success, as proxied by GDP/ capita. The Figure illustrates the GDP/ capita at current market prices for the three largest economies in the EU, for Norway and the EU (28 countries) average. Often the scarcity of reliable historical data complicates analysis. However, Norway’s economic edge towards its available benchmarks is so gigantic that we believe no further analysis are required to demonstrate its economic success.
* Most of the data comes from the CIA World Fact Book and was crosschecked with other sources
So today, it is clear that Norway’s story has been a success. In numbers, they have one of the world’s highest GDP/ capita around $100,000*, a low public debt at around 30% of
GDP, one of the highest budget surplus at 13% of GDP and a stunning unemployment rate at 3.6%. From a social perspective, it has one of the 7th most equal distribution of income with a Gini Index score of 25 and simply the highest Human Development Index score. In terms of ecology, the picture is bright but not perfect. Given their large production of oil and gas, their carbon intensity has been increasing (see Carbon Curse) and lies within European peers (see Figure 1), yet below Denmark and Finnish
neighbors. To be comprehensive, we have to add that Norway also faces domestic issues among which its ageing population looks the most significant. Besides, Castellacci (2008) shed new light on the so-called Norwegian Paradox, according to which Norway is characterized by a peculiar low innovation and high economic performance. He argues Norway’s innovative activities are, on average, above peers but that the crowding out effect (due to the boom in the energy sector) led to underinvestment, lack of resources and scale within these productive sectors – resulting in an aggregate below average innovation. He suggests this might put the economy at risk in the post oil era if no “pro-innovation” policies are taken (e.g., an incentive scheme to encourage private
* The IMF, the World Bank, the CIA and United Nations all rank Norway in the top 5.
Figure 4: GDP/ capita at current market prices for Norway and available benchmarks
Source: Eurostat. 0 10 20 30 40 50 60 70 80 90 1974 1975 1976 1977 1978 1979 1980 1981 1982 1983 1984 1985 1986 1987 1988 1989 1990 1991 1992 1993 1994 1995 1996 1997 1998 1999 2000 2001 2002 2003 2004 2005 2006 2007 2008 2009 2010 2011 2012 2013 € i n t hou san ds
investments and the entry of firms in high-tech sectors). Nevertheless, most will think the pros largely outweigh the cons and conclude Norway is in an excellent economic and environmental shape. All in all, they overcame the two curses. The question we have – already touched upon – but have yet to answer is how they achieved this.
c. Norway’s path to success
In this section we will look at the necessary structures (e.g., strong institutions) and the specific policies (e.g., Sovereign Wealth Fund) developed by Norway. We will mostly focus on their peculiarities (e.g., importance of the state) and their specific policies rather than their general institutions, as considered more insightful in our case (EU members have, in general, democratic governments, strong institutions and an open economy).
i. Strong democratic government and institutions
According to the Constitution of Norway, passed in 1814 – shortly after the country freed up from Denmark – the country is a constitutional monarchy with a unicameral parliament, the Storting. In 1905, the parliament (which holds the legislative power) proclaimed independence from Sweden and crowned Prince Carl as King. As far as quality is measurable, A Pestle Analysis by Marketline, states the domestic government is considered to be one of the best in terms of policy implementation (e.g., heavy tax reforms in 2008 and strict environmental policies). An older example of their avant-gardist policy implementation was to introduce universal suffrage for women as early as 1913 (long before the UK in 1928 or France in 1944). It is important to know that the country has a multi-party system* wherein the different political forces often have to
form coalition to gain majority. However, the Labor Party is and has often been the largest party in Norway. It governed the country from 1935 till 1981 except for three†
short periods of time. After what, Conservative-led coalitions succeeded Labor-led governments several times until now when Erna Solberg (Conservative) succeeded Jens Stollenber (Labor) as prime minister (which de facto holds the executive power). Norway’s recent key economic policies were: to achieve a more equal distribution of income (by regulating income tax), to implement a 4% limit on using returns of the
* Following the 2013 election, eights parties are represented in the parliament, of which the Labor Party (55
seats) is the largest followed by the Conservative Party (48) and the Progress Party (29).
Sovereign Wealth Fund, to increase spending on education and health and last but not least to pledge to reach Carbon Neutral by 2030.
The Norwegian’s government is not only strong in policy implementation but also in terms of corporate control. According to Marketline (2013), the state accounts for more than 50% of the country’s GDP and owns around 35% of the market capitalization of the listed companies on the Oslo stock exchange. For example, they held large stakes in key sectors including:
! Petroleum (around 67% stake in Statoil)
! Telecommunications (around 54% stake in Telenor)
! Aluminum production (around 44% stake in Norsk Hydro) ! Fertilizers (around 36% stake in Yara International)
! Hydroelectricity production (100% stake in Statkraft) ! Banking sector (around 34% stake in DNB bank)
Now that we have covered the legislative and executive power, we shall turn towards Norway’s judicial system. As one would expect, it considered very liberal, sound and effective by most; enforcing property rights and contracts. Perhaps more surprising, it even has the power to suspend a ruling passed by the government. This strong and judiciary is probably to be credited for one of the lowest corruption* in the world.
All in all, these result in Norway being ranked 9th by the World Bank (June 2013) on the
ease of doing business, better than any member of the European Union but for Denmark.
ii. Economics openness and developed financial market
Although the Norwegians rejected their government’s recommendation to join the European Economic Community (EEC) in 1972, the country signed a free trade agreement† with the EEC one year later. Norway has also ratified the EU-EFTA accord,
which created the European Economic Area‡ (EEA) in 1994. Furthermore, a member of
* The Corruption Perception Index currently ranks Norway 5th best (out of 177 countries). † Norway currently is a member of the European Free Trade Association (EFTA).
the World Trade Organization since its foundation in 1995, they also implemented a Generalized System of Preference (GSP) – scheme, under which 90 developing countries benefit from a duty relief on the vast majority of products. These favorable trade links, sign of clear openness, have helped the economy flourish over the past decades.
In terms of financial development, which can help tackle the Volatility Curse (hence the Natural Resource Curse – see above), Norway first significant step was to set up the Norges Bank, their central bank, in 1816. Their website states: “Norges Bank shall promote economic stability in Norway. Norges Bank has executive and advisory responsibilities in the area of monetary policy and is responsible for promoting robust and efficient payment systems and financial markets. Norges Bank manages Norway’s foreign exchange reserves and the Government Pension Fund Global”. We will mostly focus on two of these roles, namely the promotion of the financial market and the management of the Government Pension Fund (i.e., their Sovereign Wealth Fund).
The ancestor of Norway Stock Exchange, the Christiana* Exchange (Christiania Børs)
was set up three years after the Norges Bank in 1819. At that time, the economy was weak and money was rather scarce so the exchange was set up as a meeting place for investors to auction mostly share in ships and a bit of commodities and currencies. It is only in 1881, that the place started listing financial instruments (i.e., railway shares and 30-y bonds). At the end of 2013, the Annual Report of the Oslo Børs counted 218 companies listed on the exchange with a total market capitalization of NOK1968 bn (i.e., $325 bn). To allow cross-country comparisons, we used total market value of publicly traded shares per capita (using data from CIA†) as a proxy for a country financial market
development. According to this data, Norway ranked 12th most financially developed
country in the world, and 5th in Europe. Though far behind Luxembourg and
Switzerland, it is only slightly below Sweden and the UK. Moreover, the ratio is almost twice bigger than the one’s in Belgium, France, Ireland or Spain and more than 2.3x higher than the European Union. In a nutshell, Norway had the financial weapons to fight the curse.
* Christiana was the name of the capital at that time.
† Only data found that allowed for cross-country comparisons. The market value data is as of December
iii. Sovereign Wealth Fund
Another institution key to the development of Norway is their world famous sovereign wealth fund, supposedly* the largest in the world with NOK5206 billions (i.e., $858 bn or
almost 1.7x their GDP) worth of assets at the end of 2013.
In a report dated April 4 2014, addressed to and approved by the Sorting (i.e., the parliament), the Ministry of Finance detailed the management and the performance of the Government Pension Fund in 2013. The report starts with the idea behind the fund: “After Norway discovered oil in the North Sea in 1969, it soon became apparent that the values involved might be significant. It was also acknowledged that the revenues from the petroleum activities are not revenues in the ordinary sense, as these are partly offset by the extraction of a non-renewable resource. It was further acknowledged that the revenues would fluctuate significantly with the oil price.(…)”. These three sentences say it all. Not only they understood the size of the rent but also its dangerous volatile characteristic and its non-renewable component. However, in agreement with Auty (2003 – see Section 1.B): sustainability does not require the resource to be passed onto the next generation but rather the capacity to sustain the income stream. So there was (at least) one way to exploit this finite resource in a sustainable way, and the way chosen by the Norwegians was to set up a Sovereign Wealth Fund.
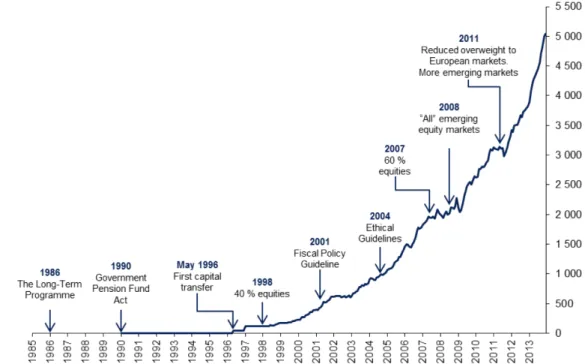
Figure 5 details the historical development and the growth in market value of their Government Pension Fund Global (GPFG), which with the Government Pension Fund Norway (GPFN – worth NOK168bn) forms the Government Pension Fund (i.e., their sovereign fund). Although the figure is quite exhaustive, it doesn’t show when the idea of a fund was first launched. And because Matthew (22) wrote: “Reddite ergo, quae sunt
Caesaris, Caesari et, quae sunt Dei, Deo*”; we must mention that it is in 1983 that the
so-called Tempo Committee launched a proposal of a fund to smoothen the spending of petroleum revenues. In 1986, the establishment of a fund was part of the government “Long-Term Programme”. Four years later, the fund act was passed. Nevertheless, it remained an accounting tool for six more years, barely keeping track of the amount return to cover the non-oil deficit. Finally, in May 1996 the first net allocation was made to the fund.
Now that we understand why and how the fund was set up; we will discuss how it currently works and under which principles. The GPFG and the GPFN have no governing bodies of their own; they are managed by the Norges Bank and the Folketrygdfondet, respectively – both under mandates set by the Ministry of Finance. As
* "Therefore give back those things that are Caesar's to Caesar and those things that are God's to God." Figure 5: Historical Development of the Government Pension Fund Gobal (NOK bn)
the GPFG represents most (i.e., 97%) of the GPF, it will be the focus of our analysis. The system is pretty straightforward: government revenues from the petroleum activities are transferred to the GPFG, which re-invest it with the purpose of financing pension expenditure and support long-term considerations spending. The objective is to maximize the international purchasing power of the capital over time, given a moderate level of risk. This risk is mainly defined by the asset allocation:
! A fixed* 60% in equity following an unknown benchmark index comprising 46
countries (o/w 22 are defined as emerging markets by the index provider FTSE) ! Not less than 35% fixed income following an unknown benchmark index
comprising 21 currencies (o/w 10 are from emerging markets) ! No more than 5% in real estate
The benchmark adopted by the Ministry implies that the composition of investments in equities and corporate bonds adheres to the principle of market weights, whilst the composition of investments in government bonds is based on the sizes of countries’ economies, as measured by gross domestic product (GDP weights).
All in all, we understand this is mostly a quasi-passive strategy (i.e., benchmark tracking) with a very long-time horizon. In theory, the financial target of the fund is to realize a 4 % real rate of return in the long run. This 4% target coincides with the upper limit of the allowed petroleum transfers (see below). In practice we can say their results are in line with their expectations, the fund has achieved a net† average annual return between
January 1997 and December 2013 just below 3.9%. However, due to the large portion of equity the fund has a quite volatile performance (e.g., in 2013 the return on GPFG was 15.9% driven by a global stock price increase in developed markets). Although these financial results are of interest, what principally matters to us is the contribution the fund makes to the Norwegian economy. With other words, the amount transferred from the GPF to the government. In the fiscal budget for 2014, this amount is estimated to be NOK139 bn (i.e., $24 bn), which reflects a substantial 4.5% of their GDP; but seems‡
still below the upper 4% limit. Given its (growing) size and active contribution to the Norway’s economy, it could hardly be argued that this fund is not and will not be capable of sustaining the (oil and gas) income stream for the future generation.
* If it deviates from 60% by more than 4% at the end of a month, it has to be rebalanced. † Net of inflation and management fees.
‡ We cannot provide an accurate number as the government revenue from the petroleum activity (an