HAL Id: hal-01270452
https://hal.archives-ouvertes.fr/hal-01270452v2
Submitted on 3 May 2016HAL is a multi-disciplinary open access archive for the deposit and dissemination of sci-entific research documents, whether they are pub-lished or not. The documents may come from teaching and research institutions in France or abroad, or from public or private research centers.
L’archive ouverte pluridisciplinaire HAL, est destinée au dépôt et à la diffusion de documents scientifiques de niveau recherche, publiés ou non, émanant des établissements d’enseignement et de recherche français ou étrangers, des laboratoires publics ou privés.
Effects of biodeterioration on the mechanical properties
of concrete
Jorge Fernando Marquez-Peñaranda, Mauricio Sanchez-Silva, Johana Husserl,
Emilio Bastidas-Arteaga
To cite this version:
Jorge Fernando Marquez-Peñaranda, Mauricio Sanchez-Silva, Johana Husserl, Emilio Bastidas-Arteaga. Effects of biodeterioration on the mechanical properties of concrete. Materials and Struc-tures, Springer Verlag, 2015, In press, �10.1617/s11527-015-0774-4�. �hal-01270452v2�
1
Please cite this paper as: Marquez-Peñaranda JF, Sanchez-Silva M, Husserl J, Bastidas-Arteaga E (2016). Effects of
biodeterioration on the mechanical properties of concrete. Materials and Structures. In press. http://doi.org/10.1617/s11527-015-0774-4
Effects of biodeterioration on the mechanical properties of concrete
J. F. Marquez-Peñarandaa,b, M. Sanchez-Silvaa*, J. Husserla and E. Bastidas-Arteagab.
a Department of Civil and Environmental Engineering, Universidad de Los Andes, Carrera 1 Este No. 19A-40, Edificio Mario
Laserna, Piso 6, Bogotá, Colombia
b LUNAM Université, Université de Nantes-Ecole Centrale Nantes, GeM, Institute for Research in Civil and Mechanical
Engineering/Sea and Littoral Research Institute, CNRS UMR 6183/FR 3473, 2, rue de la Houssinière BP 99208, 44322 Nantes Cedex 3, France.
ABSTRACT
Concrete biodeterioration in sewers and structures subjected to environments rich in hydrogen sulfide has been related to the activity of sulfur oxidizing bacteria (SOB). In previous studies, the effect of the activity of SOB on concrete structures has been linked mainly to weight loss. In our work we have investigated, in addition to the weight loss, the variations in porosity and compressive strength. The main objective of this paper is to explore, under controlled conditions, the effect of biodegradation of non-submerged samples, on both the physical properties and the mechanical performance. Towards this aim, cement mortar samples inoculated with pure cultures of A. thiooxidans, H. neapolitanus, and a consortium containing both strains, were exposed to an H2S-rich environment. Changes in physical properties, including weight and porosity,
and compressive strength were measured over 300 days. The results showed that the greatest reduction of weight and compressive strength was observed in samples inoculated with the consortium (7% and 52%, respectively); while the largest variation in porosity was observed in samples inoculated with A. thiooxidans (27%). These results were used to obtain relationships between the amount of sulfur available over time with specific physical and mechanical properties; i.e., compressive strength, porosity, weight loss, and physical appearance.
Keywords:
Concrete, biodeterioration, porosity, compressive strength, weight loss, sulfur-oxidizing bacteria
1 INTRODUCTION
The life-cycle analysis of infrastructure systems requires understanding concrete performance over time, which depends highly on the characterization of material degradation [1,2]
.
Although phenomena such as aging, fatigue, and corrosion are known to be important agents for concrete degradation, it has been noted that, in aggressive environments, the action of living organisms may also have a significant impact on its performance. These problems have been reported in, for example, oil pipelines [3], underground structures, sewage systems [4], and offshore structures [5,6]. Biodeterioration affects mainly concrete durability increasing maintenance costs [7,8], and reducing the capacity of structural members in the long term.Biodeterioration is usually overlooked in most structural analyses because its kinematics is very slow and therefore it remains undetected or neglected during the structural lifetime. Furthermore, although biodeterioration itself is rarely a direct cause of failure, it may play an important role in reinforced concrete degradation by accelerating other damaging processes such as chloride ingress (e.g., in marine environments or in structures subjected to
deicing salt)
and carbonation. These processes lead to corrosion propagation* Corresponding author: M. Sánchez-Silva. Address: Carrera 1 Este No. 19A-40, Edificio Mario Laserna, Piso 6,
2
and loss of structural capacity [9,10]. In some cases, biogenic attack can also cause severe direct
structural damage since acid attack dissolves the C-S-H structure and destroys concrete so that it is
no longer load-bearing.
Among other phenomena capable of deteriorating concrete structures, biodeterioration generally affects the concrete matrix by increasing porosity, reducing strength and the cross-section area of components, and promoting crack growth [11].In particular, it is well known that microbially induced degradation is a main concern in sewage collection systems. In these systems, due to anoxic conditions commonly found in sewage, sulfate in wastewater is used as an electron acceptor producing sulfides. Then, at low pH, hydrogen sulfide gas volatilizes and rises to the tops of sewer pipes where aerobic microbial communities grow in biofilms [12,13]. Sulfur oxidizing bacteria (SOB) living in these biofilms use hydrogen sulfide or reduced-sulfur compounds as electron donors and oxygen from air as an electron acceptor, producing sulfate or sulfuric acid. The main consequence of sulfuric acid attack is the modification of the C-S-H structure of concrete that results from the reaction of sulfate ions with the cement hydration products. This process results in the formation of gypsum and ettringite, leading to the destruction of the hydration products that constitute the binder of concrete. The formation of ettringite may lead to increased tensile stress within the concrete matrix, resulting in cracking [11,13,14].
Many bacteria are capable of oxidizing sulfur yet only a handful of species are commonly found on corroded concrete surfaces in sewers. The microbial autotrophic species capable of inorganic sulfur oxidation Acidithiobacillus thiooxidans, Halothiobacillus neapolitanus, Starkeya novella, and Thiomonas intermedia have been widely associated with concrete biodeterioration. The most aggressive strains with respect to biodeterioration are all members of the phylum proteobacteria [17,18]. SOBs are all capable of growing on reduced sulfur compounds as electron donors. Substrates used by these species include hydrogen sulfide or metal sulfides such as pyrite, sulfur, polysulfides, sulfite, and thiosulfate [19].
The ecology of the sulfur oxidizing microbial communities is highly dependent on the pH of the concrete matrix [20,21]. After casting, the pH of concrete is higher than 12 (usually in the order of 13.5), which inhibits sulfur-oxidizing bacteria development. In sewer pipes, however, exposure to hydrogen sulfide reduces concrete pH to a point at which neutrophilic sulfur oxidizing bacteria can grow and produce sulfuric acid, which also lowers the pH even further to a point at which acidophiles thrive. Sulfur-oxidizing bacteria start to accumulate once the pH reaches about 8. The optimum pH for growth of H. neapolitanus and A. thiooxidans, two of the most aggressive strains commonly found in sewer pipes, are between 5.02–8.41 and 0.1–5.86, respectively [1]. As a result, H. neapolitanus can be found on concrete at the beginning of the colonization when the pH is still high. But acid production by this and other organisms can lower pH to values at which the most acidophilic species, A. thiooxidans, thrive.
Several studies have focused on weight loss as an indicator of biodeterioration activity [1,21–24]. They report a wide range of weight loss observations (even for similar environmental conditions) ranging from negligible weight loss after 126 days of exposure [22] to total weight loss (100%) after 350 days [23]. The heterogeneity of the cementitious mortars and concrete, the variability of the environmental conditions, and the interactions and dynamics of the microorganisms involved in sulfur oxidation are only some of the aspects adding complexity to the description and quantification of the biodeterioration process [11].
In addition to weight loss, biodeterioration could also affect other physical and mechanical properties of concrete. Frequently, during the process, a layer of high porosity is produced by biogenic attack. This high porosity layer leads to greater permeability and diffusion within the inner matrix of the material [11,25]. On the other hand, compressive strength decreases for larger porosities in concrete and mortar specimens [26– 28]. Consequently, the compressive strength of concrete components is affected by biodeterioration and must therefore be modeled as a time-variant property throughout the structural lifetime [29]. Although porosity
3
and strength variations due to biodeterioration are paramount for structure condition assessment, to the authors´ knowledge, nowadays there are no studies that include these parameters.Within this context, the main objectives of this study are:
• to evaluate biodeterioration effects on weight loss, porosity and compressive strength under a controlled environment; and
• to analyze the relationships between these three properties and the environmental conditions.
The novel contribution of this study is the assessment of the effect of biodegradation on the physical properties (porosity and weight) and the mechanical performance (i.e., compressive strength) of concrete. Results from this study would contribute to a better description of concrete biogenic corrosion processes, and consequently, to provide specific quantitative information on concrete biodeterioration effects. This information is needed to improve the assessment of concrete durability.
2 MATERIALS AND METHODS
In our work we exposed mortar samples (inoculated with pure strains and non-inoculated) to H2S-rich
environments and measured their physical and mechanical changes during 300 days. In the next subsections a description of physical, biological, and chemical conditioning of samples is presented. Also, the scope and limitations of the observations are stated.
Mortar sample preparation 2.1
Portland cement mortar 13 mm x 13 mm x 10 mm samples with water-to-cement ratio w/c=0.485 were cast in a plastic mold without release agent. The casting was made by compacting two successive layers with a plastic rammer after 30 seconds of vibration with a pneumatic-motor-table. ASTM C778-06 standard graded natural river sand and Portland cement type I were used to prepare the samples. Cement paste-sand mix was blended using a five-pound mixer (Hamilton Beach Commercial) with a cement-to-sand ratio of 1:2.75. Casting molds containing fresh samples were wrapped with stretch film and stored in an airtight container at 20°C for 24 hours.
Demolded samples were kept in a closed container for curing during 30 days. The relative humidity (RH) measured (daily) within the container was on average 90%. After curing, samples were exposed to ambient air; in this paper, this condition will be referred to as “ordinary atmospheric” conditions. Cured samples were subjected to “ordinary atmospheric” conditions for 60 days at 20±2°C and 60±10% RH. RH and temperature measurements were taken using a digital thermo-hygrometer Thermo®. The “ordinary atmospheric” conditions simulate the time period from when the concrete is cured until it is put to service. Oven-drying (100oC) was carried out prior to the weighing process and sterilization.
To lower the surface alkalinity of the mortar samples, they were submerged in distilled water enriched with commercial carbon dioxide. During 14 days, CO2 gas was bubbled into the water of each airtight container,
on daily basis for 60 s, until the CO2 partial pressure in the headspace reached 0.22 atm. In this paper this
process is referred to as “carbonation”. Surface pH of all samples was reduced from around 12 to less than 9 (verified with the phenolphthalein test) [30,31]; it should be mentioned that the depth of carbonation was not measured. After carbonation, five groups composed of 76 samples each, were oven dried at 110°C for 24 hours. Oven-dried samples were kept at room temperature for ten minutes and then weighed. These data were recorded as initial dry weight (t=0). Once all the samples were weighed, they were wrapped in aluminum foil and oven dried 110°C for 24 hours for sterilization purposes. Sterilized samples were allowed to cool down at room temperature, still wrapped in aluminum foil.
4
Inoculum, growth conditions, and verification of microbial purity2.2
Hallothiobacillus neapolitanus NCIMB 8454 and ASOM Acidithiobacillus thiooxidans NCIMB 9112 (ATCC8085) were purchased from American Type Culture Collection – (ATCC) (Virginia, USA). Pure cultures were grown in DSMZ (Deutsche Sammlung von Mikroorganismen und Zellkulturen) 68 Thiobacillus neapolitanus agar/liquid medium or DSMZ 35 Thiobacillus thiooxidans agar/liquid medium, as recommended by supplier. Prior to inoculating mortar samples, bacterial cells were grown in liquid media to an optical density (OD) 600 of 1.0. Cultures were centrifuged (4°C, 13000 rpm, 15 min) to separate cells from growth medium and were triple washed with mineral medium containing no source of sulfur. Washed cells suspended in mineral medium (without sulfur) were used to inoculate mortar samples. Oven-dried mortar samples were soaked in cell suspensions of A. thiooxidans, H. neapolitanus, or a consortium of both. Before inoculation and throughout the experiment, the purity and presence of cultures was verified morphologically after growth in Luria Bertani (LB) agar. No changes were observed in bacterial morphology of cultured plates from samples collected at different ages.
Experimental setup 2.3
No bacterial growth was observed when sterilized control mortar samples were “stamped” on LB agar. One group of 76 samples was inoculated with H. neapolitanus (H.n.), a second group was inoculated with A. thiooxidans (A.t.), and the third group was inoculated with a consortium (Cons.) composed by both strains. The fourth group was composed of abiotic samples exposed to the same environment as the biotic samples (i.e. H2S+CO2). The remaining group was used as control in which abiotic samples were exposed to a sterile
environment at the same temperature (30±1°C) and relative humidity (62%±5%) of the other four groups (Table 1). In all cases, a humid and warm environment inside the plastic boxes kept RH values within the mentioned ranges. For simplicity abiotic control exposed to hydrogen sulfide (fourth group) will be referred to solely as H2S.
All groups of samples were placed in individual 5 cm x 18 cm x 18 cm airtight plastic containers (Figure 1). During the first 150 days of the experiment, sulfide was supplied to each container every 3 days at a H2S
concentration of about 100 ppmv, which is consistent with values typically found in sewer systems [41]. During the last 150 days, feeding was conducted on a daily basis, reaching the same concentration of hydrogen sulfide. CO2 in the headspace of the containers was maintained at 0.3±0.1%. In order to achieve
the required concentrations of H2S and CO2 in the surrounding air, distilled water, HCl, Na2S•9H2O and
NaHCO3 were mixed and placed in the bottom of each container. The device used for the exposure of the
samples in each test had an 8-mm height liquid layer, a plastic bearing structure and a plastic net over which samples were placed; mortar samples were located 25 mm above the water surface. Mixing of distilled water, sodium sulfide, sodium bicarbonate and hydrochloric acid was achieved by means of slight movements of three small crystal balls after closing the container. Container seals were tested by measuring outside H2S
concentration within a sealed 30 cm x 40 cm x 60 cm incubator after four hours of gas accumulation. Portable Gas Analyzer BioGas CDM (LANDTEC ®) and Portable Gas Analyzer RKI GX2009 (RKI Instruments ®) were used to measure H2S, CO2 and O2 levels. Containers showed no leaks at the beginning
of the experiment; however, at the end of the experiment concentrations as high as 1 ppmv of H2S were
observed outside the recipient after four hours of accumulation.
A central element of the study is the variation of H2S concentration over time (Figure 2). Addition of
hydrogen sulfide and carbon dioxide resulted in the production of the gases in the gas phase that rapidly decreased over time. H2S decrease (at a rate of 12±4 ppmv/h) was about constant throughout the experiment.
5
underneath the mortar samples. The rapid decrease of hydrogen sulfide concentration in the headspace suggests that there is a high sorption capacity by the concrete samples. It is likely that at low H2Sconcentration in headspace, biogenic effects became more important than chemical sorption [32]. Figure 3 shows the sulfur availability Sa(t) as a function of time. The sulfur availability refers to the accumulated amount of sulfur applied (mg) with respect to the exposed area (cm2) of the samples at each age. The exposed-area-to-weight ratio of mortar samples was of 2.91±0.01 cm2/g.
Assessment of biodeterioration effects on physical and mechanical properties 2.4
Compressive strength, weight loss and porosity of samples were measured over 300 days of exposure to bacterial attack. These measurements were made after 0, 60, 120, 195, 240 and 300 days of exposure. Additional measurements for weight loss and compressive strength were taken at days 30, 90, 150 and 270. Samples were extracted from containers following a uniform-random selection sampling method. Once extracted, moist samples were weighed and later oven dried (110°C for 24 hours). The weighting process before and after the treatment was carried out after drying the samples at 110°C. Therefore, if some water were absorbed during the inoculation process, it would have been removed during oven-drying. The dry weight of the samples was measured using a precision scale (Ohaus Adventurer Pro Analítica AV264). To ensure correct weight measurements, prior to oven drying and weighing, extracted samples were subjected to a passive wash in which they were submerged in distilled water for one hour and shaken for 30 seconds every 20 minutes before being placed into the oven. Nine weight measurements were taken and averaged for each sample.
Porosity measurements, in triplicate, were taken using mercury intrusion data from an AutoPore IV 9500 porosimeter (Micromertics Instrument Corporation). Pores in solids can be classified according to their size as micropores, mesopores or macropores. In general it is accepted that adsorbed water can be found in micropores, condensed water in mesopores and bulk water in macropores [33]. In this study we used a standard classification of pore sizes, with micropores within the range between between 0 and 10 nm, mesopores between 10 and 5000 nm, and macropores larger than 5000 nm [28].
Compressive strength was measured also in triplicate using a 500 kg load cell hydraulic press (ELE International Digital Tritest). Records of load versus deformation at a deformation speed of 0.10 mm/min were obtained for samples at each stage of the experiment. A pre-load equivalent to 1.0–1.5 MPa was applied five minutes prior to the start of the test to ensure uniform pressure on the upper and lower surfaces of each sample. Upper and lower surfaces were leveled prior to testing using rubber pieces. Slow load rate and rubber pieces avoided any distortion that might have been caused by the deteriorated superficial layers. Compressive strength values were scaled so that results were comparable to the results of standard 5-cm-side-cube compressive load tests [34].
Data evaluation and analysis
2.5The experiment started at the time at which the concrete reached a pH where biodeterioration can occur [35,36]; i.e., pH of 8. Once the experiment started, all biodeterioration effects (weight, porosity and strength changes), were normalized with respect to the sulfur added to the system; i.e., Sa(t); i.e., accumulated sulfur availability (s 3). Based on the experiment set-up and the actual measurements, the amount of sulfur added to the system at a given point in time can be computed as:
6
t
e t
Sa()=0.0016 0.0146 (1)
where Sa(t) is expressed in mg of elemental sulfur per cm2 of exposed surface of mortar existing at time t (days) (Figure 3); this fitting had a R2 = 0.9879. Note that Sa(t) takes into account the reduction of exposed surface due to the progressive removal of samples from each container since the total surface available for reaction with sulfide decreased. On the other hand, the amount of H2S in contact with the surface of the
samples could not be determined in an exact manner. Instead this study considered Sa(t) as the total available amount of H2S in the head space in contact with the samples’ surfaces. For control samples, biodeterioration
effects are expressed as a function of time only.
The effect of biodeterioration on the samples’ weight can be observed in Figures 4 and 5; the changes in porosity in Figures 6 and 7; and the impact on compressive strength in Figure 8. These figures also include an additional axis with the time elapsed when the measurements were taken. A process of data fitting was carried out for every case; Figures 5, 7 and 8 show the results and the corresponding 95% confidence intervals. Within the fitting process, three possibilities were evaluated: linear, second-degree polynomial, and logarithmic regression models. All regression parameters were obtained by minimizing the mean square error (analysis of residuals). It is interesting to note that, in all cases, the best fit for the change in weight, strength and porosity has a logarithmic form; i.e., y = a ln(Sa(t)) – b. The values of the parameters a and b for every property measured are shown in table 3. The fitting equations obtained for every case are presented in Table 3. Although these curves are specific for the results obtained in this experiment, the results provide valuable information as to the trend of the process.
3 RESULTS AND DISCUSSION
During the experiment, we were not able to determine whether the changes affecting porosity and strength were uniformly distributed throughout the samples; however, our observations led us to conclude that the effects were concentrated mostly on the degraded surface layer. Degradation depths were not measured nor deteriorated layers removed before testing. Therefore reported changes must be interpreted as average changes over the whole specimen volume (including deteriorated and not deteriorated zones).
In the following subsections, we shortly describe observed physical changes of the samples and we focus on measured changes in weight, porosity, and strength produced by biodeterioration.
Qualitative assessment 3.1
Qualitative observations related to color and texture changes were recorded at each sampling time. Samples showed stains of different colors during the experiment: gray, green, bronze, and white shades appeared successively upon samples surfaces during the experiment. White crystals (which are believed to be ettringite crystals that could dissolve as pH drops) [11] were visible after 90 days of exposure in biotic samples. Such crystals were observed only after 210 days in samples subjected to only chemical exposure.
Weight variation 3.2
For each sample, weight variation at age t was computed as:
Δw(t) =w(t)− wi
7
where Δw(t) is the weight variation (%), w(t) is the dry weight (mg) measured at time t andw
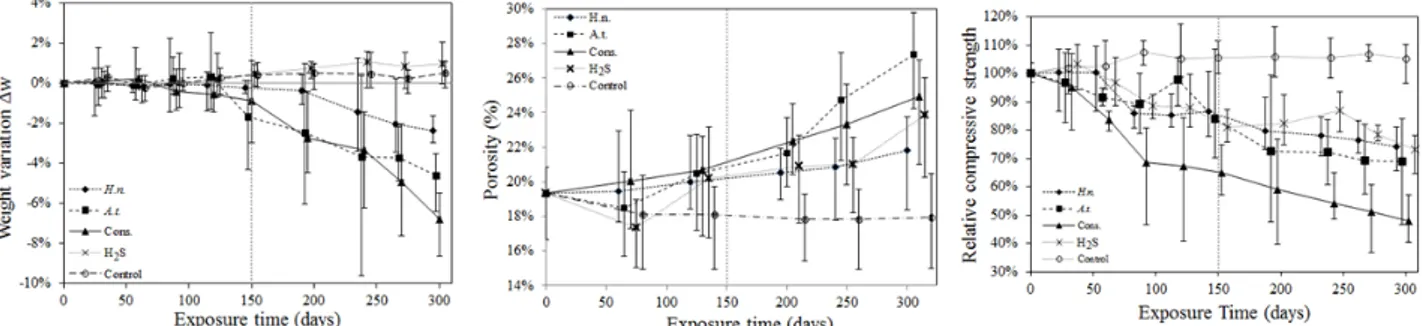
i is the initial dry weight (mg) measured at time t = 0. It can be observed in figures 4 and 5 that at the end of the experiment (i.e., Sa(t) ≈ 0.12 mg/cm2), samples inoculated with the consortium showed a total weight loss of6.8±1.4%. Samples inoculated separately with A. thiooxidans and H. neapolitanus lost 4.6±1.4% and 2.4±0.5% of their initial weight, respectively. In contrast, weight gains of 1.0±0.8% and 0.5±0.6% were observed in abiotic samples exposed to H2S and control samples, respectively. The weight gain in the abiotic
samples exposed to hydrogen sulfide resulted from the accumulation of precipitated sulfur. The small weight variation in the control samples is within the expected error of the experimental measurement technique. Figures 4 and 5 include all measurements as function of the exposure time. The largest data variability was observed in samples inoculated with Acidithiobacillus thiooxidans.
Overall results indicate greater weight loss after feeding frequency was changed from once every three days to every day (day 150 or Sa(t) ≈ 0.016 mg/cm2 in Figure 2, 4 and 5). Larger weight changes started after
Sa(t) ≈ 0.011 mg/cm2 (120 days) in all biotic samples. Lower weight losses during the first three months of
the experiment resulted from the time required for superficial conditioning (pH drop, biofilm formation, roughness adaptation) and bacterial lag phase. After this span, the acidophilic bacteria (pure and within the consortium) seemed to be capable of growing faster and acidifying the concrete surface leading to greater weight loss. The effect of the neutrophilic bacteria on the weight of the samples was less pronounced. The lower effects of H. neapolitanus than A. thiooxidans on the weight of the samples could be a result of differences in growth rates, selectivity of the reduced sulfur metabolites available, accumulation of toxic byproducts, and other metabolic differences in general.
Negligible weight variation (losses from 0.1 to 0.5%) was observed before Sa(t) reached 0.006 mg/cm2. This
value corresponds to the accumulated sulfur applied during the first 90 days of exposure. It is also noted that the mean weight change follows a logarithmic trend after this time period. Table 3 summarizes the best fit equations for the weight variation once Sa(t) ≥ 0.006 mg/cm2.
In the case of biotic samples, it can be observed that the dispersion increases with the exposure time (see Figure 5). The largest standard deviation was observed in samples inoculated solely with A. thiooxidans and with the consortium. Standard deviation for control samples and those exposed to H2S was constant during
the exposure time. Standard deviation of control samples can be associated to uncertainties related to the variability in the material physico-chemical properties and the accuracy of the testing procedure. Standard deviation of abiotic samples exposed to H2S can be related to uncertainties coming from the chemical
exposure. By comparing uncertainties at the end of the exposure, it can be observed that biodeterioration increases the initial uncertainties (intrinsic, test, and H2S exposure) by about two to threefold. Table 3
provides the adjusted expressions for the standard deviation σW(Sa(t)) for all experimental conditions and Figure 5 shows the data for weight change.
Porosity variation 3.3
Total porosity of any material can be computed as the sum of isolated pores volume existing inside the solid structures plus open (connected) pores volume existing amid those solid structures [37]. In this work, only open porosity was measured and for simplicity it is called “porosity”.
Mercury Intrusion Porosimetry (MIP) expressed in ml/g was used to compute the pores’ volume existing inside the entire sample. At the end of the experiment (300 days) TMI measurements were carried out for control samples, abiotic samples exposed to H2S, and samples inoculated with H. neapolitanus, A.
thiooxidans, and the consortium (Figure 6). The results for these five cases are: 0.087 ml/g, 0.128 ml/g, 0.114 ml/g, 0.151 ml/g, and 0.133 ml/g respectively. The lower porosity variation in samples inoculated with
8
H. neapolitanus is consistent with their small weight losses. The largest porosity increase was observed for pores between 0.05 nm and 10 mm in samples inoculated with A. thiooxidans. Interestingly, these show a pore volume increase for pore sizes around 1 um (1000 nm), which is the average length of the A. thiooxidans bacillus. Samples inoculated with the consortium and abiotic samples exposed to H2S showed anincrease in pores between 5000 and 10000 nm suggesting the formation of new capillary connections. Porosity variation at time t (i.e., Δφ(t)) was measured in percentage for each sample as:
Δφ(t) = φ(t)−φi (3)
where φ(t) is the porosity (%) measured in each sample at time t and φi is the initial porosity (%) measured in the control sample at time t=0.
Average porosity (in volume) and its distribution were determined from three measurements, for every type of sample. The measured average initial porosity of all samples was 19%, with a coefficient of variation COV=0.12, computed using six samples randomly chosen from the population of available samples. After 300 days, the porosity of biotic samples increased significantly. Final porosities went up to 27%, 25% and 22% in samples inoculated with A. thiooxidans, the consortium and H. neapolitanus respectively (Figures 4 and 7). Porosity in control samples went down to 18% and in abiotic samples increased up to 24%. Error bars were drawn using minimum and maximum values from 3 measurements at each exposure time.
The volume of micropores (0–10 nm) showed a visible change only for samples inoculated with the consortium (Table 2). This fact suggests that biodeterioration produced by the consortium was able to affect the concrete microstructure; i.e., small pores, which are usually called gel pores. The volume of mesopores increased from 13.4% to 21.7% and from 3.2% to 8.3% in samples inoculated with A. thiooxidans and the consortium respectively. According to this, A. thiooxidans could be the responsible for the largest variations in mesopores while the consortium for those related to macropores. It is well known that as porosity increases, compressive strength decreases [26,28]. This fact could explain the greater strength drop observed in samples inoculated with bacteria. Also changes in macropores and mesopores could be related to changes in pores connectivity affecting the permeability and durability of the material.
The porosity increase was estimated as 7%, 6% and 4% for samples inoculated with A. thiooxidans, the consortium, and those abiotic samples exposed to H2S, respectively. Furthermore, in the control samples, the
porosity was reduced by 2%; while in the samples inoculated with H. neapolitanus an increase of 2% was observed. It can be observed in Figure 7 that the porosity changes depend on the sulfur availability. Thus, a rapid increase in porosity is observed for all samples exposed to sulfur availability values Sa(t) between 0.006 and 0.030 mg/cm2. Negligible porosity variation (0.1 to 0.7%) is associated to Sa(t) ≤ 0.006 mg/cm2. This limit corresponds to the accumulated sulfur applied during the first 90 days of exposure.
Compressive strength variation 3.4
For simplicity, the compressive strength is referred solely as “strength” in the next sections. In the compressive tests carried out, the deteriorated sample layers were not removed prior to conducting the strength test. The visual results of the tests show that typical compressive breaking of all samples resulted in the formation of cracks parallel to load axis revealing a uniform loading-application.
The average initial strength for non-carbonated and carbonated 90-day-old samples was 30 MPa (COV=0.03) and 33 MPa (COV=0.02) respectively. Abiotic carbonated samples (control) were used as the
9
reference state to compute the relative strength (Figure 4 and 8). Strength variation at time t was computed for each sample as:
Δs(t) =s(t)−si
si *100 (4)
where Δs(t) is the strength variation in percentage, s(t) is the strength (MPa) measured in each exposed sample at time t, and siis the initial strength (MPa) measured in the control sample at time t = 0. After 300 days of exposure, samples inoculated with H. neapolitanus, A. thiooxidans and abiotic samples subjected to H2S showed a strength loss equivalent approximately to 28% of their initial value. Control samples did not
show important strength variations while samples inoculated with the consortium lost more than a half (52%) of their initial strength (Figure 4 and 8). Interestingly, for these samples, the most important strength loss was observed during the period between 60 and 90 days. These results confirm that the interaction among the microorganisms in consortium is a predominant factor for biodeterioration. By comparing strengths of samples inoculated with pure strains and those abiotic samples exposed to chemical attack, it is observed that most of the strength loss is caused by the chemical effect of hydrogen sulfide over the mortar samples, and that biogenic deterioration from pure strains contributes only slightly to relative strength changes. Error bars were drawn using minimum and maximum values from three samples per exposure time. The largest data variability at each age was observed in samples inoculated with Acidithiobacillus thiooxidans.
Negligible strength variations (0.5 to 5%) were observed below Sa(t) ≤ 0.006 mg/cm2. This limit corresponds
to the accumulated sulfur applied during the first 90 days of exposure. In general, the strength losses caused by the activity of the consortium doubled those produced by other conditions under the same sulfur availability. The larger influence of acidophilic bacteria (pure or within a consortium) in the strength variation was evident. Figure 8 compares the proposed relationships and measured data for porosity changes. As it was expected, most of experimental results are within the 95% confidence interval.
Relationships between weight, strength and porosity
3.53.5.1 Relationship between strength – weight variations
While Figure 5 shows negligible weight losses during the first three months, Figure 8 indicates an important loss of strength during the same period of time; however, it becomes less pronounced during the remaining months of the experiment. This fact seems to indicate that the main effects of biogenic activity result in larger weight losses and smaller strength variations. A rapid weight loss after the initial few months is linked to overcoming the bacterial lag phase while the bacterial growth results in a buffering effect on strength decrease. Apparently, there is a positive effect on compressive strength resulting from clogging and deposition of biodeterioration byproducts within the inner mortar matrix.
The right side of Figure 9 shows the relationship between strength and weight losses. There was an initial rapid strength loss (13 to 35%) for low weight losses (less than 2%) followed by a slower strength loss (35 to 52%) for larger weight losses (2 to 7%). These findings indicate that the most important strength reduction could occur even when weight or thickness losses are not apparent yet.
10
The relationship between strength and porosity for cement pastes, mortars, and concretes in samples that have not been exposed to biodeterioration have been widely discussed [27,28,38–40]. In general, strength decreases when porosity increases. Since the initial porosity is statistically identical for all samples, the effect of changes in porosity on the strength reported inhere can be attributed to a large extent to bacterial attack; see Figures 9 and 10. These results suggest that concrete microstructure changes due to biodeterioration depending upon the type of bacteria involved in the process. The relationship between porosity and strength is shown in Figure 10. A rapid strength loss (up to 22%) was related to a small porosity gain (less than 1%). In contrast, a slower strength loss (22 to 52%) was associated to a larger porosity gain (1 to 8%).4 CONCLUSIONS
This paper presents the results of an experiment aimed at evaluating the biodegradation of cement mortar samples. In particular the study focused on changes in physical properties, including weight and porosity, and compressive strength. In the experiment, a set of 13x13x10mm mortar samples were inoculated with pure cultures of A. thiooxidans, H. neapolitanus, and a consortium containing both strains and exposed to an H2S-rich environment. Qualitative assessments of the appearance and quantitative evaluations of the physical
and mechanical properties were carried out over a period of 300 days. During the time window of the experiment, all environmental conditions were carefully controlled and permanently monitored.
Both, porosity and strength measurements, were undertaken in the original samples (i.e., as cast), ensuring more realistic results; this is an improvement over other studies in which samples were cut and/or brushed prior testing. The results of the experiment showed that samples inoculated with the consortium showed the largest signs of biodeterioration with larger weight loss (7%), important porosity changes (6%) and lower final strength (about 52% of their initial strength). Pure acidophilic bacteria were able to produce a high biodeterioration mainly depicted by weight loss (5%) and porosity increase (7%). Conversely, samples inoculated with pure neutrophilic bacteria had a similar behavior to the abiotic samples subjected to H2S.
The results of this study show greater relative biodeterioration (with respect to the amount of sulfur provided) than previous studies in which samples were partially submerged. This effect is explained by the fact that our samples had a high exposed-surface-to-mass-ratio. Furthermore, the results suggest that the ecology of the system influences the biodeterioration effects in an important manner. The analysis of the data was normalized with respect to sulfur availability. Interestingly, the results show that for Sa(t) (sulfur availability) values lower than 0.006 mg/cm2, all the biodeterioration effects can be neglected for practical
applications.
Acknowledgements
The authors want to acknowledge the financial support of the Universidad Francisco de Paula Santander (Cúcuta, Colombia) and the support of the Coselmar project (Compréhension des Socio-Ecosystèmes Littoraux et Marins pour l’Amélioration de la Valorisation des Ressources Marines, la Prévention et la Gestion des Risques- http://www.coselmar.fr); throught the University of Nantes, France.
REFERENCES
[1] Bielefeldt A, Gutierrez-Padilla MGD, Ovtchinnikov S, Silverstein J, Hernandez M. Bacterial Kinetics of Sulfur Oxidizing Bacteria and Their Biodeterioration Rates of Concrete Sewer Pipe Samples. J. Environ. Eng. 2010;136:731–738.
11
[2] Wei S, Jiang Z, Liu H, Zhou D, Sanchez-silva M. Microbiologically induced deterioration of concrete- A Review. 2013;1007:1001–1007.
[3] Videla HA. Manual of Biocorrosion. CRC Press, 1996.
[4] Cho K, Mori T. A newly isolated fungus participates in the corrosion of concrete sewer pipes. Water Sci. Technol. 1995;31:263–271.
[5] Melchers RE, Jeffrey RJ. Probabilistic models for steel corrosion loss and pitting of marine infrastructure. Reliab. Eng. Syst. Saf. 2008;93:423–432.
[6] Melchers RE. The effect of corrosion on the structural reliability of steel offshore structures. Corros. Sci. 2005;47:2391–2410.
[7] Kumar R, Gardoni P, Sanchez-Silva M. Effect of cumulative seismic damage and corrosion on the life-cycle cost of reinforced concrete bridges. Earthq. Eng. Struct. Dyn. 2009;38:887–905.
[8] Sanchez-Silva M, Klutke G-A, Rosowsky D V. Life-cycle performance of structures subject to multiple deterioration mechanisms. Struct. Saf. 2011;33:206–217.
[9] Bastidas-Arteaga E, Sánchez-Silva M, Chateauneuf A. Structural reliability of RC structures subject to biodeterioration, corrosion and concrete cracking, in: J. Kanda, T. Takada, H. Furuta (Eds.), 10th Int. Conf. Appl. Stat. Probab. Civ. Eng., Tokyo:Japan: 2007: pp. 183–190.
[10] Bastidas-Arteaga E, Sánchez-Silva M, Chateauneuf A, Ribas Silva M. Coupled reliability model of biodeterioration, chloride ingress and cracking for reinforced concrete structures. Struct. Saf. 2008;30:110–129.
[11] Alexander M, Bertron A, Belie N De. Performance of Cement-based Materials in Aggressive Aqueous Environments. State of the Art Report, RILEM TC 211-PAE (Springer) 2012. [12] Sawyer CN, McCarty PL, Parkin GF. Chemistry for Environmental Enginnering and Science.
McGraw Hill, 2003.
[13] Dopson M, Johnson DB. Biodiversity, metabolism and applications of acidophilic sulfur-metabolizing microorganisms. Environ. Microbiol. 2012;14:2620–31.
[14] Madigan M, Martinko JM, Parker J. Brock biology of microorganisms. 2000.
[15] O’Connell M, McNally C, Richardson MG. Biochemical attack on concrete in wastewater applications: A state of the art review. Cem. Concr. Compos. 2010;32:479–485.
[16] Nnadi EO, Lizarazo-Marriaga J. Acid Corrosion of Plain and Reinforced Concrete Sewage Systems. J. Mater. Civ. Eng. 2013;25:1353–1356.
[17] Islander RL, Devinny JS, Mansfeld F, Adam P, Hong S. Microbial ecology of crown corrosion in sewers. J. Environ. Eng. 1991;117:751–770.
12
[18] Hernandez M, Marchand EA, Roberts D, Peccia J. In situ assessment of active Thiobacillus species incorroding concrete sewers using fluorescent RNA probes. Int. Biodeterior. Biodegradation 2002;49:271–276.
[19] Friedrich CG, Bardischewsky F, Rother D, Quentmeier A, Fischer J. Prokaryotic sulfur oxidation. Curr. Opin. Microbiol. 2005;8:253–259.
[20] Hudon E, Mirza S, Frigon D. Biodeterioration of concrete sewer pipes: State of the art and research needs. J. Pipeline Syst. … 2011;42–52.
[21] Okabe S, Odagiri M, Ito T, Satoh H. Succession of sulfur-oxidizing bacteria in the microbial community on corroding concrete in sewer systems. Appl. Environ. Microbiol. 2007;73:971–80. [22] Lors C, Chehade MH, Damidot D. pH variations during growth of Acidithiobacillus thiooxidans in
buffered media designed for an assay to evaluate concrete biodeterioration. Int. Biodeterior. Biodegradation 2009;63:880–883.
[23] Ehrich BS, Helard L, Letourneux R, Willocq J, Bock E. Biogenic and chemical sulfuric acid corrosion of mortars. J. Mater. Civ. Eng. 1999;340–344.
[24] Sand W. Importance of Hydrogen Sulfide , Thiosulfate , and Methylmercaptan for Growth of
Thiobacilli during Simulation of Concrete Corrosion. Appl. Environ. Microbiol. 1987;53:1645–1648. [25] Beddoe RE, Dorner HW. Modelling acid attack on concrete: Part I. The essential mechanisms. Cem.
Concr. Res. 2005;35:2333–2339.
[26] Ba M, Qian C, Guo X, Han X. Effects of steam curing on strength and porous structure of concrete with low water/binder ratio. Constr. Build. Mater. 2011;25:123–128.
[27] Chen X, Wu S, Zhou J. Influence of porosity on compressive and tensile strength of cement mortar. Constr. Build. Mater. 2013;40:869–874.
[28] Kumar R, Bhattacharjee B. Porosity , pore size distribution and in situ strength of concrete. Cem. Concr. Res. 2003;33:155–164.
[29] Mahmoodian M, Alani AM. Multi-Failure Mode Assessment of Buried Concrete Pipes Subjected to Time-Dependent Deterioration , Using System Reliability Analysis. J Fail. Anal.and Preven. 2013;13:634–642.
[30] Wiktor V, De Leo F, Urzì C, Guyonnet R, Grosseau P, Garcia-Diaz E. Accelerated laboratory test to study fungal biodeterioration of cementitious matrix. Int. Biodeterior. Biodegradation 2009;63:1061– 1065.
[31] Herisson J. Biodétérioration des matériaux cimentaires dans les ouvrages d’assainissement – Etude comparative du ciment d’aluminate de calcium et du ciment Portland, Université Paris-Est, 2012. [32] Jensen HS, Nielsen a H, Lens PNL, Hvitved-Jacobsen T, Vollertsen J. Hydrogen sulphide removal
from corroding concrete: comparison between surface removal rates and biomass activity. Environ. Technol. 2009;30:1291–6.
13
[33] Setzer MJ. Action of frost and deicing chemicals - basic phenomena and testing, in: Free. Durab.Concr., 1997: pp. 3–23.
[34] American Society for Testing Materials. ASTM C109/C109M − 12. Standard Test Method for Compressive Strength of Hydraulic Cement Mortars ( Using 2-in . or [ 50-mm ] Cube Specimens ). 2012.
[35] Duracrete. Modelling of Degradation, DuraCrete - Probabilistic Performance based Durability Design of Concrete Structures, EU - Brite EuRam III, Contract BRPR-CT95-0132, Project BE95-1347/R4-5. 1998.
[36] De Larrard T, Bastidas-Arteaga E, Duprat F, Schoefs F. Effects of climate variations and global warming on the durability of RC structures subjected to carbonation. Civ. Eng. Environ. Syst. 2014;31:153–164.
[37] Rouquerol J, Avnir D, Fairbridge CW, Everett DH, Haynes JH, Pernicone N, et al. Recommendations for the characterization of porous solids. Pure Appl. Chem. 1994;66:1739–1758.
[38] Chindaprasirt P, Rukzon S. Strength, porosity and corrosion resistance of ternary blend Portland cement, rice husk ash and fly ash mortar. Constr. Build. Mater. 2008;22:1601–1606.
[39] Zhao H, Xiao Q, Huang D, Zhang S. Influence of Pore Structure on Compressive Strength of Cement Mortar. Hindawi Publ. Corp. 2014;2014:1–12.
[40] Pichler B, Hellmich C, Eberhardsteiner J, Wasserbauer J, Termkhajornkit P, Barbarulo R, et al. Strength Evolution of Hydrating Cement Pastes: the Counteracting Effects of Capillary Porosity and Unhydrated Clinker Reinforcements, in: Poromechanics V ASCE, 2013: pp. 1837–1846.
[41] Eijo-Río E., Petit-Boix A., Villalba G., Suárez-Ojeda M. E., Marin D., Amores M. J., Aldea X., Rieradevall J. and Gabarrell X. (2015). Municipal sewer networks as sources of nitrous oxide, methane and hydrogen sulphide emissions: A review and case studies. Journal of Environmental Chemical Engineering 3(3), 2084-94.
2
Table 1: Description of exposure environments.Superficial treatment (inoculation) Name Feeding conditions H. neapolitanus, standard medium H.n. 100 ppmv H2S, 0.3±0.1% CO2
A. thiooxidans, standard medium A.t. 100 ppmv H2S, 0.3±0.1% CO2
Consortium, standard medium Cons. 100 ppmv H2S, 0.3±0.1% CO2
Chemical exposure (abiotic) H2S 100 ppmv H2S, 0.3±0.1% CO2
Control Control Ordinary humid atmosphere
Table 2: Initial and final porosities in pore ranges (from raw data). Pore size
description
Initial Final (after 300 days of exposure)
H. n. A. t. Cons. H2S Control Micro: 0-10 nm 1.1% 1.3% 1.5% 1.8% 1.4% 1.4% Meso: 10-5000nm 12.1% 15.0% 21.7% 14.8% 16.6% 13.4% Macro: >5000nm 6.1% 5.5% 4.2% 8.3% 5.9% 3.2% Average Porosity 19.4% 21.8% 27.4% 24.9% 23.9% 18.0% Standard Deviation 2.4% 3.0% 2.9% 3.4% 3.1% 2.8%
3
Table 3: Equations of curves fittings for properties variation when Sa(t)≥0.006 mg/cm2.Condition Description Property variation (%) Standard deviation (%) Inoculated with H.n. Weight change Δw(Sa(t))=−0.77ln(Sa(t))−3.94
σ
w(Sa(t))=0.12ln(Sa(t))+1.34 Porosity change Δφ(Sa(t))=0.47ln(Sa(t))+3.06 σφ(Sa(t))=2.50 Strength change Δs(Sa(t))=−6.0ln(Sa(t))−40.00σ
s(Sa(t))=−1.40ln(Sa(t))+1.95 Inoculated with A.t. Weight change Δw(Sa(t))=−1.54ln(Sa(t))−8.11σ
w(Sa(t))=0.35ln(Sa(t))+2.98 Porosity change Δφ(Sa(t))=1.74ln(Sa(t))+9.79 σφ(Sa(t))=2.70 Strength change Δs(Sa(t))=−7.33ln(Sa(t))−46.70σ
s(Sa(t))=0.87ln(Sa(t))+14.66 Inoculated with Cons. Weight change Δw(Sa(t))=−2.29ln(Sa(t))−11.07σ
w(Sa(t))=0.37ln(Sa(t))+2.60 Porosity change Δφ(Sa(t))=1.09ln(Sa(t))+6.45 σφ(Sa(t))=3.08 Strength change Δs(Sa(t))=−8.40ln(Sa(t))−70.59σ
s(Sa(t))=−1.50ln(Sa(t))+2.30Abiotic H2S Weight change Δw(Sa(t))=0.40ln(Sa(t))+2.04
σ
w(Sa(t))=0.64Porosity change Δφ(Sa(t))=0.76ln(Sa(t))+4.07 σφ(Sa(t))=2.73
1
Fig. 1. Container used to maintain and expose mortar samples to hydrogen sulfide.Fig. 2. Hydrogen sulfide concentration observed in one container: a) total time window (heavy line shows the continuous equivalent concentration), b) example of applications during 5 consecutive days.
2
Fig. 4. Experimental results showing weight changes (left), porosity (center), and strength (right) as a function of time in carbonated samples dried at 110°C and inoculated with Hallothiobacillus neapolitanus(H.n.), Acidithiobacillus thiooxidans (A.t.), Consortium (Cons.), Abiotic H2S (H2S) and Abiotic control
(Control).
Fig. 5. Comparison between proposed curves and measured data for weight changes in carbonated samples dried at 110°C.
3
Fig. 6. Cumulative mercury intrusion versus pore size in carbonated samples dried at 110°C.4
Fig. 7. Comparison between proposed curves and measured data for porosity changes in carbonated samplesdried at 110°C.
Fig. 8. Comparison between proposed curves and measured data for strength changes in carbonated samples dried at 110°C.
5
Fig. 9. Strength losses associated to porosity and weight changes in biodeteriorated samples previouslycarbonated and dried at 110°C.
Fig. 10. Compressive strength to porosity relations associated to biodeterioration in biodeteriorated samples previously carbonated and dried at 110°C.