HAL Id: hal-00419076
https://hal.archives-ouvertes.fr/hal-00419076
Submitted on 6 Oct 2009
HAL is a multi-disciplinary open access
archive for the deposit and dissemination of
sci-entific research documents, whether they are
pub-lished or not. The documents may come from
teaching and research institutions in France or
abroad, or from public or private research centers.
L’archive ouverte pluridisciplinaire HAL, est
destinée au dépôt et à la diffusion de documents
scientifiques de niveau recherche, publiés ou non,
émanant des établissements d’enseignement et de
recherche français ou étrangers, des laboratoires
publics ou privés.
On-line hand-drawn electric circuit diagram recognition
using 2D dynamic programming
Guihuan Feng, Christian Viard-Gaudin, Zhengxing Sun
To cite this version:
Guihuan Feng, Christian Viard-Gaudin, Zhengxing Sun. On-line hand-drawn electric circuit diagram
recognition using 2D dynamic programming. Pattern Recognition, Elsevier, 2009, 42, pp.3215–3223.
�10.1016/j.patcog.2009.01.031�. �hal-00419076�
Contents lists available at ScienceDirect :
http://www.sciencedirect.com/science/journal/pr!
"
"
#
$ $
$
%
$&
'
(
)*) +
,
$ '
$
*) -
.
/
)
a) State Key Laboratory for Novel Software Technology, Nanjing University, China
b) IRCCyN/UMR CNRS6597, Ecole Polytechnique de l'Université de Nantes, France
! $ 0 1
0)
! $
! $ 2
3
&
1
$ 4
3
&
#
7
$ $
6
+
%
8
%
%&
' ( )* + , $ ' $ * - . / )9
a
State Key Laboratory for Novel Software Technology, Nanjing University, 210093 Nanjing, China b
IRCCyN/UMR CNRS 6597, Ecole Polytechnique de l’Université de Nantes, France
*Corresponding Author, [email protected], Tel: 86<25<83686099, Fax: 86<25<83686099
1* In order to facilitate sketch recognition, most online existing works assume that people will
not start to draw a new symbol before the current one has been finished. We propose in this paper a
method that relaxes this constraint. The proposed methodology relies on a two<dimensional dynamic
programming (2D<DP) technique allowing symbol hypothesis generation, which can correctly segment and recognize interspersed symbols. In addition, as discriminative classifiers usually have limited
capability to reject outliers, some domain specific knowledge is included to circumvent those errors due
to untrained patterns corresponding to erroneous segmentation hypotheses. With a point<level
measurement, the experiment shows that the proposed novel approach is able to achieve an accuracy of
more than 90 percent.
: & $ on<line sketch recognition, electric circuit diagram, dynamic programming
;
$
Sketches are widely used in engineering and architecture fields, especially for the early design phases [1]. This is mainly due to the fact that a sketch is a convenient tool to catch rough ideas, so that the
for the computer [3].
A difficult task in sketch recognition is to have a good balance between the drawing freedom and the complexity of recognition. Generally, the more freely a system can endure, the more difficult sketch
recognition will be. Consequently, for the sake of simplicity, most of the existing online recognition
techniques are based on the assumption that people will not start to draw a new symbol before the
current one has been finished. Obviously this is not always the case. One of the greatest advantages of
sketch<based interface is that it provides a natural and free interaction platform. Therefore, it is a significant attempt to try solving the situation with interspersed symbols.
Like speech or text recognition, sketch recognition itself is domain dependent [3]. Domain knowledge
to some extent can help recognition. Sketch recognition focuses on the localization and recognition of its
constitutional components; the problem is that although isolated symbol recognition has been studied for
many years, it still suffers in correctly rejecting outliers. Consequently, recognition based only on symbolic similarity is prone to errors. In this paper, we include contextual constraints to help to solve
this problem. Here, constraints refer to the connectivity requirement of symbols, and we introduce a
tolerant connectivity evaluation strategy.
This contribution is an extension of the work introduced in [4]. The dataset used for validating the
proposed method has been extended from ten to fifteen subjects, with a total number of one hundred thirty sketches instead of eighty<seven. Furthermore, we have reformulated the problem statement and
introduced the solution from a theoretical point of view. Additional experiments have also been
conducted to assess the sustainability of a cost function combining pattern recognition information with
The remainder of the paper is organized as follows. Section 2 provides a review of related works.
Section 3 formulates sketch recognition as a dynamic programming problem. The details of our approach are presented in section 4, followed by the experimental results in section 5. Finally,
conclusion and proposed future works are drawn in section 6.
$ <
5
As mentioned before, many efforts have been done concerning the recognition of isolated symbols
that are segmented explicitly by pausing [5] or by switching between different input modes [6]. For
example, Rubine [7] proposed an 11<dimension feature vector to describe a single stroke. Works in [2, 8]
are analogous, except that stroke segmentation is included, so they can recognize symbols made of
multiple strokes. More research on isolated symbol recognition can be found in [9].
In order to make sketch<based interaction more free and natural, researchers are working on the
automatic parsing and recognition of continuous streams of strokes. Sezgin and Davis [10] made full use
of different people’s drawing styles to improve both efficiency and performance; Costagliola and
Deufemia [11] proposed an LR (Left Right) based sketch parsing strategy; Sim<U<Sketch [12, 13] is a
sketch<based interface that depends on a hierarchical “mark<group<recognize” sketch understanding architecture; Gennari et al. [14] employed ink density and stroke characteristics to enumerate candidate
symbols; Alvarado and Davis [15] developed a parsing approach based on dynamically constructed
Bayesian networks. However, although all these works aim at developing automatic recognition
techniques, few of them have addressed the problem of dealing with interspersed symbols. Most of the
existing researches are based on the assumption that symbols will not be drawn temporally overlapping each other, which is not always the case. Although Sezgin and Davis [16] extended their approach to
recognize interspersed symbols, it still exists a high dependency on the drawing order of strokes. Also,
as it concerns only temporal patterns, no spatial or geometric constraint is incorporated. Thus, it is difficult to distinguish symbols that have the same constituent elements but with different structures,
such as two horizontal lines and a vertical capacitor.
Hammond and Davis proposed a sketching language LADDER [17]. However, their approach can
only describe regular shapes without too much detail, and it is highly dependant on the recognition
accuracy of the low level primitives. Our system performs well even when symbols are drawn with over<traced strokes. Saund et al. [18] solved the sketch recognition problem from a perceptual
perspective. Gestalt theory is introduced, which argues that human performs domain<independent
groupings to locate salient objects. However, it is more suitable for the clustering of texts instead of
diagrams.
Domain<specific knowledge is essential in designing a robust sketch recognition system, and it has been widely used in image [19] and video [20] understanding, as well as the recognition of handwritten
zip codes [21]. A variety of circuit recognition systems [12~15] have utilized connectivity constraints to
help to improve performances. However, in most previous works, connectivity constraints are defined as
binary heuristic rules, where a threshold is defined to test whether or not the required connectivity is
fulfilled. Since sketches are imprecise in nature, binary connectivity evaluation is prone to errors. Again, due to the moderate rejecting capability of most symbol classifiers to the outliers, we believe that by
In this paper, sketch recognition is formulated as a two<dimensional dynamic programming problem
to process the situations with interspersed symbols. Also, a tolerant connectivity function is proposed to improve both the efficiency and the performance.
*
(
Dynamic programming is a powerful tool that can be used to solve planning and decision<making
problems [22], and it has been applied to a wide variety of problem domains. The definition of a
dynamic programming scheme usually requires the following points:
(1) Divide the problem into several stages
(2) Identify several possible states at each stage
(3) Make decisions to change the starting state of this stage and continue to its ending state, which
will also be the starting state of the next stage
Note that the decision made on each state will affect the state for the next stage. In each stage, a
decision that achieves a reward closer to the maximum or minimum total reward is desirable
(4) Define a recursive relationship between the value of the decision at the stage and the previously found optima, i.e. the optimal decision function contains itself in its definition
* *
1 1
( )
=
opt{ ( ,
)
+
+(
+)}
(1)
where represents the starting state of the thstage, represents the decision made in the thstage, k
denotes the transition cost from to 1, denotes the function for finding the optimal decision, and
opt is the optimal value (maximum or minimum) among all of the which optimizes .
To automatically extract symbols from a freeform sketch, this paper proposes the formulation of the
(1) stages: number of symbols in the sketch, which is unknown and varies in our application
(2) state at a stage: defined as an ordered pair (S,V), where S denotes the set of segments extracted after preprocessing, and V represents the set of recognized segments, which is a subset of S
(3) decision: the newly recognized symbol (V <V), V being a superset of V, which comes from
hypothesis
(4) the sketch recognition task can be formulated as
(S, Φ)
0
(S, V )
(S,V)
cost (V
V);
V
V
S
=
′
=
+
′
−
⊂
′
⊆
(2)An on<line sketch is basically a sequence of strokes, where a stroke is a sequence of points starting
with a pen<down and ending with a pen<lift. Before carrying out the recognition stage itself, each stroke is separated into segments that correspond to perceptual graphical primitives. This is done by an
over<segmentation preprocessing step, which assumes that each of the resulting segments belongs to at
most one symbol. As a consequence, a symbol is a group of segments that corresponds to a specific label
in a domain, such as a resistor or a capacitor in an electric circuit diagram. Sketch recognition starts
from (S,Φ), where no symbol has been recognized. Each time a group of segments is added, a new
symbol is recognized and is updated with the recognition cost of (V <V) (details of how such cost is
computed will be illustrated in section 4.3). The different combinations of segments correspond to
different sequences of costs, yielding to different values. The bigger the cost is, the less likely a true
symbol it is. Therefore, the aim of sketch recognition is to find the optimal division { } that minimizes
the final cost [4], as shown below:
{V V}
arg min
(S, S)
$ 1
(
There are two opposite kinds of strategies to perform online sketch recognition. One is called
immediate feedback, which means once a stroke is drawn, sketch recognition will start. The advantage
of such strategy is that users can view the recognition results in real time. But it will, to some extent,
distract the user during the design task [23]. Again, due to the lack of complete drawing context, such
methods always need to place constraints to the drawing style of some specific symbol. In this paper, we adopt another strategy, namely lazy feedback, which means recognition starts only after the whole
sketch has been finished. The global context can help to increase the performance and decrease the
ambiguity, and at the same time it does not interfere with the user. Furthermore, this strategy is well
suited for digital pen and paper solution, where no immediate feedback is available for the user. The
drawback of this strategy is that the user is no longer in the loop, therefore, errors produced somewhere can propagate elsewhere in the remainder of the sketch.
As our approach is based on a Dynamic Programming strategy, it includes both top<down and
bottom<up process. Fig. 1 presents the flowchart of our system, which consists of the following 5 parts:
result s strokes Preprocessor Top<down Hypothesis Generator Symbol Recognizer Constraint Recognizer
Decision Maker Bottom<up
Preprocessor: preprocessor is used to divide strokes into small segments, so as to provide for a
more natural drawing environment by allowing users to vary the number of pen strokes used to create a symbol.
Symbol hypothesis generator (SHG): SHG lists all the possible combination of segments. Each
group of segments is called a symbol hypothesis (SH).
Symbol Recognizer (SR): SR provides, in addition to the label of each hypothesis, a recognition
score that will be used to define the recognition cost.
Constraint Recognizer (CR): CR provides the contextual likelihood for each hypothesis, i.e. the
connectivity cost.
Decision maker (DM): DM organizes all the SHs, and selects the one that minimizes the decision
function.
We introduce an HMM<based stroke segmentation technique to divide strokes into individual lines
and circular arcs that closely match the original input. This is done using the approach described in [24].
The HMM model is designed to describe an arbitrary stroke composed of lines and circular arcs. Local
direction and local curvature information are selected as features to define the observations. We assume
that they are produced by an underlying sequence of states. Segmentation is therefore achieved by searching the state sequence that best explains the observations. Once the optimal state sequence is
identified, the segments are readily available from transition points between specific states. Finally, a
postprocessing is carried out to merge small and overlapped segments. Also, a scaling factor is
dependant on the specific coordinate system resolution used to record the sketch. It is computed from
the histogram of the distances between consecutive extrema points in both x and y. In our application, this value is roughly equals to the height of the resistors.
= $
/& * &
2D<DP is employed to generate symbol hypotheses. The difference between 1D<DP and 2D<DP is
presented in Fig. 2. With respect to the grouping of segments, 1D<DP can only merge temporally consecutive segments together, namely the indexes of segments belonging to the same symbol are
continuous. Consider 4in Fig. 2 (left) for example, it is composed of stroke segments { 7, 8, 9, 10},
where the subscripts indicate the temporal order. Such a hypothesis could be handle with 1D<DP. On the
other hand, with 2D<DP, it is also possible to generate hypothesis like 3in Fig. 2 (right), which is made
up of { 4, 5, 8, 9}. Here, the subscripts are discontinuous.
S y m b o l h y p o th es es
Stroke segment indexes – in temporal order 4 7 10 S y m b o l h y p o th es es
Stroke segment indexes – in temporal order 3
4 5 8 9
( An illustration of the difference between 1D<DP (left) and 2D<DP (right).
If it is not allowed to draw a new symbol before the current one has been finished, 1D<DP can solve the problem properly. But in practice, we found that this is not always the case. Consider the transistor
in Fig. 4b, which is composed of segments { , , , , }, with pure 1D<DP it would not be possible
to recover such a symbol.
With such an approach the number of possible SHs grows exponentially with respect to the number of
segments. To control and limit the number of SHs, we have defined four constraints based on the
observation of the structural characteristics of electric circuit diagrams and on the experimental results.
They allow to prune invalid hypotheses. They are:
1) Maximum number of stroke segments: .
The structures of electric symbols are known in advance, thus the number of segments constituting a
symbol is limited.
2) Maximum distance between segments: .
All the segments that compose a symbol should lay nearby one to the others. So a maximum distance
can be used as a constraint in finding valid symbols. In order to make the algorithm adapted to different drawing styles, it is defined in relationship with the scaling factor defined in section 4.2.
3) Maximum number of time<jumps: .
When the subscripts of two consecutive segments of a hypothesis are discontinuous, it is considered
as a time<jump. For instance, hypothesis in Fig. 2 (right) has one time<jump. We have in our work
limited this value to =2, this value encompasses all symbol drawings that we encountered in the
sketches that have been freely collected in our database.
4) Maximum overlap ratio: .
In a regular electrical sketch two symbols should not overlap significantly. Consequently, when an
refers to the overlap area normalized by the area of the symbol hypothesis. It is defined in Eq. (4), where
denotes a stroke segment, denotes a symbol hypothesis, and denotes the bounding box.
overlap
Area ( )
R ( , ) 100%
Area ( )
= ∩ × (4)
Normally, a large overlap ratio means that the two parts should be merged into one symbol. Consider
the hypothesis { , , , } in Fig. 4b, as it overlaps with segments and , it is consequently
regarded as an invalid hypothesis and is discarded.
/& *
The second stage of the top<down process is the recognition of symbols. Connectors are processed
differently from general circuit components like resistors, transistors, etc. A first classifier checks if the
SH is a connector, if it is not the case then a second classifier recognizes the SH as a circuit component. The recognition of connectors is based on the least<square<fitting error (LSFE), and the recognition of
circuit components is handled by a neural network classifier (NNC).
The neural network classifier in our experiment is a standard multi<layer perceptron (MLP), which is
trained with a training set that incorporates not only a number of genuine samples but also many
pseudo<synthetic samples that are generated from the previous ones [25]. The recognizer accounts for the variations in hand<drawn sketches and allows symbols to be drawn using any number of strokes
drawn in any order. Also, it is insensitive to the size. However, the recognizer is sensitive to the
orientation. Since the same symbol in different orientation may require different connectivity constraints,
and connectivity evaluation is used in our approach to aid recognition. Consequently, for example,
horizontal capacitors and vertical capacitors belong to two different classes in our classifier.
the cost of recognizing a hypothesis as a symbol of class has been defined as a linear combination of
two costs (see Eq. (5)). In this relationship, cost ( ) is the intrinsic symbol resemblance cost and
cost ( ) takes into account the connectivity requirements of the symbol. is a weighting factor that is
used to balance between the two costs. The setting of the weight can be based on the level of expertise of
the user. As an example, a user familiar with the design of circuit diagrams will sketch quickly. Thus, s/he
is more likely to produce imprecise but suitably related strokes, which should suggest to overweight
cost with respect to cost .
, ,
cost (
)
=
cost
(
)
+ ×
cost
(
)
(5)The recognition cost cost is defined as below:
, 0
0 "connector " & VH( ) cost ( ) LSFE( ) "connector " & VH( )
VH( ) ≠ ∈ = − = ∈ ∞ ∉ (6)
Where VH( ) denotes the set of plausible hypotheses of the symbol of class , i.e. hypotheses with
acceptable LSFEs or class probability distribution provided by the NNC. Based on the discussions in
section 3, DP will try to find the set of symbols that minimize the overall cost in Eq. (3). Thus, if the
recognition costs for all symbols are positive, DP will try recognizing as few symbols as possible, which
is not desirable. Here, 01is used to get negative costs for perfect connectors, so as to encourage the
system to find as many symbols as possible.
For non<connectors, if the class probability is large enough, the proposed label is supposed to be the
correct one, and it will be used to define the connectivity cost, as explained in section 4.3.3. Concerning
1 This offset was determined experimentally by collecting sample circuit sketches from several users, and comparing the perfectly
the recognition cost cost , it is set to be zero. This is because the absolute score of the winning output
of the NNC is not so reliable. In this case, only the connectivity costs will guide the 2D<DP, but they are computed based on the label proposed by the NNC.
Details about how cost is computed will be explained in the next section.
+ ! &
The simple requirement of symbol recognition is that the recognizer should return relatively high
class probability for hypotheses that correspond to true symbols. Similarly, it should return relatively low probability for hypotheses that do not correspond to symbols. In fact, it is not as easy as it sounds.
Many of the hypotheses that are passed to the recognizer are pseudo<symbols, either containing
segments from multiple symbols or do not contain all the segments of a symbol. The problem lies on
that discriminative classifiers usually have limited capability to reject outliers.
An example is presented in Fig. 3. On the left side (Fig. 3a) the hypothesis corresponds to a true current source symbol and the NNC provides a class probability of 0.9994. In Fig. 3b where the current
symbol is mis<grouped with a vertical connector, the recognizer still provides a probability as high as
0.9236 with the same label. Consequently, according to Eq. (6), both hypotheses will have a cost
equals to 0. However, the cost should make the difference between these two hypotheses: it should be
higher in the second case because the connectivity constraint of having a vertical connector on both sides of a vertical current source is not satisfied.
(a) (b)
( Examples reporting the limitation of the symbol classifier.
We use connectivity constraints to guide recognition. The connectivity costs computation is based on a continuous function defined as follows:
,
1
where is the number of required
cost ( ) ( ),
connectivities for a symbol of class = = 1 ×
∑
(7)Concerning our application, irefers to the distance from the endpoint of a connector to the bounding
box of the circuit component, and is the number of required connectivity constraints. The value of
should be 2 for connectors, since there should be at least two symbols connected with both ends.
The constant distance s, introduced in section 4.2, acts as a normalization factor, which aims at
making the connectivity evaluation independent of the size of the diagram. We believe that the space between symbols is correlated to the size of the symbols, i.e. users who would like to draw big symbols
will also more likely leave a big space, and vice versa. Therefore, a non<adaptive distance can result
either in under<grouping segments of big symbols, or over<grouping segments from small symbols. Such
an approach has already been successfully implemented in text line scale evaluation.
Based on the prior knowledge of electric circuit diagram design, we have defined thirteen kinds of connectivity constraints, such as those requiring two horizontal connectors connected on left and right
sides, like horizontal capacitors composed of two parallel vertical line segments, and those asking for
class probability for a vertical current source = 0.9994
class probability for a vertical current source = 0.9236
three connectors, like transistors etc. Although the connectivity constraints employed are tailored for
circuit diagrams, other domains are likely to have similar constraints, such as flow charts, UML diagrams, finite state machine and etc. For example, in UML diagrams, classes are always connected
with association relations. Therefore, our approach can be easily adapted to those applications.
>
In the bottom<up process, all valid hypotheses are combined together to lead to a decision. A solution
must fulfill the following two conditions:
(1) segments are not shared by different hypotheses;
(2) all segments are covered.
The example given in Fig. 4 will allow to explain how the bottom<up process is carried out. Fig. 4a
gives the original drawing, where the numbers indicate the drawing order of the 5 strokes; Fig. 4b is the
preprocessing result: 8 segments are present, and Fig. 4c displays the recognition result: a transistor has been recognized.
(a) (b) (c)
( An example of the interspersed symbol.
Table 1 lists part of the hypotheses generated during the top<down process. Here, each hypothesis is
represented by setting up a correspondence between the segments of the sketch and a binary vector. If a
that position. Consider the hypothesis of 8, it means a combination of { 2, 3, 4, 6}. Also, the cost for
each hypothesis is reported.
= * Hypotheses generated for Fig. 4b during the top<down process.
Segments 1 2 3 4 5 6 7 8 cost 1 1 0 0 0 0 0 0 0 c( 1) 2 0 1 0 0 0 0 0 0 c( 2) 3 0 0 0 1 0 0 0 0 c( 3) 4 0 0 0 0 0 1 0 0 c( 4) 5 1 1 0 0 0 0 0 0 c( 5) 6 0 0 1 0 1 0 1 1 c( 6) 7 0 1 1 0 1 0 1 1 c( 7) Symbol hypothesis i 8 0 1 1 1 0 1 0 0 c( 8)
In the bottom<up process, 1is selected first. Based on condition (1), 2D<DP is going to select the one
that does not start with 1, such as 2, and so on. After covering all segments, a solution of !_1 = { 1,
2, 3, 4, 6} is achieved. o_2 = { 1, 3, 4, 7} is another valid solution that can be obtained from
the table. Segment 2, which is recognized as a connector in solution !_1 under the hypothesis 2, is
actually not a true connector, yielding a large connectivity cost, and thus, based on Eq. (3), o_2 wins.
0 1
0
Initialize , ; 0
for with B( ,1) 1,
, . { }, . ( )
for with B ( ) 1& B ( ) 1,
, . , . ( ) if B ( ) 1 ret " # # " = Φ = = = = = = ⋅ = − = + = + = = − = ∪ ∪ [ ].
urn arg min [ ].
"
"
where
B( ,1) represents the bit denoting 1of , B0( ) represents the first bit position of that is 0, and
B1( ) represents the first bit position of that is 1.
6.
/
$
In the experiments reported here, we defined nine electrical circuit components shown in Table 2,
which are interconnected with a tenth symbol, the connectors. These nine components are further
divided into 26 classes according to their orientations and different connectivity requirements. In order
to train the embedded NNC, a training database of such isolated symbols has been collected. It involved eleven people who have drawn four to five symbols of each type, with more or less the same
applications. Finally, there are a total of 451 isolated symbols used to train the classifier. Even though
the training data is very few, the training that we use is able to cope with a limited number of samples,
because of its capability to generate additional samples with some basic geometrical transformations.
Unlike in works [14][16], this classifier is trained once for all. Based on an overall of 634 testing samples collected from ten new different subjects, we achieved an average recognition rate of 97.32
= * Electric circuit components used in our experiment.
Resistor Inductor Capacitor
AC voltage DC voltage Current
E<grounding C<grounding Transistor
%
Our goal for the evaluation was to test the performance of our system on hand<drawn circuit diagrams that were drawn as freely as those people produce when drawing on paper. As there are no common
testing workbenches, we have collected our own database. To collect these sketches, we recruited fifteen
participants who are all engineering students and familiar with electric circuit diagrams. Note that only
one of them was also involved in the collection of isolated samples used for the NNC training. Each of
them was asked to copy schemes selected from two electrical textbooks. The subjects were not told about how the system works. Samples were collected using the Anoto digital pen and paper. Due to the
sampling and drawing errors, at the end there were one hundred and thirty diagrams available, with a
total number of 2651 symbols. As the samples were drawn on paper, modification was not allowed.
However, if they were aware of any mistakes, they were asked to redraw a new one.
It is very interesting to notice that people draw quite differently. Some would like to start from the left and work to the right, and others prefer to draw from top to bottom. Also, there were people who liked
participants drew symbol by symbol, they did draw interspersed symbols from time to time. Among all
the one hundred and thirty samples we collected, there are forty samples with interspersed symbols. In addition to the data collection process, we have manually segmented, grouped and labeled the
sketches to define the ground truth.
?
It is difficult to evaluate a sketch recognition technique. In most previous works, the evaluation is
performed on the percentage of symbols that is correctly located and recognized. To achieve that, generally a hard decision is taken to decide whether a symbol is correctly located and recognized. We
did not adopt that measurement, as it suffers from ambiguities for symbols that are partially recognized,
as shown in Fig. 5.
( An illustration of the computation of symbol<level precision.
We use a point<level measurement to evaluate the performance of our recognition approach. Let us
define the set of sample points of symbol $ as PO, and the set of points recognized as $ to be PO', the
recognition accuracy of $ will be defined by Eq. (8).
reg_acc( ) | PO
$
=
∩
PO | | PO | 100%
′
×
(8)This definition is equivalent to the recall measure used in the retrieval systems. From a global point of
view, since every point belongs to a single class, therefore the recall is the same as the precision in our
In order to have the estimation to be size<independent, the recognition accuracy for a class is
denoted as the macro<average accuracy of all the samples in class , as shown in Eq. (9). This is
different from the micro<average where every point would have the same weight in the evaluation.
i 1
rec_acc( ) 1
rec_acc(
$
), where label(
$
)
=
=
×
∑
=
(9)Let us consider the example presented in Fig. 5. Here, part of the resistor is mis<classified as a vertical
connector (stroke in yellow). The recognition accuracy of the resistor is computed as the number of
points located in red divided by the number of points located in both yellow and red.
6. $ $
We conducted three experiments.
Exp.1: Global system as described before, i.e. the strokes are first sent to the HMM<based
preprocessor, and then the resulting segments are taken as the input of the 2D<DP algorithm. The
computation function of costs is exactly the same as shown in Eq. (5), namely both the recognition cost
and the connectivity cost will affect the decision of sketch recognition.
Exp.2: In this experiment, the strokes are manually segmented into segments. Therefore, no preprocessing and no segmentation error are included. This experiment is used to evaluate the
percentage of errors produced by symbol recognition and connectivity evaluation.
Exp.3: The difference between Exp.1 and Exp.3 is that in Exp.3 only the recognition cost will guide
the decision of 2D<DP, i.e. for the hypothesis whose connectivity constraint is fully addressed, the
cost ( ) in Eq. (5) is set to be zero. In other words, we use binary connectivity evaluation in Exp.3.
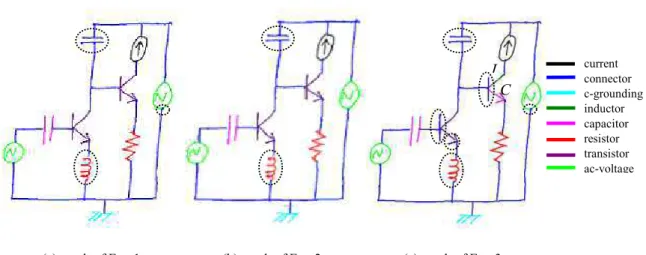
An example demonstrates the differences between the three experiment results (see Fig. 6). Here,
different kinds of components are displayed in different colors. Concerning the proposed approach (see Fig. 6a), there exist three recognition errors. First, the vertical capacitor is mis<classified as two
connectors (displayed in blue). This is a limitation of our approach, since our parser interprets a sketch
from two aspects: symbol recognition and connectivity constraints. If the two poles are too close to each
other, the connectivity costs for labeling them as two connectors will be very low; at the same time,
suppose they are almost perfect line segments, yielding a lower recognition cost (or LSFE), then 2D<DP will prefer to recognize them as connectors instead of a capacitor, which would be perfect in case of a
retracing of a connector. The second error is due to the NNC, which confused an inductor with a resistor.
Also, error happens because of the mis<segmentation of strokes, as the segment point is not located
exactly as it is in the ground truth (refer to the vertical connector connected with the AC<voltage). The
result obtained by using the ground truth segmentation is analogous (see Fig. 6b), except that there is no stroke segmentation error. With respect to Exp.3 (see Fig. 6c), the two transistors are separated into
several parts. This is because only the recognition cost will affect the decision of DP, and for perfect line
segments the costs are negative (refer to section 4.3.2), hence it will try to achieve as many connectors
(a) result of Exp.1 (b) result of Exp.2 (c) result of Exp.3
( 4 Illustration of the recognition results of experiments 1<3.
Several cases can cause recognition errors. Errors will occur when segments belonging to different
symbols are mis<grouped together in the preprocessing stage; or if the symbol classifier provides a
wrong label or when the symbol is wrongly scribed and mis<sampled, as the required connectivity is not
satisfied. However, it is really a difficult task to figure out the percentage of errors attributed to each
step.
Table 3 lists the results of the three experiments. Here, all the values on the right side of each kind of
components are the recognition accuracy for that class, as defined in Eq.9. Similarly, the Average is
computed as the macro<average accuracy of all the symbols, namely the sum of the recognition accuracy
of all the symbols divided by the number of the symbols, which is different from the mean of the above
values in the table. In this table, our approach (Exp.1) has achieved an average class<level recognition accuracy of more than 90 percent. The performance is better when the true segmentation is provided to
the system (Exp.2) since it reaches 94.1 percent, and conversely it drops to only 83.8 percent when only
hard connectivity constraints are used (Exp.3). When observing the performances at the class level,
capacitors, transistors and ac<voltages appear to be the most difficult symbols to extract. In terms of
current connector c<grounding inductor capacitor resistor transistor ac<voltage "
ac<voltage, errors are mostly caused by the NNC, as it is difficult to separate some ac<voltages from
currents. With respect to capacitors, if the user tends to draw the two poles too close to each other, our connectivity evaluation may fail. It is analogous with respect to the earth groundings.
= * Class<level recognition accuracy of the three experiments.
+ 6. 6. 6. Connector 90.61 95.04 91.09 Resistor 89.88 90.61 80.12 Inductor 95.21 97.43 91.79 Capacitor 86.51 89.51 27.62 Transistor 82.33 87.01 47.88 AC<Voltage 80.34 82.62 78.25 DC<Voltage 91.14 95.57 90.98 Current 93.99 98.43 95.03 E<grounding 89.12 96.45 42.50 C<grounding 94.80 96.31 93.62 1! 0 0
The recognition results of transistors vary among the three experiments. The reason is that in Exp.1,
some of the strokes are over<segmented into small line segments during preprocessing, resulting lower
LSFEs; also with respect to the binary connectivity evaluation, since only symbolic likelihood is useful
and the cost for perfect connectors are negative, therefore these line segments are more likely to be
excludes the segmentation errors; moreover, the favorable segmentation results promote the recognition
of other symbols. In Exp.3, the performance decreased by 6.47 percent to 83.82 percent, and the recognition results on capacitors, transistors and earth groundings are very low. All these indicate that
the tolerant connectivity constraint has a significant effect in increasing the recognition performance.
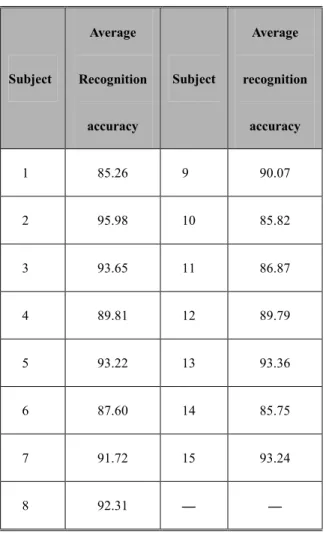
Table 4 illustrates the performance of our approach on the 15 different subjects. We achieved a best
recognition result of more than 95 percent for subject 2, and a worst result of 85 percent for subject 1.
= * Recognition result of our approach on different subjects.
/ * 1! & / * 1! & 1 85.26 9 90.07 2 95.98 10 85.82 3 93.65 11 86.87 4 89.81 12 89.79 5 93.22 13 93.36 6 87.60 14 85.75 7 91.72 15 93.24 8 92.31 — —
One more issue is about the efficiency. All global searching algorithms will face such a problem. To
tackle this problem, we have introduced spatial and temporal constraints (see section 4.3) to help to decrease the searching space. In addition, we have proposed a connectivity evaluation to be more
efficient compared with other similar approaches. However, as we are working on different workbenches,
it is difficult to provide a more convictive evaluation. Currently, the average processing time for a diagram as the example of Fig. 6 is about sixty seconds on a regular laptop.
4 + $ 2 5
In this paper, sketch recognition task is formulated as a dynamic programming problem, and a circuit diagram recognition system is implemented based on this approach. As we introduced two<dimensional
dynamic programming technique, our method can correctly locate interspersed symbols. Specifically, a
tolerant connectivity function cost is introduced, which seems to be well suited to the task of
recognizing free form sketches. With a point<level measurement, the experiment shows that the
proposed novel approach is able to achieve an accuracy of more than 90 percent. This assessment is based on one hundred and thirty sketches featuring ten different kinds of electrical symbols.
We are currently collecting samples from other application fields, so as to have a better understanding
of when people would like to draw interspersed symbols. In our experiment, interspersing happened not
only for the drawing of transistors, but also for the drawing of ac<voltages, currents, and dc<voltages.
Observations suggest that people would like to draw the external circle first, then the connected connector, and strokes inside the circle at last. In such cases, people left a symbol obviously unfinished
and returned later to finish it, which matches with the second drawing pattern underlying symbols drawn
with non<consecutive strokes in [26]. This is not the same as has been discussed in [10], where people
only draw transistors using interspersed symbols. We suggest that this is because, for one hand, there
were only 4 components: resistors, capacitors, transistors and batteries in [10], and on another hand, in our experiment, participants were asked to copy diagrams according to the textbooks, whereas during
the sample collection in [10], the textbook was removed. Whether or not interspersing happens more
frequently in copying compared with in designing requires further study.
The DP approach has been proved to have a good potential to solve the sketch recognition problem,
but the algorithm could be slow when the diagram is very large. Papadaki and Friderikos [27] have
presented an approximate dynamic programming (ADP) methodology for large<scale problems. Hence
how to develop a fast dynamic programming algorithm is another interesting topic for future study.
1 5 $
We thank the reviewers for their valuable comments. This research is jointly supported by the the National
High<Tech Research and Development Plan of China under Grant No.2007AA01Z334, the National Natural
Science Foundation of China under Grant No. 69903006 and No. 60373000, the Program for New Century
Excellent Talents in University of China (Project No.NCET<04<0460) and French ANR grant CIEL 06<TLOG<009.
2
[1] H. Lipson, M Shpitalni, Conceptual design and analysis by sketching, Artif. Intell. Des. Manuf. 14 (5) (2000)
391<401.
[2] C. Calhoun, T.F. Stahovich, T. Kurtoglu, L.B. Kara, Recognizing multi<stroke symbols, in: Proceedings of
AAAI Spring Symposium on Sketch Understanding, AAAI Press, Palo Alto, 2002, pp. 15<23.
[3] R. Davis, Magic paper: sketch<understanding research, Comput. 40 (9) (2007) 34<41.
[4] G.<H Feng, Z.<X Sun, C. Viard<Gaudin, Hand<drawn electric circuit diagram understanding using 2D dynamic
programming, in: Proceedings of the 11th International Conference on Frontiers in Handwriting Recognition,
[5] M.J. Fonseca, C. Pimentel, J.A. Jorge, Cali<an online scribble recognizer for calligraphic interfaces, in:
Proceedings of AAAI Spring Symposium on Sketch Understanding, AAAI Press, Palo Alto, 2002, pp. 51<58.
[6] M. Liwicki, L. Knipping, Recognizing and simulating sketched logic circuits, in: Proceedings of the 9th
International Conference on Knowledge<based Intelligent Information & Engineering Systems, IOS Press,
Melbourne, 2005, pp.588<594.
[7] D. Rubine, Specifying gestures by example, Comput. Graphics 25 (4) (1991) 329<337.
[8] H. Hse, M. Shilman, A.R. Newton, Robust sketched symbol fragmentation using templates, in: Proceedings of
International Conference on Intelligent User Interfaces (IUI), ACM Press, Funchal, 2004, pp. 156<160.
[9] W.<Y. Liu, On<line graphics recognition: state<of<the<art, In: J.Lladós, Y.B.Kwon (Eds.), International Workshop on Graphics Recognition: Recent Advances and Perspectives, Lecture Notes in Computer Science,
vol.3088, Springer, Barcelona, 2003, pp. 289<302.
[10] T.M. Sezgin, R. Davis, Sketch interpretation using multiscale models of temporal patterns, Comput. Graphics
Appl. 27 (1) (2007) 28<37.
[11] G. Costagliola, V. Deufemia, Visual language editors based on LR parsing techniques, in: Proceedings of the
8th International Workshop on Parsing Technologies, Nancy, 2003, pp. 78<90.
[12] L.B. Kara, T.F. Stahovich, Hierarchical parsing and recognition of hand<sketched diagrams, in: Proceedings of
the 17th annual ACM symposium on User Interface Software and Technology (UIST2004), ACM Press, Santa
Fe, 2004, pp. 13<22.
[13] L.B. Kara, L. Gennari, T.F. Stahovich, A sketch<based interface for the design and analysis of simple vibratory
mechanical systems, in: Proceedings of ASME International Design Engineering Technical Conference, Salt
[14] L.M. Gennari, L.B. Kara, T.F. Stahovich, K. Shimada, Combining geometry and domain knowledge to
interpret hand<drawn diagrams, Comput. Graphics 29 (2005) 547<562.
[15] C. Alvarado, R. Davis, Dynamically constructed bayes nets for multi<domain sketch understanding, in:
Proceedings of the International Joint Conference on Artificial Intelligence, AAAI Press, Edinburgh, 2005, pp.
1407<1412.
[16] T.M. Sezgin, R. David, Sketch recognition in interspersed drawings using time<based graphical models,
Comput. Graphics 32 (2008) 500<510.
[17] T. Hammond, R. Davis, LADDER, a sketching language for user interface developers, Comput. Graphics 28
(2005) 518<532.
[18] E. Saund, J. Mahoney, D. Fleet, D. Larner, E. Lank, Perceptual organization as a foundation for intelligent
sketch editing, in: Proceedings of AAAI Spring Symposium on Sketch Understanding, AAAI Press, Palo Alto,
2002, pp. 118<125.
[19] N. Zlatoff, B. Tellez, A. Baskurt, Image understanding and scene models: a generic framework integrating
domain knowledge and gestalt theory, in: Proceedings of the International Conference on Image Processing,
IEEE Press, Singapore, 2004, pp. 2355<2358.
[20] L.<X Xie, P. Xu, S.<F Chang, A. Divakaran, H.<F Sun, Structure analysis of soccer video with domain
knowledge and hidden markov models, Pattern Recognit. Lett. 25 (2004) 767<775.
[21] I. Chaaban, Applying domain knowledge to the recognition of handwritten zip codes. Master Thesis, Indiana
University South Bend, South Bend, 2005.
[22] M. Held, R.M. Karp, The construction of discrete dynamic programming algorithms, IBM Syst. J. 4 (2) (1965)
[23] J. Hong, J. Landay, A.C. Long, J. Mankoff, Sketch recognizers from the end<user’s, the designer’s, and the
programmer’s perspective, in: Proceedings of AAAI Spring Symposium on Sketch Understanding, AAAI Press,
Palo Alto, 2002, pp. 73<77.
[24] G.<H. Feng, HMM<based stroke fragmentation, Technical Report, Ecole Polytechnique de l’Université de
Nantes, 2007 (available at http://hal.archives<ouvertes.fr/IRCCYN<IVC/).
[25] T.Varga, H. Bunke, Generation of synthetic training data for an HMM<based handwriting recognition system,
in: Proceedings of the 7th International Conference on Document Analysis and Recognition, IEEE Computer
Society Press, Edinburgh, 2003, pp.618.
[26] C. Alvarado, M. Lazzareschi, Properties of real<world digital logic diagrams, in: Proceedings of the 1st
International Workshop on Pen<Based Learning Technologies, IEEE Computer Society Press, Catania, 2007,
pp.12.
[27] K. Papadaki, V. Friderikos, Approximate dynamic programming for link scheduling in wireless mesh network,