HAL Id: hal-01565952
https://hal-mines-albi.archives-ouvertes.fr/hal-01565952
Submitted on 20 Jul 2017HAL is a multi-disciplinary open access archive for the deposit and dissemination of sci-entific research documents, whether they are pub-lished or not. The documents may come from teaching and research institutions in France or abroad, or from public or private research centers.
L’archive ouverte pluridisciplinaire HAL, est destinée au dépôt et à la diffusion de documents scientifiques de niveau recherche, publiés ou non, émanant des établissements d’enseignement et de recherche français ou étrangers, des laboratoires publics ou privés.
Influence of Operating Parameters on Sewage Sludge
Drying in a Paddle Dryer: Design of Experiments for the
Determination of Hold-Up and Water Content Profiles
Mathieu Milhé, Martial Sauceau, Patricia Arlabosse
To cite this version:
Mathieu Milhé, Martial Sauceau, Patricia Arlabosse. Influence of Operating Parameters on Sewage Sludge Drying in a Paddle Dryer: Design of Experiments for the Determination of Hold-Up and Water Content Profiles. Drying Technology, Taylor & Francis, 2015, 33, pp.1276-1285. �10.1080/07373937.2015.1026976�. �hal-01565952�
1
Influence of operating parameters on sewage sludge drying in a
paddle dryer: design of experiments for the determination of
hold-up and water content profiles
M. Milhé*, M. Sauceau, P. Arlabosse
Université de Toulouse; Mines Albi; CNRS; Centre RAPSODEE Campus Jarlard, F-81013 Albi, France
Email of the corresponding author: mmilhe@mines-albi.fr
Abstract
In previous works, solids hold-up proved to be the most influential parameter of a stochastic flow
model of a continuous paddle dryer: we thus aimed at correlating it with operating parameters. A
fractional factorial Design of Experiments (DoE) was implemented, in which dryer slope, stirrer
speed, overflow level and sludge flow rate were initially selected as factors. The DoE was then
completed after reducing the number of influent parameters and their interactions, using surface
response methodology (RSM), to get a predictive relationship for solids hold-up determination.
The nonlinear influence of overflow height and dryer slope was confirmed by the different water
content profiles obtained during the experiments. Finally, the key role of dry solids residence
time on final sludge water content was highlighted, with an almost linear relationship. These
results emphasize the importance of hold-up for modeling purposes: this parameter has an effect
on sludge flow but also on the contact area between sludge and dryer walls.
Keywords: Paddle dryer; Design of experiments; Solids hold-up; Empirical correlation; Water
2
Introduction
Sewage sludge (SS) management is a matter of growing importance: SS production keeps
increasing with population growth and legislation restrictions. Storage and hygiene issues, as well
as landfilling limitations, contribute to making drying a necessary step in SS treatment and
valorization [1][2]. However, SS is a product quite difficult to handle, as it undergoes a transition
to a sticky state during its drying [3]: this is potentially damageable for industrial dryers where
moving equipment is involved, such as contact dryers. For this reason, paddle dryers are
recognized as well adapted tool for SS contact drying: thanks to the wedge-shaped paddles, high
shearing of the product is realized and in situ clogging is avoided [4]. Moreover, this kind of
indirect dryer offers the advantages of compactness and low exhaust volumes. In spite of the
important number of installations functioning at an industrial scale, design and operation of paddle dryers mostly rely on manufacturers’ know-how [5]. Different ways of energetic
valorization for SS are under study or actually in use, requiring various minimal water content in
sludge [6]. In these processes, drying is very energy-consuming, with around 900 kWh/ton of
water removed. Limiting the extent of drying to the minimum needed, instead of the values of
more than 90 % of solid content often reported in industrial installations, could lead to significant
energy savings and improvements of the viability of new pathways for energy recovery [7]. In
this framework, a comprehensive modeling of the drying process in a paddle dryer would
constitute a very interesting tool in order to identify the critical parameters and their influence on dryers’ performances.
3
Few studies focused on the description of sludge drying in paddle dryers in continuous operation:
while Arlabosse et al. described drying kinetics along an industrial scale installation with a
simple empirical model assuming plug flow of sludge [5], Tazaki et al. highlighted the
importance of back-mixing in such installations via a Residence Time Distribution (RTD) study
[8]. More recently, Charlou et al. developed a methodology for measuring experimental RTD
with a good repeatability in a lab-scale pilot installation [9]. These experimental RTDs were then
compared to the ones obtained by a Markov chains modeling of the reactor. In this model, each
paddle constitutes a continuous perfectly stirred tank reactor, exchanging forward and backward sludge flow with its direct neighbors, as in Tazaki’s work, but sludge flow is considered as a
stochastic process [10]. Very good agreements were observed between simulated and
experimental RTDs, after optimization of the two main model parameters. These parameters are
the dry solids hold-up Hu in each cell and the recirculation coefficient R between the cells: both
were considered constant along the dryer, i.e. for all the cells. If this is the only way for obtaining
a value of the recirculation coefficient R, Hu however can be experimentally measured. The
comparison of these data with the values obtained after optimization of the model showed that
this optimization was not necessary as far as Hu is concerned. Moreover, optimized R values lie
between 2 and 5 in the range of operating conditions tested.
A numerical parametric analysis of this Markov flow modeling highlighted the great influence of
Hu on sludge flow pattern, while R only has a limited influence [10]. In order to obtain a model
of sludge drying in a paddle dryer with no adjustable parameters, it is thus very important to be
able to estimate Hu for a given set of operating parameters. A first step is to determine which
parameters actually have an influence on Hu value; then, an empirical correlation based on
4
perturbations to a single operating parameter at a time, starting from a reference experiment.
However, this systematic approach is only applicable when the number of parameters and the
range of operating conditions are limited. When one has to work with a limited number of
experiments, setting up a Design of Experiments (DoE) is more advisable. This term
encompasses an ensemble of methodological tools allowing an experimenter estimating any
parameter influence on a given output of an experiment. Moreover, by carefully choosing
parameters values, DoE give access to statistical analysis of the results, giving more insight into
their significance [11–13].
In this paper, we studied the influence of several operating parameters on drying performances of
municipal sewage sludge in a lab-scale continuous paddle dryer. We first implement a design of
experiments, leading to an empirical correlation for estimating dry solids hold-up for a given set
of operating conditions. Then, the influence of this hold-up on experimental water content
profiles and final water content of sludge is studied.
Material and methods
Sludge characteristics
The sludge used in this study comes from the Albi city WWTP (60 000 population equivalent).
The effluent is treated via a biological-chemical phosphorus and nitrogen removal process. The
activated sludge is flocculated with a cationic polymer, thickened and anaerobically digested for
three weeks. The digested sludge is then flocculated and mechanically dewatered in centrifuges,
5
were obtained with sludge sampled over a period of three months during which no change in the
operating conditions of the WWTP was reported. Sludge was stored in air-tight containers in a
cold room at +4°C for at least two days before each experiment for stabilization of the biological
activity [14], and was not kept for more than two weeks.
Paddle dryer description
Experiments were conducted on a continuous pilot-scale paddle dryer (Figure 1): it is composed
of a 1 meter long U-shaped jacketed trough housing a shaft equipped with 18 regularly spaced
wedge-shaped paddles; scrapers are situated between the paddles in order to increase mixing and
avoid crust formation on their surface. Both the jacket and the shaft are electrically heated in
three separate zones, with regulation thermocouples placed near the stainless steel surface. Three
traps situated on top of the trough allow sampling of drying sludge during or after the
experiments. These traps as well as the trough are insulated with 5-cm thick rock wool to avoid
heat losses. Sludge and superheated steam, used a sweeping gas, are injected from one end of the
trough, above the paddles. Exhaust gases are entrained from the other end of the pilot through an
activated carbon filter before being released outside. Sludge is fed from a 40l hopper by means of
a Moineau pump which flow rate Q can be accurately controlled. Dried sludge is discharged
above an overflow which height H can be varied from the shaft axis height to the top of the
paddles. The whole installation slope θ can be varied between 0 and +5° and rotational speed of
the shaft N can also be varied between 10 and 60 rpm.
6
The installation is equipped with different sensors allowing recording temperatures and electrical
power in three different zones along the dryer, torque applied by the motor as well as mass of
dried sludge at the outlet. This monitoring can help knowing whether a steady state operation has
been reached. Indeed, reaching a steady state during SS drying experiments is not
straightforward: one cannot only rely on sludge outlet flow, since its water content can vary
during transitory periods. Moreover, water content measurement requires several hours at least
(24h at 105°C according to the norm NF EN 15934). We could overcome this issue by
monitoring continuously the torque applied by the stirrer along with the mass at the outlet. Figure
2 illustrates the relationship between torque and sludge flow rate at the outlet of the dryer
(averaged on 30 min periods). The first part of the graph illustrates a period of stability of both
torque and sludge outlet flow rate: thanks to RTD experiments, we have observed that this
behavior corresponds to a steady-state regime in the dryer [15]. After 4 h of operation, an
increase in torque value is accompanied by a decrease in average flow rate and conversely. This
indicates that an accumulation of sludge occurred, followed by a partial purge of the material in
the reactor. Such behavior is uneasy to anticipate and to explain, but is probably linked to the
stickiness of the sludge during drying [3]. In order to ensure that the remaining sludge in the
dryer corresponds to that of a steady-state operation, we waited for the torque and outlet flow rate
to be stable for at least 2 h. Once a steady-state operation was achieved, sludge feed was stopped
and the outlet was closed in order to isolate the material in the dryer. Sludge was then sampled at
9 regularly spaced spots along the dryer in order to obtain a water content profile during
steady-state operation. Stirring and heating were maintained for 2 h in order to avoid the formation of
sticky lumps inside the dryer. Dry sludge was eventually recovered and fully dried in an oven for
7
Design of Experiments
In a DoE, a well-chosen set of experiments allows one studying the effect of n parameters Xi (i =
1,…,n) on a measured response Y. The statistical analysis of the results leads to expressing this
response as function of the parameters (Eq. (1)).
(1)
Different kinds of DoE exist and their usage depends on the problem studied and its specific
experimental limitations. If no constraints exist, an experimenter would start with a factorial
design (FD), where each parameter will take two values. These values define the boundaries of
the experimental domain. An exhaustive study of the influences of the parameters and their
interactions on the response would then imply to realize 2n experiments, which would allow
establishing an empirical correlation as in Eq. (2). This is the approach realized with a full FD, in
which all interactions effects can be evaluated, with potential interactions between up to n
parameters. If 4 parameters are considered, this implies carrying out 16 experiments, since Y
would be estimated as a multi-linear expression of 16 factors.
(2)
Fractional factorial design
If one needs to decrease the number of experiments, it is possible to carry out a fractional FD,
8
2k-fold. However, the estimation of the influences of the factors is more subtle. For example, it is
possible to realize a 24-1 fractional FD, which gives access to a relation in the form of Eq. (3).
(3)
In this relationship, 8 factors (Ai) are considered for the description of Y instead of 16. These
factors actually stand for the combined influences of two factors or interactions: they are aliased.
In practice, this means that between each experiment two parameters are modified and that the
change observed in the response is a combination of the influence of these parameters or their
interactions. Depending on the matrix of experiments set up, it is possible to choose the different
aliases so as to combine factors which have a priori a negligible influence with those that are
likely to be very influent. 3rd and higher order parameters interactions (i.e. interactions between 3
or more parameters) are often neglected: it is then advisable to alias the constant term and main
factors with these high order interactions. More information on aliases theory can be found in
literature [11]. This approach can be used in a first step in order to rule out factors which have
little or no influence on the response before setting up a more complex DoE.
In this study, we started from a fractional FD with 4 operating parameters, i.e. H, Q, N and θ. The
objective of this DoE is to investigate whether or not these parameters as well as their
interactions have an influence on Hu. These parameters are not correlated, and the response can
be measured accurately. Apart from H and θ, which influence on solids hold-up was expected,
our objective was to verify whether N and Q or their interaction was influencing the solids
hold-up as it is the case in rotary drums for example [16].
Wall temperature was not considered in this study because its effect on dry solids hold-up would
9
temperatures sludge drying rate would be lower; if the other parameters would be kept constant,
the dryer would be filled with sludge having average water content higher than for a higher wall
temperature. Thus, the dry solids hold-up could be lower for the same volumetric filling of the
dryer. However, including this fifth parameter would have made the DoE more difficult analyze
since the number of experiments would have stayed the same; the corresponding fractional FD
would have been 25-2. We then chose to work under a constant wall temperature, in order to have
a clearer interpretation of operating parameters influences on the hold-up, which is the key
parameter for dryer performance for a given drying temperature. The temperature of 160°C used
in the experiments corresponds to a classical temperature for industrial applications where steam
is employed as a heating medium. We expect the results of this study to be the same in a
qualitative point of view for different wall temperatures. Sweeping gas flow rate was not taken
into account since steam is only used as a sweeping gas and not as a heat transfer medium;
indeed, it was concluded from other experiments that steam temperature had no impact on the
water content profile along the dryer; hance, the convective heat transfer is not significant in this
configuration. Finally, the origin and initial water content of the sludge are not in the frame of
this study.
The experimental procedure described previously is very time-consuming, because of long
periods for heat up and cooling down of the installation, and because of slow evolutions towards
a steady-state operation. For that reason, and with the four parameters identified, we chose to
work according to a fractional FD 24-1, thus limiting the number of experiments to 8. This
enabled us to work with a single batch of sludge, avoiding possible bias linked to aging of sludge
10
Circumscribed central composite design
Composite designs are a category of response surface methodology designs that can complete an
initial FD. One can establish a correlation of 2nd order as in Eq. (4) by adding experiments to the
initial experimental domain. This is interesting for problems of optimization or when the
evolution of the response is not likely to be linear with respect to the different parameters
involved. In such designs, 3rd and higher order interactions are generally not taken into account
[13].
(4)
Here again, several design types can be set up, that will influence some statistical properties of
the empirical correlation obtained. In this study, we worked according to a circumscribed central
composite design (CCCD). In a CCCD, parameters take additional values outside the initial
experimental domain, thus enlarging it. For that reason, care must be taken when designing the
initial experimental domain of the FD if the objective is then to implement it into a CCCD. The
additional points are situated at a distance from the center of the experimental domain; this allows obtaining a constant error on the experimental domain studied. Moreover, carrying out
multiple central experiments allows a better estimation of the variance of the regression, i.e. the
error of the prediction. The experimental domain of a CCCD is schematically represented in
Figure 3 for two parameters.
Results and discussion
11
The DoE operating conditions are gathered in Table 1 in absolute and coded values, along with
the corresponding measured solids hold-up. The coded values are calculated as in Eq. (5), where
X0 is the value of a parameter X at the center of the experimental domain, X’ is its coded value,
and ΔX corresponds to the limit of the experimental domain. All the results presented in this
paper are expressed in a non-dimensional form, with coded values X’ for the parameters and the
corresponding coefficients αi.
(5)
The experimental domain defined here is relatively narrow. However, parameters values were
chosen in order to be able to carry out all the potential experiments of the subsequent CCCD,
where the coded values would be laying between α = 1.4 and α = 2 depending on the number of
retained parameters.
For each experiment, the response can be expressed as in Eq. (3). Solving this set of equations
gives access to the 8 coefficients corresponding to 8 variables describing the response. As
previously stated, in a fractional FD parameters and their interactions influences are aliased. In
our case, the coefficients obtained and the corresponding aliases implied by this DoE are gathered
in Table 2. We neglected 3rd and 4th order interactions (i.e. between 3 and 4 parameters
respectively), which simplifies the interpretation of the DoE results. In the following, we thus
consider that the first five coefficients (α1 to α5) are only related to the constant term and the main
parameters, while the last coefficients (α6 to α8) stand for 2 aliased interactions each.
Several DoE software can give access to statistical treatment of these results: in this study we
worked with Nemrodw©. Figure 4 illustrates the values of the coefficients in Table 2, except for
12
coefficients, i.e. their influence is strongest on the response. Moreover, this influence is
statistically significant at the 95% confidence level, as expressed by the vertical dash-dotted lines.
This is easily related to physical effects: an increase in overflow level results in an increase in the
volume available for sludge in the dryer which is expressed by the positive value of the
coefficient α2. On the contrary, an increase in dryer slope will decrease this volume, hence the
negative value of the coefficient α3.
As illustrated in Figure 4, N and Q influences proved to be largely non-significant. To the authors’ best knowledge, there have been no publications concerning this specific aspect of
sludge processing in paddle dryers, so this result can only be discussed through analogies with
our technologies. Rotary drums appear as the closest configuration, as they are operated for
processing divided solids with agitation. In such installations, the mean residence time of solids
increases only slightly with the product flow rate Q [16]: this is equivalent to saying that the
hold-up increases almost linearly with the product inlet flow rate. This observation is only valid
for rotary drums without discharge dam and the equivalent for rotary drums with a discharge dam
has not been studied as far as the authors know. The configuration studied here is radically
different from the one cited above: whereas in rotary drums, solids flow is mainly driven by
product characteristics such as angle of repose and relies on their free flowability [17], this is not
the case in SS paddle drying. According to the results of this fractional FD, increasing SS flow
rate would not result in accumulating more dry material in the paddle dryer. It is possible that
more wet sludge would be present in the dryer, but since at a higher flow rate drying
performances are lower, the resulting dry solids hold-up would not be significantly different.
The same qualitative observations can be made regarding the non-influence of the stirring speed
13
drums without discharge dam is well documented: an increase in the rotation speed will result in
a decrease of the hold-up. This is also explained by the increased flowability of the materials in
the rotary drum with the rotation speed. On the contrary, in a paddle dryer, the stirrer only has a
mixing effect and does not seem to participate in sludge motion. This observation is consistent
with what was observed during RTD experiments with different stirring speeds: increasing N
from 14 to 28 rpm did not significantly change the RTD pattern while other parameters were kept
constant [10].
Concerning interactions terms, a general rule is that a non-influent parameter will not yield
significant interactions with other parameters. Here, the only significant interaction possible
would be H*θ. The coefficient β6 can thus be considered as the actual coefficient for this
particular interaction (and not for the alias). The non-dimensional coefficient for this interaction
term is negative: this means that an increase in either parameter will lower the influence of the
other. The influence of slope will thus be low for the greater overflow heights, and conversely the
influence of overflow height is lower for the highest slopes while it is important for a slope close
to 0°. Based on these results, the problem is simplified by considering only two parameters, H
and θ, and their interaction. The hold-up can thus be described by Eq. (6).
(6)
The DoE then becomes a full FD with 2 parameters in which each experiment was doubled. The
coefficients in Eq. (6) are gathered in Table 3, and the corresponding Pareto chart is illustrated in
Figure 5. Coefficient values are the same than previously. However, since there are now more
experiments than needed, the system has more degrees of freedom. This reduces the values for
14
confirms that both parameters as well as their interaction have a very high probability of being
influent at the 95 % confidence level. The standard error on the estimated hold-up is 113.7 g and
the adjusted regression coefficient R²a is 0.985. The interaction effect between H and θ is
illustrated in Figure 6, which shows that the variation of the hold-up with H is not the same
depending on θ value, and conversely. This correlation appears satisfactory from the statistics
point of view and the coefficients obtained describe well the influence of the operating
parameters. However, the value obtained for the constant term was not consistent with previous
observations on similar experiments. Moreover, the experimental domain defined in Table 1 is
relatively narrow, and it is probable that the influence of θ is not linear. These issues can be
addressed by turning the current full FD into a CCCD.
Circumscribed central composite design with 2 parameters
This part of the study was realized with a second batch of sludge, all sampled in one time at the
same WWTP. Sludge was produced under identical conditions than during the first part of this
study. Repeatability experiments were carried out beforehand in order to verify that sludge from
these two batches behaved similarly. The objective here is to complete the experiments in order
to obtain a correlation of the form of Eq. (7), similar to Eq. (4).
(7)
The CCCD is summed up in Table 4: for the 4 first experiments, the hold-up is the mean of the
two experiments corresponding in the first DoE. Indeed, since the influence of N and Q is now
neglected, in the initial FD all experiments were actually carried out in duplicates. 4 axis points
15
Two central points were finally added (experiments 9 and 10), which show a good repeatability
of the experiments. Moreover, hold-up values for these experiments are very different from the
value of the constant term issued from the FD, which was almost twice as high. This confirms the
need for considering a nonlinear evolution of the hold-up with the operating parameters studied.
The coefficients corresponding to Eq. (7) estimated with this DoE are summed up in Table 5. The
standard error on the estimated hold-up is 13.7 g, and the adjusted regression coefficient R²a is
0.902. This correlation offers an overall good description of dry solids hold-up, even though the
significance of coefficients is a bit lower than the previous one, with p-values comprised between
0.6 and 1.4 % at the 95 % confidence level. The distribution of the error from the correlation in
Eq. (7) on all the experiments carried out for this study is illustrated in Figure 7. The error is
regularly distributed around 0, so that the correlation does not appear to be biased; however, it
often reaches more than 10 %. This low accuracy could result from the assumptions made while
carrying out this DoE: for example, while N and Q are considered as non-influent through the
statistical analysis, the experiments where these parameters vary do not always end up with
repeatable results (see exp. 1 and 2, Table 1). But this also expresses that sludge is a complex
biological product, whose rheological behavior is very difficult to understand and anticipate.
While great care was taken in obtaining reliable results based on well-controlled experiments, it
is possible that some would have shown a poor repeatability.
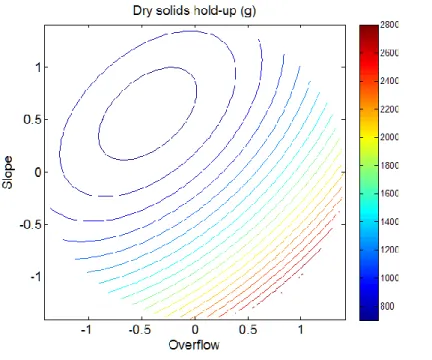
Contours of the response surface of the correlation in Eq. 7 over the experimental domain of the
CCC design are illustrated in Figure 8. H and θ are expressed in coded values. As expected, the
highest Hu values are obtained with low slopes and high overflow levels. A limitation to such a
simple model also appears in this figure: a minimum for the estimated hold-up appears inside the
16
lowest value of overflow height. A practical consequence is that this correlation should not be
used for estimating hold-up in this area of the experimental domain.
Figure 8: Contours of values for dry solids hold-up estimated from Eq. 7
Influence of operating parameters on water content profiles
At the end of each experiment, sludge was sampled along the dryer in order to determine the
water content profiles. The water content is defined as the ratio of the mass of water to that of dry
sludge. The profiles obtained from the additional experiments from the CCCD are plotted for
different values of θ in Figure 9 and H in Figure 10. In some profiles presented the water content
decreases at first and seems to increase or stagnate around the middle of the dryer. This is due to
the low loading of the dryer in some operating conditions, which implies a poor mixing of the
17
this phase, sludge flows in relatively big lumps and sampling a representative part of the bulk at
the corresponding location is not easy.
In Figure 9, the profiles correspond to experiments 7, 8, 9 and 10 (see Table 4), with θ varying
between 1.6 and 4.4 °. A first observation is that these profiles show a fairly good repeatability,
as the data from experiments 9 and 10 are quite similar. The influence of θ on water content
profiles follows the same trend than that of Hu: for 3 and 4.4 ° the profiles are similar, while for
1.6 ° the water content is much lower particularly after the first third of the dryer. In Figure 10,
the profiles correspond to experiments 5, 6 and 9 (see Table 4), with H varying between 95 and
131 mm. Here again, the influence of H on water content profiles follows the same trend than that
of Hu: for 95 and 113 mm the profiles are similar, while for 131 mm the water content is lower
after the first third of the dryer. These trends in water content profiles result partly because of the
higher contact area between sludge and the heated parts of the dryer for higher values of solids
hold-up. However, a higher hold-up also implies a higher residence time of sludge: this parameter
is thus also to be studied.
Influence of hold-up on final water content
The geometric residence time of dry solids τds in the dryer can be calculated according to Eq. (8),
where Qds is the dry solids flow rate in the dryer.
(8)
The relation between τds and sludge dry solids content at the outlet of the dryer is illustrated in
18
(7). The final water content is the mean water content observed in sludge at the outlet of the dryer
during the duration of the steady state. Experimentally, we observe a linear evolution between
residence time and final water content until around 3 h of residence time, for which sludge is
almost fully dried. Longer residence times are thus not required in our operating conditions. This
highlights the importance of controlling sludge residence time in order to reach a desired water
content at the outlet of paddle dryers, which will be determining for the development of
economically feasible industrial energetic valorization for sludge [18].
In spite of the scattering between experimental and calculated residence time values due to the
error on the correlation for Hu estimation (see Figure 7), the trends for experimental and
calculated residence times are the same in Figure 11. The scattering in final water contents for
similar residence times could be explained by the fact that different hold-ups can lead to the same
residence time depending on the inlet sludge flow rate. Hence, for the same residence time, a
higher loading of the dryer would result in higher final water content because of the increase in
contact area between sludge and dryer walls. An accurate description of sludge drying in such
reactors would require taking into account both the effect of residence time and of the contact
area through which heat transfer would happen.
Conclusion
An empirical correlation relating sludge dry solids hold-up to paddle dryer operating parameters
was determined thanks to a design of experiments. In a first step, a fractional factorial design was
implemented, allowing studying the influence of 4 parameters with 8 experiments: sludge flow
19
height and their interaction were the most influential parameters. This design was then completed
to a circumscribed central composite design with only these two parameters, giving access to a
quadratic relationship between parameters and hold-up, over a larger range of operating
conditions. The error on hold-up estimation by using this correlation is less than 15% compared
to experimental data, and the standard error on calculated hold-up is 13.7 g. The study of sludge
water content profiles along the dryer confirmed that the influence of overflow height and slope
installation on hold-up was not linear in our range of operating conditions. The determining role
of hold-up is evidenced by the almost linear relationship between final dry solid content in sludge
and its geometric residence time. These results will be implemented in a model describing heat
and mass transfer during drying via the penetration theory along with sludge flow via a
markovian approach.
Nomenclature
α, β Coefficients for factors influence in DoE results (-)
Hu Dry solids hold-up in the paddle dryer (g)
H Overflow height (mm)
N Stirring speed (rpm)
Q Raw sludge flow rate (g/h)
20
R²a Adjusted regression coefficient (-)
θ Dryer slope (°)
τds Dry solids geometric residence time (h)
References
1. Fytili, D., Zabaniotou, A.: Utilization of sewage sludge in EU application of old and new methods--A review. Renewable and Sustainable Energy Reviews. 12, 116‑140 (2008).
2. Manara, P., Zabaniotou, A.: Towards sewage sludge based biofuels via thermochemical conversion – A review. Renewable and Sustainable Energy Reviews. 16, 2566‑2582 (2012). 3. Kudra, T.: Sticky Region in Drying: Definition and Identification. Drying Technology. 21,
1457‑1469 (2003).
4. Chen, G., Lock Yue, P., Mujumdar, A.S.: Sludge Dewatering and Drying. Drying Technology. 20, 883‑916 (2002).
5. Arlabosse, P., Chavez, S., Lecomte, D.: Method for Thermal Design of Paddle Dryers: Application to Municipal Sewage Sludge. Drying Technology. 22, 2375‑2393 (2004).
6. Arlabosse, P., Ferrasse, J.-H., Lecomte, D., Crine, M., Dumont, Y., Léonard, A.: Efficient Sludge Thermal Processing: From Drying to Thermal Valorization. In: Tsotsas, E. et Mujumdar, A.S. (éd.) Modern Drying Technology. p. 295–329. Wiley-VCH Verlag GmbH & Co. KGaA (2011).
7. Rulkens, W.: Sewage Sludge as a Biomass Resource for the Production of Energy: Overview and Assessment of the Various Options†. Energy Fuels. 22, 9‑15 (2008).
8. Tazaki, M., Tsuno, H., Takaoka, M., Shimizu, K.: Modeling of Sludge Behavior in a Steam Dryer. Drying Technology. 29, 1748‑1757 (2011).
9. Charlou, C., Sauceau, M., Arlabosse, P.: Characterisation of Residence Time Distribution in a Continuous Paddle Dryer. J. Residuals Sci. Technol. 10, 117‑125 (2013).
10. Milhé, M., Charlou, C., Sauceau, M., Arlabosse, P.: Modeling of sewage sludge flow in a continuous paddle dryer. Drying Technology (accepted for publication).
11. Box, G.E.P., Hunter, J.S., Hunter, W.G.: Statistics for experimenters: design, innovation, and discovery. Wiley-Interscience (2005).
12. Box, G.E.P., Hunter, J.S.: Multi-Factor Experimental Designs for Exploring Response Surfaces. The Annals of Mathematical Statistics. 28, 195‑241 (1957).
13. Montgomery, D., C.: Design and Analysis of Experiments. Wiley.
14. Ferrasse, J., H., A., P...: Heat, momentum, and mass transfer measurements in indirect agitated sludge dryer. Drying Technology. 20, 749‑769 (2002).
15. Charlou, C., Milhé, M., Sauceau, M., Arlabosse, P.: A new methodology for measurement of sludge residence time distribution in a paddle dryer using X-ray fluorescence analysis. Water Research (accepted for publication).
21
16. Liu, X.Y., Specht, E.: Mean residence time and hold-up of solids in rotary kilns. Chemical Engineering Science. 61, 5176‑5181 (2006).
17. Kramers, H., Croockewit, P.: The passage of granular solids through inclined rotary kilns. Chemical Engineering Science. 1, 259‑265 (1952).
18. Ferrasse, J.-H., Seyssiecq, I., Roche, N.: Thermal Gasification: A Feasible Solution for Sewage Sludge Valorisation? Chem. Eng. Technol. 26, 941‑945 (2003).