Journal of Fundamental and Applied Sciences is licensed under a Creative Commons Attribution-NonCommercial 4.0 International License. Libraries Resource Directory. We are listed under Research Associations category.
DETERMINATION OF CHARACTERISTICS MAXIMAL RUNOFF MOUNTAIN RIVERS IN CRIMEA
V. Ovcharuk* and O. Todorova
Odessa State Environmental University, Ukraine
Received: 03 December 2015 / Accepted: 23 April 2016 / Published online: 01 May 2016
ABSTRACT
This article has been examined maximum runoff of the rivers of the Crimean Mountains. The rivers flow through the western and eastern part of the northern slope Crimean Mountains, and on its southern coast. The largest of them: Belbek, Alma, Salgir, Su-Indol and others. To characterize the maximum runoff of rain floods (the layers of rain floods and maximum discharge of water) on the rivers of the Crimean Mountains were used materials of observations for long-term period (from the beginning of observations to 2010 inclusive) on 54 of streamflow station with using a the so-called «operator» model for maximum runoff formation.
Key words: maximum runoff; rain floods; hillslope runoff; karst.
Author Correspondence, e-mail: valeri.o@mail.ru; lenochka.todorova@mail.ru doi: http://dx.doi.org/10.4314/jfas.v8i2.23
1. INTRODUCTION
Crimea is located within the 440 23 '(Cape Sarich) and 460 15' (Perekopsky earth trench) north latitude and 320 30 '(Cape Karamrun) and 360 40' (Cape lantern) east longitude (fig.1). The area of the Crimean peninsula is 26,0 thousand km2, the maximum distance from north to south - 205 km, from west to east - 325 km. A narrow eight-kilometer strip of land in the
ISSN 1112-9867
V. Ovcharuk et al. J Fundam Appl Sci. 2016, 8(2), 525-541 526
north (Perekop isthmus) connects Crimea with the mainland, and 4-5 kilometers - the width of the Kerch Strait in the east (Strait length of about 41 km) - separate it from the Taman Peninsula. The total length of the borders of the Crimea exceeds 2,500 km (including extreme tortuosity of the northeast coastline). Due to its characteristics of the Crimean peninsula is divided into three parts: the steppe Crimea, Kerch Peninsula and Mountain Crimea.
Fig.1. Location map of Crimea
The rivers of Mountain Crimea are characterized by frequent rain floods. Formation of rain floods is associated with rainfall torrential character that covers a relatively small catchments area. After the falling large amount of precipitation the river is turning in turbulent flows with discharge of water, many times greater than the average value that can lead to disastrous consequences. In Crimea, 80-85% of the annual precipitation falls as rain. On the mountain of the Crimean rivers cause flooding rains that accompanied the demolition of eroded rocks. Rainstorms, at the same time never cover the entire Crimea. They typically fall in any one area. Most often heavy rains and downpours occur within one day. Flooding warm season on the rivers are not observed at the same time. For example, in the western part of the rivers of
the northern slope of the Crimean Mountains, the maximum discharges of the warm period observed most frequently in April-July. By the rivers of the southern coast of Crimea - from April to August, and the eastern part of the rivers of the northern slope - in the spring (fig.2).
Fig.2. Map hydrological zoning of Crimea (I – the rivers western part of the northern slope of
the Crimean Mountains; II – the rivers eastern slope of the Crimean Mountains; III - the rivers of the Southern coast of the Crimea)
The analysis showed (fig.3) that on the territory in question is most frequently observed maximal quantity rainfall is 71-90 mm (27.3%), for the formation of flood warm season is characteristic rainfall is in the range 31-70 mm (total probability - is 40, 9%).
0,00 5,00 10,00 15,00 20,00 25,00 30,00 <30 31-50 51-70 71-90 91-110 111-130 131-150 >150
Fig.3. The distribution of rainfall floods warm period, abscissa - precipitation layer, mm; the
V. Ovcharuk et al. J Fundam Appl Sci. 2016, 8(2), 525-541 528
Last official publication, that provides design characteristics of maximum runoff on this territory dates back to 1973.
Given the fact that over the past 40 years there has been climate change, both regional and global scale, it interesting to investigate possible trends in the maximum flow of the rivers and determine its modern characteristics.
2. METODS
To assess the statistical homogeneity of the initial information used three criteria: F-test (Fisher criterion), Student's t-test and Wilcoxon criterion. The assessment of cyclical fluctuations maximal runoff is performed using the differences-integral curves, and statistical processing using the method of moments and maximum likelihood. The estimation of the significance of correlations realized using Pearson correlation coefficient, as well as using the Spearman rank tests and Kendall [1].
For calculation of maximum runoff of rain flood for ungauged rivers used the so-called «operator» model for maximum runoff formation that was described in detail in [2,3]. The following calculation equation is the basic:
F p m m T t q q ψ ε ′ = 0 , (1)
Where Ψ
(
tp /To)
- transformation functions; εF - coefficient of channel and flood plain storage; qm′ - is the maximum modulus of slope influx, equal to:m m Y T n n q 0 1 1 + = ′ , (2) Where (n+1)n– irregularity coefficient for slope influx; To- duration of slope influx; Ym – layer of slope influx.
3. RESULTS OF INVESTIGATION
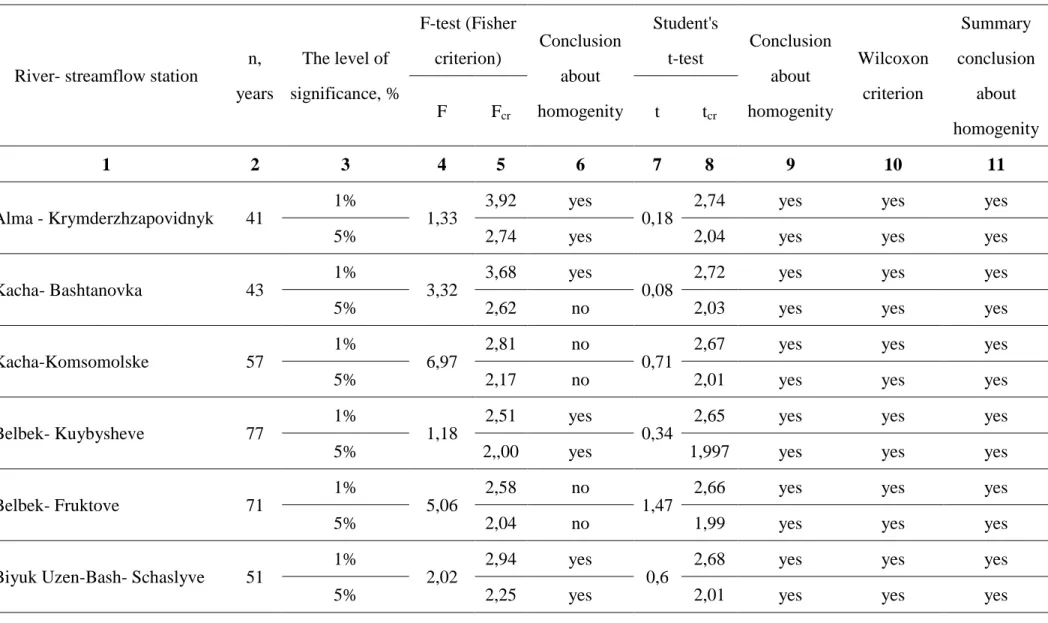
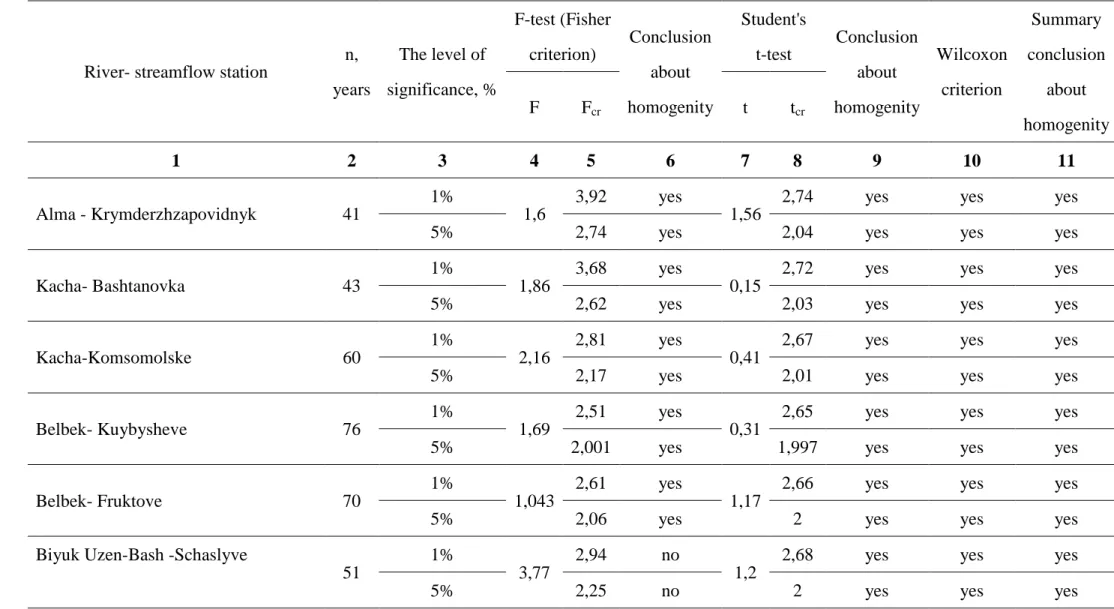
Analyzing the results of the estimation of homogenity, it should be noted that the characteristics of rain floods of the Crimean rivers in most cases are homogeneous in time. Checking the homogeneity was conducted on the ranks with duration more than 40 years of
observations using F-test (Fisher criterion), Student's t-test and Wilcoxon criterion. The maximum discharges of rain floods are homogeneous in 21 cases out of 23, based on three criteria it means that 91.3% of ranks are homogeneous. A similar situation observed for the series of layers of rain floods - they are homogeneous in 20 cases out of 22, based on three criteria (91%). In general, the information’s on the maximal runoff of rain floods should be considered homogeneous (Table 1, 2). To analyses the possible temporal trends in the ranks of the high flow floods warm period were built chronological charts, which can identify patterns and trends of long-term fluctuations layers of runoff and water discharges. Analyzing the graphs, it can be noted that trend is virtually absent on the studied rivers of the Crimean Mountains (correlation coefficient r = 0.014 to 0.091, that well can see on the fig.4).
y = 0,0007x - 0,3639 R2 = 0,0002 0,00 1,00 2,00 3,00 4,00 5,00 6,00 1920 1930 1940 1950 1960 1970 1980 1990 2000 2010 Т Кі y = 0,005x - 8,8247 R2 = 0,0083 0,00 1,00 2,00 3,00 4,00 5,00 6,00 7,00 8,00 9,00 1920 1930 1940 1950 1960 1970 1980 1990 2000 2010 Т Кі
Fig.4. The temporal trends of maximum runoff rain flood
(a - Chernaya river, b - Su-Indol river)
a
Journal of Fundamental and Applied Sciences is licensed under aCreative Commons Attribution-NonCommercial 4.0 International License. Libraries Resource Directory. We are listed under Research Associations category.
Table 1. The results of the estimation of homogenity maximum water discharge to river Mountain Crimea
River- streamflow station
n, years The level of significance, % F-test (Fisher criterion) Conclusion about homogenity Student's t-test Conclusion about homogenity Wilcoxon criterion Summary conclusion about homogenity F Fcr t tcr 1 2 3 4 5 6 7 8 9 10 11 Alma - Krymderzhzapovidnyk 41 1% 1,33 3,92 yes 0,18
2,74 yes yes yes
5% 2,74 yes 2,04 yes yes yes
Kacha- Bashtanovka 43
1%
3,32
3,68 yes
0,08
2,72 yes yes yes
5% 2,62 no 2,03 yes yes yes
Kacha-Komsomolske 57
1%
6,97
2,81 no
0,71
2,67 yes yes yes
5% 2,17 no 2,01 yes yes yes
Belbek- Kuybysheve 77
1%
1,18
2,51 yes
0,34
2,65 yes yes yes
5% 2,,00 yes 1,997 yes yes yes
Belbek- Fruktove 71
1%
5,06
2,58 no
1,47
2,66 yes yes yes
5% 2,04 no 1,99 yes yes yes
Biyuk Uzen-Bash- Schaslyve 51
1%
2,02
2,94 yes
0,6
2,68 yes yes yes
1 2 3 4 5 6 7 8 9 10 11 Chernaya-Rodnykivske 72 1% 1,12 2,54 yes 0,13
2,65 yes yes yes
5% 2,02 yes 1,998 yes yes yes
Kokkozka-Aromat 40
1%
4,99
4,16 no
1,14
2,75 yes yes yes
5% 2,86 no 2,04 yes yes yes
Uchan Su-Chehove 62
1%
2,36
2,61 yes
1,14
2,66 yes yes yes
5% 2,06 no 2 yes yes yes
Derekoyka-Yalta 77
1%
1,73
2,51 yes
0,46
2,65 yes yes yes
5% 2 yes 1,997 yes yes yes
Demerdzhi-Alushta 59
1%
1,91
2,77 yes
0,43
2,67 yes yes yes
5% 2,16 yes 2,006 yes yes yes
Ulu-Uzen- Sonyachnohirske 61
1%
1,24
2,74 yes
0,65
2,67 yes yes yes
5% 2,14 yes 2,004 yes yes yes
Taraktash-Sudak 60
1%
6,65
2,81 no
2,04
2,67 yes yes yes
5% 2,17 no 2,007 no yes no Kyzyltashskyy-Schebetovka 54 1% 22,68 2,9 no 0,64
2,68 yes yes yes
V. Ovcharuk et al. J Fundam Appl Sci. 2016, 8(2), 525-541 532
1 2 3 4 5 6 7 8 9 10 11
Su-Indol-Topolivka 80 1% 10,19 2,41 no 2,1 2,65 yes yes yes
5% 1,94 no 1,99 no yes no
Salhyr-Pionerske 56 1% 1,48 2,87 yes 0,54 2,68 yes yes yes
5% 2,21 yes 2,009 yes yes yes
Anhara-Perevalne 58
1%
2,61
2,81 yes
0,8
2,67 yes yes yes
5% 2,17 no 2,007 yes yes yes
Burulcha-Mezhyhir'ya 65 1% 1,95 2,71 yes 1,18 2,66 yes yes yes
5% 2,12 yes 2,003 yes yes yes
Biyuk-Karasu-Bilohirsk 44 1% 2,47 3,68 yes 0,61 2,72 yes yes yes
5% 2,62 yes 2,03 yes yes yes
Kuchuk-Karasu-Bahate 59 1% 18,001 2,81 no 2,04 2,67 yes yes yes
5% 2,17 no 2,007 no yes no
Kuchuk Uzen-Bash - Mnohorichchya
46 1% 1,24 3,45 yes 0,31 2,71 yes yes yes
5% 2,51 yes 2,02 yes yes yes
Kuchuk tributary Uzen Bash 46 1% 1,98 3,45 yes 1,21 2,71 yes yes yes
5% 2,51 yes 2,02 yes yes yes
Uskut-s.Pryvitne 41 1% 2,49 3,92 yes 1,99 2,74 yes yes yes
Table 2. The results of the estimation of homogenity layers for maximum runoff rivers of Mountain Crimea
River- streamflow station
n, years The level of significance, % F-test (Fisher criterion) Conclusion about homogenity Student's t-test Conclusion about homogenity Wilcoxon criterion Summary conclusion about homogenity F Fcr t tcr 1 2 3 4 5 6 7 8 9 10 11 Alma - Krymderzhzapovidnyk 41 1% 1,6 3,92 yes 1,56
2,74 yes yes yes
5% 2,74 yes 2,04 yes yes yes
Kacha- Bashtanovka 43
1%
1,86
3,68 yes
0,15
2,72 yes yes yes
5% 2,62 yes 2,03 yes yes yes
Kacha-Komsomolske 60
1%
2,16
2,81 yes
0,41
2,67 yes yes yes
5% 2,17 yes 2,01 yes yes yes
Belbek- Kuybysheve 76
1%
1,69
2,51 yes
0,31
2,65 yes yes yes
5% 2,001 yes 1,997 yes yes yes
Belbek- Fruktove 70
1%
1,043
2,61 yes
1,17
2,66 yes yes yes
5% 2,06 yes 2 yes yes yes
Biyuk Uzen-Bash -Schaslyve
51
1%
3,77
2,94 no
1,2
2,68 yes yes yes
V. Ovcharuk et al. J Fundam Appl Sci. 2016, 8(2), 525-541 534 1 2 3 4 5 6 7 8 9 10 11 Chernaya-Rodnykivske 74 1% 1,42 2,58 yes 0,39
2,66 yes yes yes
5% 2,04 yes 1,99 yes yes yes
Kokkozka-Aromat 40
1%
1,55
4,16 yes
0,36
2,75 yes yes yes
5% 2,86 yes 2,04 yes yes yes
Uchan Su-Chehove 62
1%
1,71
4,73 yes
0,68
6,59 yes yes yes
5% 3,21 yes 4,92 yes yes yes
Derekoyka- Yalta 79
1%
2,89
2,48 no
2,38
2,65 yes yes yes
5% 1,98 no 1,996 no no no Demerdzhi-Alushta 60 1% 3,6 2,81 no 0,71
2,67 yes yes yes
5% 2,17 no 2,01 yes yes yes
Ulu-Uzen- Sonyachnohirske 62
1%
1,15
2,77 yes
0,61
2,67 yes yes yes
5% 2,16 yes 2,01 yes yes yes
Taraktash-Sudak 59
1%
1,14
2,81 yes
0,24
2,67 yes yes yes
5% 2,17 yes 2,01 yes yes yes
Kyzyltashskyy-Schebetovka 53
1%
17,15
2,9 no
1,39
2,68 yes yes yes
1 2 3 4 5 6 7 8 9 10 11 Su-Indol-Topolivka 82 1% 2,72 2,45 no 0,35
2,65 yes yes yes
5% 1,96 no 1,995 yes yes yes
Salhyr-Pionerske 56
1%
2,65
2,81 yes
2,65
2,67 yes yes yes
5% 2,17 no 2,007 no no no Anhara-Perevalne 59 1% 1,61 2,81 yes 0,16
2,67 yes yes yes
5% 2,17 yes 2,01 yes yes yes
Burulcha-Mezhyhir'ya 65
1%
1,057
2,71 yes
0,49
2,67 yes yes yes
5% 2,12 yes 2,003 yes yes yes
Biyuk-Karasu- Bilohirsk 43
1%
1,69
3,68 yes
0,54
2,72 yes yes yes
5% 2,62 yes 2,03 yes yes yes
Kuchuk-Karasu-Bahate 60
1%
1,92
2,81 yes
0,8
2,67 yes yes yes
5% 2,17 yes 2,01 yes yes yes
Kuchuk Uzen-Bash - Mnohorichchya 46
1%
1,5
3,45 yes
0,8
2,71 yes yes yes
5% 2,51 yes 2,02 yes yes yes
Uskut-Pryvitne 40
1%
1,56
4,16 yes
1,01
2,75 yes yes yes
Journal of Fundamental and Applied Sciences is licensed under a Creative Commons Attribution-NonCommercial 4.0 International License. Libraries Resource Directory. We are listed under Research Associations category.
To characterize the cycling fluctuation of discharges and maximum layers are constructed the difference integral curves for the rivers of the Crimean Mountains (fig.5). In general we can say that the phase of water content of maximum runoff Crimean rivers are practically identical, and discrepancies in the flow can be explained by different exposure slopes with respect to moisture air masses and characteristics of the underlying surface (eg, the presence of karst)[4]. -20,0 -15,0 -10,0 -5,0 0,0 5,0 10,0 1920 1930 1940 1950 1960 1970 1980 1990 2000 2010 Т Σ(Кi-1)
Belbek Taraktash Kuchuk-Karasu
-10 -8 -6 -4 -2 0 2 4 6 1920 1930 1940 1950 1960 1970 1980 1990 2000 2010 Т Σ(Ki-1)
Belbek Taraktash Kuchuk-Karasu
Fig.5. Difference-integral curves of maximum water discharges (a) and layers runoff (b) of
rain floods for the rivers of the Crimean Mountains: 1 - r. Belbek (the north-western slope of the Crimean Mountains);
2 - r. Taraktash (southern coast of Crimea);
3 - r. Kuchuk-Karasu (north-eastern slope of the Crimean Mountains)
a
One of the principal tasks under development of methods for maximum runoff is generalization the runoff layers. Proceeding to spatial generalization of the layers of runoff in mountain districts, it is necessary, in the first instance, to consider that the characteristics of runoff in the mountains, as distinct from those of the flat lands, are subject not to geographical zonality but altitudinal zonation.
For the rivers in the mountain of the Crimea this dependence is clearly traced - the layer increases with an increase in the altitude of a locality, on the other hand, in the studied area there is another factor which substantially influences the runoff distribution in a territory - it is the karst. Such dependence for the Y1% (layers of runoff) is shown in fig. 6
y = 0,19x - 18,50 R2 = 0,27 0 200 400 600 800 1000 1200 1400 0 200 400 600 800 1000 1200 H av, m Y1%,mm Area of karst
Fig.6. Dependence Y1% on the average altitude of water catchment area of the rivers of the
Crimean Mountains
Similar dependence is observed for another characteristic of hillslope runoff - its duration. As is shown in fig. 7, we have distinct pattern of an increase in the studied parameter with the altitude in cases for most of the rivers, but as in case with the runoff layers there is another factor that has strong influence - this is the karst [5].
As for irregularity coefficient for slope influx, it average for rivers of investigated territory is 16.
V. Ovcharuk et al. J Fundam Appl Sci. 2016, 8(2), 525-541 538 y = 0,10x - 6,80 R2 = 0,34 0 50 100 150 200 250 300 350 400 450 500 0 200 400 600 800 1000 1200 Н av, m То, hours Area of karst
Fig.7. Dependence of the duration of slope influx on the average altitude of a water catchment
area of the rivers in the Crimean Mountains
Taking into account that the constituents of the maximum modulus of hillslope influx depend on the altitude and vary in one direction, we had saggested that the integrated characteristic of slope influx (the maximum modulus of slope influx), that calculated by formula (2), will depend from altitude too. But, as well illustrates fig. 8, q'm is almost independent of this
factor. y = 0,0024x + 5,70 R2 = 0,011 0,00 5,00 10,00 15,00 20,00 25,00 0 200 400 600 800 1000 1200 Н av, m q`m ,m³/(s km²)
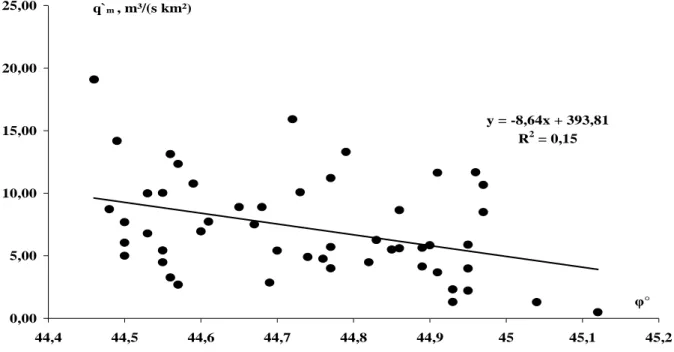
Since the dependence the q'm from the altitude is not observed, it was studied the effect on this
characteristic the latitude. The dependence of the maximum modulus of hillslope influx from latitude is presented in fig. 9.
y = -8,64x + 393,81 R2 = 0,15 0,00 5,00 10,00 15,00 20,00 25,00 44,4 44,5 44,6 44,7 44,8 44,9 45 45,1 45,2 φ° q`m , m³/(s km²)
Fig.9. Dependence of the maximum modulus of hillslope influx on latitude
The significance of the obtained dependence was tested on three criteria - by Pearson's correlation coefficient and two ranking nonparametric criteria Spearman and Kendall (tabl.3) In this case the dependence is quite clear, with a significant correlation coefficient , which is the basis for mapping the maximum modulus of slope influx (fig 10).
Table 3. Estimate of the significance of correlation between the maximum modulus of
hillslope Cremia rivers and latitude its watersheeds by 5% level of significance
Pearson correlation Сonclusion about the significance criterion Spearman rank tests Сonclusion about the significance criterion Kendall rank tests Сonclusion about the significance criterion -0,39 significant -0,302 significant -0,219 significant
V. Ovcharuk et al. J Fundam Appl Sci. 2016, 8(2), 525-541 540
In general, the maximum modulus of slope influx vary in direction from the northeast from 0.5 m3/s km2 to 15 m3/s km2, from the south-west, on the contrary first a decrease of 20 m3/s km2 to 2.5 m3/s km2, and then there is a tendency to increase up to 20 m3/s km2.The general rule are violated the karst areas in which the observed value of runoff above (area of discharge) and considerably lower (karst area feeding) than zoning values.
Area of karst discharge (20 m3/s km2) Area of karst supply (2,5 m3/s km2)
Fig.10. Schematic map of the maximum modulus of slope influx
4. CONCLUSION
Analysis of cyclicality of maximum runoff rain floods in the Crimea showed no significant trends, and the presence of several complete cycles of the oscillation of water content.
These results allow the use of statistical methods for the valuation characteristics of the maximal runoff.
As calculating are proposing the technique by professor Gopchenko based on the theory of bed isochron.
Testing calculations for the proposed method show good agreement with its precision baseline information that allows us to recommend it to practical application.
5. REFERENCES
[1] Sá Joaquim. Applied Statistics Using Spss, Statistica, Matlab and R. — Berlin: Springer, 2007.
[2] E.D. Gopchenko, V.A. Ovcharuk, M.E. Romanchuk. A method for calculating characteristics of maximal river runoff in the absence of observational data: Case study of Ukrainian rivers Water Resources, Pleiades Publishing, May 2015, Volume 42, Issue 3, pp 285-291.
[3] Ladjel M. Gopchenko E.D. Ovcharuk V.A. Maximum runoff of the flood on wadis of northern part of Algeria J Fundam Appl Sci. 2014, 6(1), 66-77.
[4] E.Todorova, V. Ovcharuk Study cyclicality maximum runoff rivers of Crimea in conditions of modern climate change // The 26th IUGG General Assembly, Prague, Czech Republic, Prague Congress Center, Jully 22- June 2, 2015, HS01pChanges in Flood Risk and Perception in Catchments and Cities. – Abstract: HS01p – 119.
[5] Ovcharuk V.A., Todorova Ye.I. Research of karst's influence on the characteristics of slope runoff during floods on the rivers of north-western slope of Crimean mountains // Research Bulletin SWorld «Modern scientific research and their practical application», Volume J11302, May 2013, J11302- 012.
How to cite this article:
Ovcharuk Todorova O. Determination of characteristics maximal runoff Mountain Rivers in Crimea. J. Fundam. Appl. Sci., 2016, 8(2), 525-541.