HAL Id: hal-01960984
https://hal.inria.fr/hal-01960984
Submitted on 8 Jan 2019
HAL is a multi-disciplinary open access
archive for the deposit and dissemination of
sci-entific research documents, whether they are
pub-lished or not. The documents may come from
teaching and research institutions in France or
abroad, or from public or private research centers.
L’archive ouverte pluridisciplinaire HAL, est
destinée au dépôt et à la diffusion de documents
scientifiques de niveau recherche, publiés ou non,
émanant des établissements d’enseignement et de
recherche français ou étrangers, des laboratoires
publics ou privés.
A practical method for measuring Web above-the-fold
time
Diego da Hora, Dario Rossi, Vassilis Christophides, Renata Teixeira
To cite this version:
Diego da Hora, Dario Rossi, Vassilis Christophides, Renata Teixeira. A practical method for measuring
Web above-the-fold time. ACM SIGCOMM 2018 Conference, Aug 2018, Budapest, Hungary.
�hal-01960984�
A practical method for measuring Web
above-the-fold time
Diego da Hora
Dario Rossi
Telecom ParisTech
Vassilis Christophides
Renata Teixeira
INRIA
ABSTRACT
Page load time (PLT) is still the most common application Quality of Service (QoS) metric to estimate the Quality of Ex-perience (QoE) of Web users. Yet, recent literature abounds with interesting proposals for alternative metrics (e.g., Above The Fold, SpeedIndex and variants) that aim at closely cap-turing how users perceive the Webpage rendering process. However, these novel metrics are typically computationally expensive, as they require to monitor and post-process videos of the rendering process, and have failed to be widely de-ployed.
In this demo, we show our implementation of an open-source Chrome extension that implements a practical and lightweight method to measure the approximated Above-the-Fold (AATF) time, as well as others Web performance metrics. The idea is, instead of accurately monitoring the rendering output, to track the download time of the last visible object on screen (i.e., “above the fold”). Our plugin also has options to save detailed reports for later analysis, a functionality ideally suited for researchers wanting to gather data from Web experiments.
1
INTRODUCTION
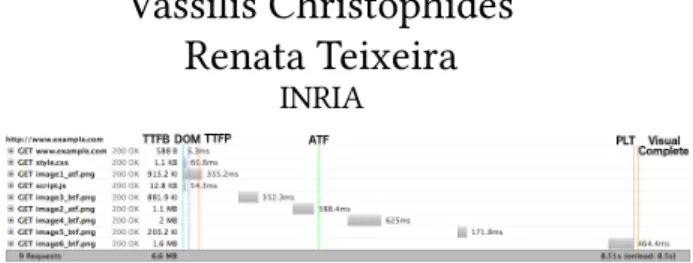
The Web is still a dominant applications in today’s Inter-net, that evolved from delivering simple static contents to serve dynamic and complex content. Measuring the impact of different session protocols (e.g., HTTP/2 and QUIC), net-work technologies (e.g., landline vs 5G) and Web browser configurations (e.g., V8 vs Gecko) on Web browsing quality of experience (QoE) is essential to enhance user satisfaction. Yet, defining Web QoE is hard since the Web browsing process is complex with the request, download, and render-ing of hundreds of objects from tens of domains makrender-ing up a single Webpage. The literature introduces several objective QoS metrics, which we exemplify with the help of Fig. 1. The time to load a Web page has a number of components, such as the time at which the first byte is received (TTFB), the time at which the first object is painted (TTFP) by the browser, the parsing of the Document Object Model (DOM), to the complete page (PLT) — the latter one typically mea-sured using theonload event, and that is commonly used nowadays in both academia and industry.
Figure 1: Loading process of an example page, anno-tated with Web performance metrics.
We notice that whereas network-related time-instant met-rics (e.g. TTFB, DOM, PLT) are easy to measure, rendering-related metrics (e.g. TTFP, VisualComplete) are harder to define across browsers [5]. An interesting metric proposed by Google in this class is represented by the Above-the-Fold (ATF) time [2], defined as the time at which the content shown in the visible part of the Webpage is completely ren-dered. Albeit interesting, the ATF metric is neither avail-able in Webpagetest (https://www.webpagetest.org/) nor defined in W3C’s navigation timing specifications (https: //www.w3.org/TR/navigation-timing/). This omission is pos-sibly because the ATF time is significantly more complex to measure.
At the same time, the interest for metrics such as ATF is clear considering the example “waterfall” diagram in Fig. 1, where different objects of the page are depicted as a Gantt chart: it can be seen that while the above-the-fold portion of the page is fully rendered in about 2 seconds (a timescale likely appreciated by users), the page download process con-tinues for a (significantly) longer time, with theonload event signaled at 8.5 seconds (a timescale at which users would likely be impatient). Our practical proposal to measure the ATF time is then interesting to gather, at a low computational cost, more telling and relevant Web QoE metric than PLT.
2
DEMO HIGHLIGHTS
In this demo, we showcase our practical method to approxi-mate the Above-the-Fold time (AATF). In particular, we devel-oped a Chrome extension that implements AATF and calcu-late other Web performance metrics, that we make available as open source software[4]. A preview of the demo is avail-able athttps://newnet.telecom-paristech.fr/index.php/webqoe/.
SIGCOMM’18, August 21-23, 2018, Budapest, Hungary Diego et. al
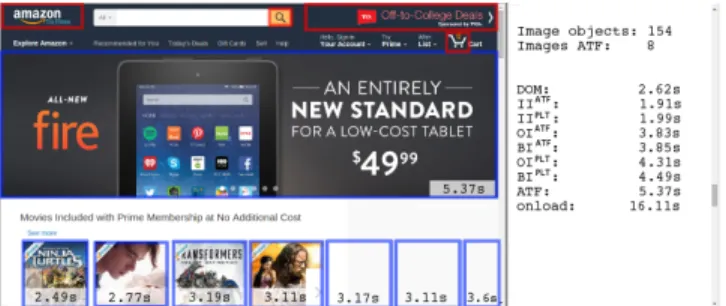
Figure 2: Example of AATF plugin in action: all objects above the fold are rendered on or before ATF=5.37s but the page only finishes loading at PLT=16.11sec.
Methodology. We approximate the Approximated Above-the-Fold (AATF) time from the browser itself without re-quiring image processing. We leverage the browser’s ability to determine the position of objects inside a fully rendered page and the recorded loading times of HTTP requests. First, we detect all the elements of the Webpage and the browser window size. Then, we trace loading time and resource type for all HTTP requests, and determine which objects are ren-dered above-the-fold. To do so, we use simple heuristics to classify resource types between images, JavaScripts (JS), CSS, HTML, etc. For objects that are directly rendered (e.g., of the image class), the coordinates make it obvious whether they are, at least partly, above-the-fold.
Implementation. We implemented the method to com-pute the AATF time as an open-source Chrome extension[1]. To avoid affecting the browsing experience by design, the script is executed after the onLoad event triggers. We use JavaScript to detect visible DOM objects: for each object, we detect its position and size on the page. We use this information alongside the browser windows’ to determine which DOM objects are visible and above-the-fold. We use the Window.performance API to obtain the name, type, and timing information about the resources loaded in the page. We compare the src field of DOM object to the url of HTTP requests to match HTML objects to its corresponding tim-ing information. Finally, we calculate the AATF as early de-scribed.
Functionalities. Our Chrome extension not only reports the AATF, but also other relevant metrics whose details are given in [3]. In particular, the plugin computes three time instant-metrics (namely DOM, PLT, and AATF), as well as three time-integrals metrics (namely ObjectIndex, ByteIndex, and ImageIndex). We also calculate integral metrics with an “early cut-off” at AATF, for a total of 9 WebQoE metrics.
The plugin is suitable for both interactive use (e.g., in classrooms) as well as to automate measurement campaigns (e.g., for research). For its interactive use, the plugin can be configured to display statistics at different verbosity levels. The plugin has options for saving a detailed log with both performance metrics and a detailed description of the page content (useful for later analysis). It can be configured to execute either a set amount of time after PLT or after a fixed time after page load start, whichever comes first – this makes automated test robust, since the PLT event may not be signaled in some circumstances.
Demonstration workflow. We will do a live demonstration of the plugin capabilities measuring all WebQoE metrics in two network scenarios: good network conditions and limited bandwidth. The objective is for users to perceive the difference in web QoE metrics in both scenarios, judging by themselves which metrics (among DOM, AATF, and PLT) are more representative of their subjective experience. We will emulate both scenarios using Google chrome’s network throttling tool. An illustration of these metrics is shown in Fig.2, when browsing the Amazon webpage. We observe that only 8 of the 154 images are located above-the-fold (circled in blue in Fig 2), with a significant difference between PLT, AATF, and derived metrics. The plugin clearly shows that while the full Amazon page is rendered in about 5 seconds (AATF), the page completes in over 16 seconds (PLT).
We will also show, for the interested user, the results of a thorough and systematic comparison of these metrics with a measurement campaign involving several thousands Mean Opinion Scores (MOS) points from real users [3] – presented at PAM 2018.
ACKNOWLEDGEMENTS
This work was carried out at LINCS (http://www.lincs.fr) and benefited from the support of NewNet@Paris, CiscoâĂŹs Chair “Networks for the Future” at Telecom ParisTech (http: //newnet.telecom-paristech.fr).
REFERENCES
[1] [n. d.]. https://chrome.google.com/webstore/detail/approximate-atf/ eedmonedcfjniaagehchbkdolbobmfhb. ([n. d.]).
[2] Jake Brutlag, Zoe Abrams, and Pat Meenan. [n. d.]. Above the fold time: Measuring Web page performance visually. http://conferences.oreilly. com/velocity/velocity-mar2011/public/schedule/detail/18692. ([n. d.]). [3] Diego Neves da Hora, Alemnew Sheferaw Asrese, Vassilis Christophides,
Renata Teixeira, and Dario Rossi. 2018. Narrowing the gap between QoS metrics andWeb QoE using Above-the-fold metrics. InProc. PAM. [4] Diego da Hora and Dario Rossi. [n. d.]. Approximate ATF Chrome extension. http://github.com/TeamRossi/ATF-chrome-plugin. ([n. d.]). [5] Minutes of TPAC Web Performance WG meeting. [n. d.]. https://www.
w3.org/2016/09/23-webperf-minutes.html. ([n. d.]).
A practical method for measuring Web above-the-fold time SIGCOMM’18, August 21-23, 2018, Budapest, Hungary
DEMO REQUIREMENTS
This demo has very light requirements. We describe bellow the equipment, time and space necessary for carrying out our demonstration.
Equipment. We will use one laptop, which requires in-ternet connection, and one monitor. We will also display a poster detailing the motivation and theory behind our work.
Space. The default space of one table space and poster board is enough for our equipment and poster.
Setup-time. We expect a setup-time of approximately 30 minutes.
Additional requirements. While internet access is impor-tant (i.e. a part of the demo), the default is enough. We can fallback to a locally hosted version of the demo in case of internet failure.