HAL Id: hal-00256202
https://hal.archives-ouvertes.fr/hal-00256202
Submitted on 14 Feb 2008
HAL is a multi-disciplinary open access
archive for the deposit and dissemination of
sci-entific research documents, whether they are
pub-lished or not. The documents may come from
teaching and research institutions in France or
abroad, or from public or private research centers.
L’archive ouverte pluridisciplinaire HAL, est
destinée au dépôt et à la diffusion de documents
scientifiques de niveau recherche, publiés ou non,
émanant des établissements d’enseignement et de
recherche français ou étrangers, des laboratoires
publics ou privés.
Towards the next generation of video and image quality
metrics: Impact of display, resolution, contents and
visual attention in subjective assessment
Patrick Le Callet, Stéphane Péchard, Sylvain Tourancheau, Alexandre
Ninassi, Dominique Barba
To cite this version:
Patrick Le Callet, Stéphane Péchard, Sylvain Tourancheau, Alexandre Ninassi, Dominique Barba.
Towards the next generation of video and image quality metrics: Impact of display, resolution, contents
and visual attention in subjective assessment. Second International Workshop on Image Media Quality
and its Applications, IMQA2007, Mar 2007, Chiba, Japan. pp.A2. �hal-00256202�
TOWARDS THE NEXT GENERATION OF VIDEO AND IMAGE QUALITY METRICS:
IMPACT OF DISPLAY, RESOLUTION, CONTENT AND VISUAL ATTENTION IN
SUBJECTIVE ASSESSMENT
Patrick LE CALLET
1, Stéphane PECHARD
1, Sylvain TOURANCHEAU
1, Alexandre NINASSI
1,2,
Dominique BARBA
11
Université de Nantes – IRCCyN laboratory – IVC group
Polytech’Nantes, rue Christian Pauc, 44306 Nantes, France
2
THOMSON R&D 35511 Cesson-Sevigne, France
ABSTRACT
Two decades of research in video and image quality assessment has led to the design of subjective assessment protocols and objective metrics. In order to get good performances, most of research works have restricted their focus of interest on SD format or below and on distortion stemming from coding artifacts or transmission error. Considering up-coming services such as HDTV or scalable video coding, next generation of quality metric should take into account more factors that affect the end user quality of experience. In this paper, a review of factors is proposed considering subjective quality assessment. The four studied factors include display, resolution, content and visual attention. Each factor reveals open issues in quality assessment.
1. INTRODUCTION
Among topics related to image and video processing, quality assessment is one of the most difficult task. Nevertheless, quality assessment is mandatory either to estimate performances of a compression algorithm or either to improve a given system or a whole transmission chain from the end user quality of experience point of view. Image and video quality assessment have been extensively studied during the last two decades either through subjective experiments, e.g. with human observers, or through objective metrics, e.g. with dedicated algorithms. If subjective assessment represents the ground truth, it is an annoying, time consuming approach: when running a subjective test, standard conditions must be reproduced to obtain correct, universal and reliable evaluations. Moreover, this concept of ground truth should be admitted with caution. Automatic objective metrics reliably predicting the perceived quality of images, would be a great improvement in quality assessment field.
Best examples of the research effort on quality assessment relies in the ITU recommendations and
VQEG activities. A part conditions and methodologies in order to run subjective test, standard objective metrics have been released for full reference metrics in the context of SD TV. At this time, VQEG is running test plan to define full reference, reduced reference and no reference metrics for multimedia applications. Previous works and work in progress are mainly related to coding or transmitting purpose, e.g. coding artifacts and transmission errors, at a given resolution (no relation between resolution). Considering, the whole chain, quality assessment should be able to manage dependency to other technology issues. New services in relation with technology improvements could be sold at the right acceptable prices if end-user quality of experience is well identified. However, each new feature brings specific distortions but also enhancements for visual quality. New techniques of quality assessment including subjective methodology need to be developed in order to characterize each element.
Among new video services, High Definition Television (HDTV) is an excellent example of challenging issues regarding quality assessment. First, this new generation broadcasting system provides higher immersion in action and better visualization comfort. Television has always suffering from a lack of presence, immediacy and impact compared with “cinema-like” experience. The basic idea to produce psychological effects is to widen the display screen and, simultaneously, to increase considerably the resolution of the source. Previous studies [1] have shown that ideal distance to watch moving pictures is 3H (4H for programs with rapid movements). The corresponding viewing angle of 20°-30° reduces considerably the sensation of presence of the display system. Because, viewing angle is higher in HDTV compared to SDTV, parafoveal vision is highly excited. It means that as display size is increasing, artifacts perception is less uniform. Second issue related to video quality and HDTV comes from the display technologies. These new materials bring specific distortions (and also enhancements for visual quality) that must be identified. Finally, due to its better rate performance, H264 coding
standard is going to be used for HDTV broadcasting in Europe. This standard induces artefacts that are highly dependent on the video contents, and so impact on quality is obvious but still unknown.
In this paper, we propose a review of the impact of different factors on video quality judgement through subjective experiments.
2. IMPACT OF DISPLAY ON SUBJECTIVE QUALITY
2.1. LCD vs CRT
As the screen size is heightening, standard CRT displays becomes bulky and heavy. As a result CRT displays are doomed to disappear and new display technologies (LCD, PDP) are improving and will soon replace old CRT technology. It seems that LCD is more likely to succeed because of problems attached to plasma large resolution displays. However, it has been shown that subjective quality of a sequence displayed on LCD is globally lower than subjective quality of the same sequence displayed on CRT [2]. Among all the defects mentioned by 36 video expert observers, motion blur seems to be the most annoying one. This appears in sequences with rapid movements. Other shortcomings have been enumerated such as colour differences, degradations in dark areas and de-interlacing artefacts for interlaced sequences. Most of the recent improvements in LCD technology are related to motion blur minimization. A part response time compensation, a material solution to reduce motion blur is to modify the temporal aperture of the display. Different methods have been proposed, such as backlight flashing [3, 4], frame rate doubling [3, 6], black data insertion [5] and motion-compensated inverse filtering [6]. From manufacturers point of view, it is very important to assess the reduction of motion blur and ideally to estimate the quality loss due to motion blur. We have conducted subjective experiments to quantify the impact of LCD motion blur on the perceived quality on LCD with respect to the perceived quality on CRT (which is considered to be the reference here). quality between CRT and LCD.
2.2. Subjective quality assessment 2.2.1. Protocol
Eigth sequences in 1080i format with significant movements, and for which motion blur is the main perceived defect when displayed on LCD, have been selected. Each of them contain 250 frames which correspond to 10 second duration. Tests have been performed both on a CRT and on a LCD display in a specific showroom. Lighting conditions and display parameters have been precisely measured and adjusted
according to BT.500-11 and BT.710-4 ITU
recommendations. The HDTV displays used were a JVC
DT-V 1910CG and a Philips T370 HW01 which both can display 1080i sequences. Viewing distance was set to 3H, where H is the height of the screen.
Observers were mostly male students in their mid twenties. Every candidate is first checked for color blindness with Ishihara test and for acuity with Monoyer’s plates. People with at least one error in Ishihara’s test or less than 9/10 in Monoyer’s test are rejected. 21 people took part in these tests in the CRT session and 19 in the LCD session.
As very little quality differences must be detected, the protocol to rate the video should allow quality discrimination. A well known stable method for this purpose is the SAMVIQ method [7], developed by France Telecom R&D and standardized by the European Broadcasting Union (EBU). Observers compare sequences (seven distorted sequences and one hidden reference) both between them and with the explicit reference. Notation scale is continuous, each score can take a value between 0 and 100. SAMVIQ is a multi stimuli continuous quality scale protocol. It provides a precise and reliable [8] measure of the subjective video quality which can be compared directly to the reference. 2.2.1. Results
Mean opinion scores (MOS) of observers for the eight reference sequences are shown in Table 1. DMOS is the difference of MOS from CRT and LCD :
DMOS=MOS CRT-MOS LCD (1)
Thus, subjective quality measured on LCD is lower than the one measured on CRT. It can be observed that DMOS is varying strongly with the sequences, as a result CRT MOS and LCD MOS are not well correlated. Correlation coefficient and root mean square error between the two MOS sets are given below :
CC(MOS CRT,MOS LCD)=0.751 (2)
RMSE(MOS CRT,MOS LCD)=8.58 (3)
Table 1: Mean opinion scores by sequences and displays.
Sequence MOS CRT MOS LCD ∆MOS
PARKRUN 86.28 81.32 4.96 SHIELDS 84.68 77.95 6.73 STOCKHOLM 83.56 81.74 1.82 CONCERT 80.33 72.05 8.29 FOOT 83.56 73.05 10.51 VOILE 83.83 73.09 10.74 SHOW 81.15 69.28 11.87 CREDITS 82.7 73.76 8.94
3. IMPACT OF RESOLUTION ON SUBJECTIVE QUALITY
Changing resolution means also changing the viewing distance and consequently changing the viewing angle. As mentioned in the introduction, higher viewing angle of HDTV compared to SDTV excite more parafoveal vision and fovea grabs only a small part of the video. Since perception in parafovea (motion ability) is rather different to perception in fovea (spatial acuity), changing viewing distance could affect considerably the perceived video quality. From a quality of experience point of view, it is unclear how observers are likely to prefer the larger image which is proposed by HDTV with respect to the distortion artifacts. Therefore, we have designed experiments to study the resolution versus distortion ratio involved in observers preference threshold between HDTV and SDTV.
3.1. Subjective quality assessment 3.1.1. Sequences
Four ten-second long 1080i HDTV sequences from SVT research have been used. Sequences have been distorted through the use of H.264 JM reference software. Seven bitrates have been produced per HD sequence. Bitrates differ from one sequence to another and are presented in Table 2. The selection of these bitrates has been done in order to cover the useful quality range from a poor to an excellent visual quality.
Sequence HDTV Bitrates (Mbps)
New Mobile & Calendar 2.2 ; 2.5 ; 3.1 ; 4 ; 5 ; 7 ; 10 Parkrun 8 ; 12 ; 16 ; 18 ; 20 ; 24 ; 28 Knightshields 2.2 ; 3 ; 4 ; 5 ; 6 ; 7 ; 8 Stockholm Pan 1.6 ; 1.8 ; 2.2 ; 3 ; 3.6 ; 4 ; 6
Sequence SDTV Bitrates (Q60, Q80) New Mobile & Calendar 1.8 ; 3
Parkrun 5.3 ; 9
Knightshields 1.6 ; 3
Stockholm Pan 1.2 ; 1.8
Table 2: Chosen bitrates (in Mbps) per video sequence.
As an approximation of SD 576i sequences, SDTV sequences (definition 960´540) are computed from HD sequences through a half band filtering followed by sub-sampling by a factor of 2 (both along horizontal and vertical directions). Both fields are decimated separately before reconstitution in progressive format. This technique is motivated by the fact that this definition is very close to “real 16/9” SDTV (1024´576) and no interpolation is required. Furthermore, this results in a half-height video (QHD in figure 2, for Quarter HD), which can satisfy both recommended distances for SD (D=6H) and HD (D=3H), H being the video’s height [1,
9, 10]. As with HD sequences, SD videos have been encoded using the H.264 reference software, with the same parameters but for two bitrates corresponding to two common SD broadcast quality. They have been chosen to be representative of an excellent (Q80) and of a rather good (Q60) subjective visual quality, respectively. It means to get scores of around 80 and 60 on a continuous subjective quality scale of 1 to 100. 3.1.2. Protocol
The protocol is derived from the comparative method with adjectival categorical judgment described in BT.500-11 ITU Recommendation. Series of comparison tests have been performed through several presentations. A presentation consisted of one or several visualizations of two video sequences labeled “video A” and “video B”. HD and SD videos were assigned letter A or B randomly. A visualization was the viewing of both videos A and B. During each visualization, the observer compared A and B. After an initial visualization, he/she could replay any video as much as he/she wanted before voting. This random access increases reliability, as shown in the EBU’s SAMVIQ methodology. After each presentation, the observer had to report the existence on a preference category scale (7 categories, see Table 3). To avoid screen flickering and screen’s manual switching between HD and SD, SD videos have been inserted at the center of an HD video with gray background.
Caption to choose Value stored I prefer much more A than B +3
I prefer more A than B +2
I prefer a little more A than B +1
I have no preference 0
I prefer a little less A than B -1
I prefer less A than B -2
I prefer much less A than B -3
Table 3: Comparison scale for comparison test protocol.
Tests have been performed in the same environment described in the previous section. The HDTV screen used was a CRT JVC DT-V 1910CG which can display 1080i sequences. Uncompressed 1080i video sequences were played with a V1-UHD player.
Observers were mostly male students in their mid twenties. All are familiar with SDTV and cinema but not with HDTV. They were checked and screened according to the method described in section 2.
3.2. Results
3.2.1.Observation Distance
Prior to the preference test, observers were asked to determine their set their own observation distance. All went farther than 3H for HDTV. Average viewing
distance measured about 8H with a standard deviation of 1.5 H. This result is due to the habit of SDTV usual observation distance. People have a certain television viewing culture, and without informing them that HDTV is supposed to be watched closer, they don’t adapt their habits to the new media. It is also interesting to notice that when positioned at 3H, most observers expressed the feeling that there was too much information to process, therefore observers often needed to stand back in order to consider so much information. The screen was so close that motion in the peripheral area of the retina was disturbing for many.
3.2.1.Resolution versus distortion trade off
PSNRs of the sequences have been computed to measure the distortion importance. For each sequence and each SDTV bitrate, DPSNR is defined as DPSNR=PSNRHD-PSNRSD. It measures the artifact
difference between HD and SD. Figure 1 presents the preference, e.g. mean opinion score (MOS), as a function of DPSNR with 95% confidence intervals for the Stockholm Pan sequence. Since results from both configurations (Q80 and Q60) are plotted, this figure indicates that the user preference of HD over SD depends on the distortion importance difference. Results with other sequences are similar. The arrow indicates the DPSNR0 value, which equals the DPSNR value for
iso-preference (MOS=0) between HD and SD. If DPSNR0 is
negative, it means that when users have no preference between HD and SD, the HD sequence contains more artifacts.
Figure 1: ∆PSNR values in function of MOS for Stockholm Pan sequence.
In Table 4, the DPSNR0 and PSNRHD values are
given for each sequence. These values have been obtained by linear interpolation. Some conclusions can be drawn from Figure 1 and Table 4. First, with a decreasing DPSNR, SD is preferred to HD, which is the expected behavior. Then, when HD is compared to SD of a good visual quality (Q80), DPSNR is always negative. This means that HD may contain more distortion and still obtain the same preference level.
Therefore, the impact of the large screen effect is predominant and rules the observer’s preference in this case. On the contrary, when HD is compared to SD of lower but still rather good quality (Q60), this effect decreases and is even reversed in some cases with DPSNR0>0. Distortions in HD become more prevalent and disturbing. Here observers tend to prefer SD implying distortions on a large image is more disturbing than on a small one. In this case, the effect of distortions is predominant over the large image effect.
Sequence Q80 ∆PSNR
0 PSNRHD
New Mobile & Calendar -0.65 37.60
Parkrun -2.65 34.36
Knightshields -0.46 37.81
Stockholm Pan -0.97 37.81
Sequence Q
60 ∆PSNR0 PSNRHD
New Mobile & Calendar 1.27 37.39
Parkrun -0.87 33.23
Knightshields 1.5 37.00
Stockholm Pan -0.43 36.78
Table 4: PSNRHD and DPSNR0 for both SD sequences.
This means that image size is a factor of visual comfort when images are only slightly distorted. But larger image size becomes a drawback when the level of distortions increases. Observers then prefer standard definition, as this reduces the visual impact of the distortions. Therefore HDTV has to reach a high level of quality to be successfully adopted by consumers.
4. IMPACT OF CONTENT ON H264 CODED VIDEO SUBJECTIVE QUALITY
The impact of H.264 artifacts on subjective quality is still under investigation [11]. Many studies exist concerning subjective quality assessment of coding artifacts, most of them consider the influence of several coding artifacts on subjective quality. Farias [12] synthesizes such artifacts in order to apply them independently or combined on isolated regions of the sequence. This is a content-independent approach. Wolff [11] uses sequences distorted through the use of the H.264 coding scheme. Two tasks are then asked of observers. The first is to assess the global annoyance caused by all visible impairments on the entire sequence. The second is to rate the strength of each type of artifact. We propose an alternative methodology: instead of considering different artifacts, H.264 is considered to produce, due to quantization, different perceived annoyance depending on the local spatio-temporal content. Actually, the perception of the distortions strongly depends on the local content of each distorted spatio-temporal region. For example, applying the same quantization error gives particularly visible distortions in
smooth areas, whereas these distortions can be fully masked in highly textured areas. In the same way, quantization produces different results on edges. Therefore, the proposed approach is to distort only selected coherent spatio-temporal regions in terms of type of content with real coding artefacts in order to reflect common broadcasting usage.
4.1. Content classification
Since we need to study the perception of impairments depending on the local spatio-temporal content, several categories of content have to be defined. Each category should correspond to a type of content with a certain spatial activity, so to a certain impact of the H.264 coding artefacts on the perceived quality. We consider five categories defined as follows: smooth areas with low luminance (C1), smooth areas with high luminance (C2), fine textured areas (C3), edges (C4), strong textured areas (C5). In order to obtain sequence per categories, we first apply a segmentation process that creates elementary spatio-temporal volumes, then a classification of each spatio-temporal volume is assigned to its right category.
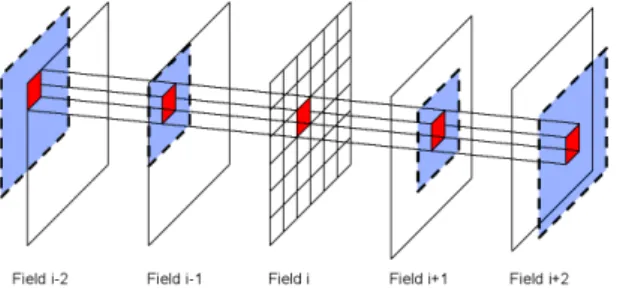
The concept of 2D+t tubes has been introduced by Wolf and Pinson [13] for an objective quality video metric. In Wolf’s approach, tubes are fixed in time while in the proposed approach, they are oriented along the local motion. Consequently, the temporal tubes are coherent in terms of motion and spatial activity. Therefore, the segmentation process is a block-based motion estimation which enables the evolution of spatial blocks to be followed over time. This is performed per group of five consecutive fields of the same parity (odd and even fields). For each group of five fileds, the center field i is divided into blocks and a motion estimation of each block is computed simultaneously using the two previous fields and the two next fields as shown in Figure 2.
Figure 2: Tube creation process over five fields. The second part is the classification itself of the tubes based on a spatial processing. This step uses four spatial gradients (DH, DV, DD45° and DD135° ) computed on every pixel of each tube. Means (DH, DV, DD45° and DD135°) over the tube of the absolute gradients are used in two spatial activity spaces P and P’
in order to label the tube. Both spaces have the same geometric properties as shown in Figure 3. Plane geometry determines the global sequence block classification. Polar coordinates are used for content in order to get most relevant classification for each sequence. P' space is used only for data labelled as C5 in P. Depending on these features, a tube may be labeled as corresponding to a smooth area (C1 or C2 in both planes), a fine textured area (C3 in both planes), a strong textured area (C5 only in P') or an edge (C4 in both planes).
Figure 3: P is the plane allowing block classification.
4.2. Subjective quality assessment
Distorted sequences are generated from the original HDTV sequence, the H.264-distorted sequences at several bitrates and the classification of the original sequence. H.264 coding is performed with the H.264 reference software at High Profile. Several bitrates of H.264-distorted sequences are selected in order to cover a significant range of quality. Parts of the distorted sequence corresponding to a category are inserted in the original sequence. This process creates one sequence per category with one spatio-temporal homogeneous content part distorted.
Subjective quality assessment tests are designed to individually measure the impact of each category on the perceived quality. According to ITU recommandations for the test environment, assessments are performed using the SAMVIQ protocol. The monitor used is a 1920´1080 HDTV 37PF9731D/10 Philips LCD display. Uncompressed 1080i HDTV sequences are played with a Doremi V1-UHD player. The test session for one content at bitrate B is composed of the following sequences: explicit reference (high anchor) ; C1-only distorted sequence at B ; C2-only distorted sequence at B ; C3-only distorted sequence at B ; C4-only distorted sequence at B ; C5-only distorted sequence at B ; entirely distorted sequence at B ; entirely distorted sequence at a low bitrate (low anchor) ; entirely distorted sequence at a third bitrate, corresponding to a quality of 40 or 60 (on a 100 scale), it is defined
depending on B and on the low anchor bitrate ; hidden reference (high anchor).
Height original uncompressed sequences from the Swedish television broadcaster SVT have been used for these tests.
4.3. Results
A Mean Opinion Score, denoted MOSi,j,k, is obtained
for each partly distorted sequence Sj and for each class Ci at each bitrate Bk. Examples of MOSi,j,k are presented
on figure 4. The difference between this partial MOS and the MOS of the original sequence (hidden reference) is called DMOS i,j,k. It indicates the quality
loss induced by the distortions in class Ci. Each distorted class induces a quality loss which is part of the global quality loss of the entirely distorted version compared to the original one. As an attempt to determine a relation between the local DMOS of the classes and the global DMOS, an additive model has been tested. Such a relation would be very useful in order to design an objective quality metric using the presented methodology. Such a metric would evaluate the global quality from classes quality.
Figure 4: MOSi,j,k for sequence Ulriksdals coded at 1
Mbps
The tested relation uses the sum of the DMOS of some or all the classes, without any weights. Table 5 presents the combinations and the associated Correlation Coefficient (CC). For CC < 0.9, only combinations with one category have been kept. These combination results reveal the relative importance of each class in the merging process made by the mean observer. Both combinations with a CC over 0.94 use almost exclusively the categories C2 and C5. Therefore, those two are particularly important in the merging process. Despite its low proportions and single combination correlation (0.5472), the category C4 is present in five of the six first combinations. The distortions on these three categories (one with edges, one with smooth areas and one with textures) are closely related to the global quality of the sequence. At the bottom of the table, single category combinations provide the lowest correlations and the highest errors, revealing that using
only one category is not sufficient to explain the global behaviour. Furthermore, these values confirm the high importance of the category C2 with the highest CC for a single combination (0.7664) and the low importance of C1 and C4 alone. The latter tend to be of importance only combined with other categories.
Despite its simplicity, such an approach provides high correlations with very few strategic categories. Therefore, it is possible to envisage a pooling of the partial qualities of the categories into a global one for the sequence. These combination results reveal the relative importance of each class in the merging process made by the mean observer.
Combination CC C 2+C4+C5 0.9485 C 2+C5 0.9440 C2+C3+C4 0.9094 C 1+C2+C3+C4+C5 0.9058 C 1+C2+C4+C5 0.9052 C2+C3+C4+C5 0.9041 ⋅⋅⋅ ⋅⋅⋅ C 2 0.7664 C 3 0.7094 C5 0.6400 C4 0.5472 C 1 0.5349
Table 5: Combinations of classes ∆MOS and their respective correlation coefficients and RMSE with
DMOS.
5. VISUAL ATTENTION AND SUBJECTIVE QUALITY ASSESSMENT
Visual attention is a main feature of the Human Visual System (HVS). Knowing and using the mechanisms of the visual attention could help to the improvement of image quality assessment methods. For example, an artifact that appears on a region of interest is much more annoying than a degradation appearing on inconspicuous area. This is all the more important as the viewing angle is wider in order to identify which part of the video is exciting fovea and paravovea.
Visual attention involve two processes : the top-down and the bottom-up processes. The bottom-up process is guided by the low-level features of the viewed stimuli, and the top-down process is guided by high level cognitive factors [14]. Which kind of saliency should be taken into account ? A free-task visual selective attention or a quality oriented visual selective
0 10 20 30 40 50 60 70 80 90 1 2 3 4 5
attention. In order to deal with this issue, eye tracking experiments have been conducted both in free-task and in quality-task. We recorded and evaluated the discrepancy between these two types of oculomotor behavior in order to show the impact of the viewing task on visual strategy.
5.1. Eyetracking experiments
In order to track and record real observers eye movements, experiments have been performed with a dual-Purkinje eye tracker from Cambridge Research Corporation. Experiments were conducted in normalized conditions (ITU-R BT 500-10). Image resolution was 512´512. They are displayed at viewing distance of four times the height of the picture. Twenty unpaid subjects participated to the experiments. Two protocols have been used : one for the free viewing task and another one for the picture quality assessment task.
5.1.1. Free viewing task
The free viewing condition is mandatory to lessen the top-down effects. Twenty pictures of various contents have been selected. Ten pictures present numerous artifacts. Each picture was presented to subjects in a free-viewing task during 8s. A gray picture is displayed during 3s between two test pictures. Subjects were instructed to “look around the image”. 5.1.2. quality assessment task
In this experiment, participants have to assess the quality of a picture. The fact that a particular task is assigned will likely alter the oculomotor behavior.
To perform the picture quality evaluation, the standardized method DSIS (Double Stimulus Impairment Scale) is used. In DSIS, each observer views an unimpaired reference picture followed by its impaired version. Observer then rates the impaired pictures using a scale containing 5 scores related to impairments perception between reference and distorted image (from imperceptible to very annoying). The observers were able to give their quality scores with their eyes thanks to an interactive protocol between the display and the eyetracker. Distorted pictures are impaired by a JPEG, JPEG2000 compression or by a blurring filter. 120 impaired pictures are obtained.
5.2. Analysis
5.2.1. Average fixation duration
From the collected data, an average fixation duration is computed for each observer and for each picture. Two fixation phases are temporally separated by a saccade phase. To obtain the average fixation duration for a picture, we work out the average of the average fixation durations per observer for this picture. The average fixation duration can be compared when the following cases are considered:
- the original picture is viewed by observers in a free-task configuration,
- the original picture is viewed by observers in a quality-task configuration. This picture is just displayed before the impaired picture,
- the impaired picture is viewed by observers in a quality-task configuration.
This analysis indicates that the average fixation durations are similar when considering the free-task and the quality-task configuration (with the impaired picture). In this case, the oculomotor behavior is not disturb by the task. It is important to stress that this result does not mean that observers pay attention to the same locations. Considering the quality-task configuration with the original picture, the duration fixations are significantly longer than the previous ones. In this case, the oculomotor behavior is clearly modified. A possible explanation lies in the fact observers endeavor to accurately memorize some parts of the picture. Spatial memory seems here important to achieve the proposed task.
5.2.2. Saliency map
From the collected data, a fixation map is computed for each observer and for each picture. It encodes the saliency degree of each spatial location of the picture. This kind of map is often compared to a landscape map [15] consisting of peaks and valleys. A peak, indicating the number of fixations, represents the observer’s regions of interest. To determine the most visually important regions, all the fixation maps are merged yielding to an average fixation map SM. The average saliency map encodes the most attractive part of a picture when a large panel of observers is considered. Finally, the average saliency map is smoothed with a 2D Gaussian filter, given a density saliency sequence DM
It is possible to test the correspondence between the different saliency density maps, one metric commonly used is the Kullback-Leibler, noted KL, whch assess the degree of dissimilarity that potentially exists between two probability density functions.
5.2.3. Correspondence between the different saliency maps
Figure 5 illustrates the four measures we have done: - test (A), Reference in quality-task versus
reference in free-task: in this first test, we focus on the influence of the task on the oculomotor behavior [16]. Do the observers look at the same area?
- test (B), Reference in quality-task versus first reference in quality-task: the objective here is to show (or not) that observers adapt theirs visual strategies to inspect the original picture in a quality-task. Do they learn something in order to refine their quality judgment?
- test (C), Degraded quality task versus reference free task: it is well known that the task acts on the allocation of attention. But we do not know to what extent a task modify the visual attention. This issue is here tackled by comparing saliency maps coming from a free-task and from a quality-free-task. Moreover, do the artifacts modify the saliency maps?
- test (D), Degraded quality task versus its associated reference quality task: in a DSIS method, is the visual strategy the same for the reference and the impaired pictures?
Results of the two first analysis are displayed on figure 6 whereas the two last analysis are given by figure 7.
Figure 5: This schema summarizes the quantitative analysis that have been performed.
Figure 6: Average Kullback-Leibler divergence computed for each original picture. As shown in figure 3, the KL value is computed on one hand between the density map of the original picture in a quality-task and the density map of the original picture in a free-task, and on the other hand between the density map of original picture in a quality-task and the first density map coming from the first original picture viewed in quality-task.
As expected, the degree of dissimilarity between two saliency maps is important when two different tasks are considered (see figure 6). Second result of figure 6 concerns the adaptation of the visual strategy for a quality task. As observers saw several times the same unimpaired picture, the short term memory and the observers capacities to learn how assessed the picture quality (for example, to assess the picture quality, it is preferable to scan flat areas rather than textured areas)
can likely modified the visual strategy. Although that it was reasonable to think that observers become more and more competitive, the results indicate that this hypothesis is wrong. Both the degree of dissimilarity and the confidence interval are weak.
Figure 7 allows to tackle two points: what are the differences between the free-task and the quality-task when the impaired picture is considered. The second points refers to the similarity of the visual strategy when an unimpaired and impaired pictures are considered. In others words, does an artifact have the capacity to attract or to significantly modify the visual attention? Concerning the first point, results indicates that there exists a significant difference between the visual strategy that is deployed for a free-task and a quality-task (the results of figure 6 are retrieved). Moreover, the confidence intervals are important compared to those of figure 6. It means that the type of degradation (Blur, JPEG, JPEG2000) has a significant influence. Concerning the visual strategy deployed on the unimpaired and the impaired pictures. Results suggest that there is few differences between the two saliency map (stemming from both the unimpaired and the impaired pictures).
Figure 7: Average Kullback-Leibler divergence computed for each original picture, whatever the degradation is. The KL value is computed in on hand between the density map of the degraded picture in a quality-task and the density map of the original picture in a free-task, and in the other hand between the density map of degraded picture in a quality-task and the density map coming from its associated reference picture viewed in quality-task.
6. CONCLUSION
Subjective assessment quality tests have highlighted different behaviour regarding factors that impact on the perceived quality.
Concerning display, loss of quality between perceived quality on CRT and perceived quality on LCD for HD sequences with significant movements has been highlighted. One possible explanation is the motion blur. Since quantity of perceived blur depends on LCD
temporal aperture, display manufacturers try to deal better with this parameter. Nevertheless, their effort will be grateful with respect of an assessment of the perceived quality improvement.
Concerning resolution factor, two important effects have been identified as critical in switching from SDTV to HDTV. Comparison tests highlight that distortions and a larger image both influence the observer’s preference. Results tend to show that distortions are the predominant factor when HDTV sequences are compared with low quality SDTV. However, in the case of high quality SDTV, the image size effect becomes more important.
Concerning content factor, this paper proposed a new methodology to estimate the impact of H.264 artefacts on subjective video quality. Contrary to usual approaches that are artifacts based, the proposed methodology focus on the content. Therefore, to predict the global quality of a sequence, the presented methodology separates it into several content-based categories. It has been shown that it is possible to relate the impact of each of these categories on visual quality with the global quality of the distorted sequence.
Concerning visual attention factor, as we expected, a quality task has a significant effect on eye movements. The first result shows that the fixation duration increased on the unimpaired picture used in a quality-task. It means that observers attempt to memorize some parts of the picture. The second important result concerns the variation of the visual strategy throughout the quality test. We show that observers are not more competitive at the end of test than at the beginning. In other word, there is no visual adaptation or task learning. Finally, it is interesting to note the type of degradation modifies the visual strategy.
Finally, all these factors, and specially resolution and visual attention, point out the gap that is remaining between needs in quality assessment and how far is our knowledge in the process involved in the quality judgment.
10. REFERENCES
[1] Ichiro YUYAMA and Tetsuo MITSUHASHI, “Fundamental requirements for high-definition television systems”, NHK Technical Monograph, June 1982.
[2] ITU-R Questions 95/6, 102/6, “Report on results of comparative subjective picture quality assessment test between CRT and LCD.” ITU, Japan, August 2005.
[3] Taiichiro Kurita, “Moving picture quality improvement for hold-type AM-LCDs,” SID Symposium Digest of Technical Papers, vol. 32, no. 1, pp. 986–989, June 2001.
[4] Xiao-Fan Feng, “LCD motion-blur analysis, perception, and reduction using synchronized backlight flashing,” in Proceedings of the SPIE Conf. Human Vision and Electronic Imaging XI. Electronic Imaging 2006, Janvier 2006, vol. 6057.
[5] Sunkwang Hong, Brian Berkeley, and Sang Soo Kim, “Motion image enhancement of LCDs,” in IEEE International Conference on Image Processing, 2005. ICIP 2005., September 2005, vol. 2, pp. 17–20.
[6] Michiel A. Klompenhouwer and Leo Jan Velthoven, “Motion blur reduction for liquid crystal displays: motion-compensated inverse filtering,” in Proceedings of the SPIE Conf. Visual Communications and Image Processing 2004. Electronic Imaging 2006, January 2004, vol. 5308, pp. 690– 699.
[7] EBU, “SAMVIQ – Subjective assessment methodology for video quality,” Tech. Rep., European Broadcasting Union, 2003.
[8] Jean-Louis Blin, “New quality evaluation method suited to multimedia context: Samviq,” in Proceedings of the Second International Workshop on Video Processing and Quality Metrics, VPQM’06, Scottsdale, January 2006.
[9] ITU-R BT. 500-11, “Methodology for the subjective assessment of the quality of television pictures,” Tech. Rep., International Telecommunication Union, 2004.
[10] ITU-R BT. 710-4, “Subjective assessment methods for image quality in high-definition television,” Tech. Rep., International Telecommunication Union, 1998.
[11] Tobias Wolff, Hsin-Han Ho, John M. Foley, and Sanjit K. Mitra, “H.264 coding artifacts and their relation to perceived annoyance,” in European Signal Processing Conference, 2006. [12] Mylène Farias, No-reference and reduced reference video quality metrics: new contributions, Ph.D. thesis, University of California, 2004.
[13] Stephen Wolf and Margaret H. Pinson, “Spatial-temporal distortion metric for in-service quality monitoring of any digital video system,” in Proc. SPIE, Multimedia Systems and Applications II, 1999, vol. 3845, pp. 266–277.
[14] W. James, “The Principles of Psychology,” Holt, New York, 1890.
[15] D. S. Wooding, “Eye movements of large population : II. Deriving regions of interest, coverage, and similarity using fixation maps,” Behavior Research Methods, Instruments and Computers, vol. 34(4) ,pp. 509–517, 2002.
[16] A. Yarbus, “Eye movements and vision,” L.A. Riggs, Trans., New-york :Plenum Press, 1967.
11. THANKS
Authors would like to thank SVT for the freely available HDTV sequences, Arnaud Tirel, Fabien Beugne and Guillaume Courtin for their assistance in performing the subjective tests, Mathieu Carnec for its assistance concerning the content classification software and Olivier Le Meur for its assistance in the visual attention experiments analysis.