HAL Id: hal-02572089
https://hal.archives-ouvertes.fr/hal-02572089
Submitted on 13 May 2020HAL is a multi-disciplinary open access archive for the deposit and dissemination of sci-entific research documents, whether they are pub-lished or not. The documents may come from
L’archive ouverte pluridisciplinaire HAL, est destinée au dépôt et à la diffusion de documents scientifiques de niveau recherche, publiés ou non, émanant des établissements d’enseignement et de
Thermochromism in Yttrium Iron Garnet Compounds
Hélène Sérier-Brault, Lucile Thibault, Magalie Legrain, Philippe Deniard,
Xavier Rocquefelte, Philippe Leone, Jean-Luc Perillon, Stéphanie Le Bris,
Jean Waku, Stéphane Jobic
To cite this version:
Hélène Sérier-Brault, Lucile Thibault, Magalie Legrain, Philippe Deniard, Xavier Rocquefelte, et al.. Thermochromism in Yttrium Iron Garnet Compounds. Inorganic Chemistry, American Chemical Society, 2014, 53 (23), pp.12378-12383. �10.1021/ic501708b�. �hal-02572089�
Thermochromism in yttrium iron garnet compounds
Hélène Serier-Brault*,†, Lucile Thibault†, Magalie Legrain†, Philippe Deniard†, Xavier
Rocquefelte†, Philippe Leone†, Jean-Luc Perillon#, Stéphanie Le Bris#, Jean Waku#, Stéphane
Jobic*,†.
†
Institut des Matériaux Jean Rouxel, Université de Nantes, CNRS, 2 rue de la Houssinière, BP 32229, 44322 Nantes cedex, France
#
Tefal SA, Chemin des Granges, 74150 Rumilly, France
ABSTRACT
Polycrystalline yttrium iron garnets (Y3Fe5O12) were synthesized by solid-state reaction and
characterized by X-ray diffraction, Mössbauer spectroscopy and UV-vis-NIR diffuse reflectance spectroscopy. The green color of the compounds have been assigned to the presence of a O 2-Fe3+ ligand-to-metal charge transfer together with d-d transitions, the absence of Fe2+ in samples being verified with Mössbauer measurements. By increasing the temperature to around 300°C, the YIG material shows a thermochromic behavior with a continuous color change from greenish to brownish due to a red-shift of the ligand-to-metal charge transfer. Y3Fe5O12 host lattice was
also doped with chromium ions and the same red-shift phenomenon was observed although the effect on the crystal structure is opposite. Indeed, Cr3+ ions were proved to play a major role on the color either by an inductive effect or, more probably, by a direct effect on the electronic structure of the material as discussed in this work.
1. Introduction
Thermochromic inorganic materials change color with a temperature variation (heating or cooling) and offer potentialities for temperature indicators1,2 in different kinds of devices such as temperature sensors for safety (kitchen tools, hotplates, fridges…), laser marking or warning signals. The color change can be brutal or continuous as well as reversible or irreversible according to the involved mechanism. An irreversible color change is mainly associated with a chemical transformation such as decarbonation or dehydratation3 for instance. The application of such materials is a little bit restricted and concerns principally the monitoring of temperature sensitive products whereas the reversible thermochromism is used in much more applications. Each application requests specific characteristics such as color change temperature, color contrast or cyclability, i.e the number of color cycles that can be imposed to the material without any fatigue effect.
For oxide compounds, reversible thermochromism can be explained by a gradual reduction of the semiconductors band-gap4 with a temperature increase (red-shift), or a crystallographic phase transition and/or an insulator/metal transition5–9. The restriction of semiconductors lies in the limited color choice and the likely slight color contrast due to a continuous variation of the color from pale yellow to red. Concerning materials getting phase transition (namely, first order transition), the color contrast can be very pronounced but the volume variation imposed by the structure transition may reduce considerably the material cyclability for an intensive use8. To obtain blue, green or pink color, i.e. a color not accessible with a unique charge transfer, transition metal must be present due to the d-d transitions which mainly occur in the visible region. However, these d-d transitions are less affected by a temperature variation than by the
crystal field. Thus, the solution to obtain a larger panel of colors for thermochromic materials consists in using the mixing rule based on the combination of a semi-conductor material with a d-d transition-based compound. In that case, it is possible to design various reversible thermochromic effects with a control of the temperature transition and the hue of pigment, and a good cyclability. This mixing rule was already discussed in the literature for Bi2O3-CoAl2O4,
Bi2O3-LiCoPO4 and V2O5-Cr2O3 blends10. However, this technique gets some shortcomings
especially concerning the hue of the color which is not saturated enough because of its additive synthesis mechanism.
In this work, instead of mixing two oxides having complementary optical properties, we report the investigation of a well-known compound, the yttrium iron garnet, whose the green color originates from a mixing rule directly within the material. Actually, the green color of the YIG comes from both the combination of d-d transitions and a ligand-to-metal charge transfer with a consequent likely thermochromic behavior. For the first time, the color change of YIG, from green to brown with increasing temperature, is discussed together with the effect of chromium doping on thermochromism.
2. Synthesis and structure characterization of Y3Fe5O12
Yttrium iron garnet (YIG) belongs to the garnet family with the chemical composition {Y3}[Fe23+]a(Fe33+)dO12 and crystallizes in the space group Ia-3d (SG n° 230)11. In this structure,
yttrium ions occupy a dodecahedral site (24c), a represents the octahedral site of Fe3+ions (Wyckoff position 16a) and d the tetrahedral site (Wyckoff position 24d). Each octahedron (tetrahedron) is linked to six (four) others via corner-sharing tetrahedra11,12 (octahedra) to
provide a three-dimension structure. The YIG structure is mainly described in the literature in the cubic space group Ia-3d but Rodic et al13. used the trigonal space group R-3 (SG n°148) to
account for its magnetic behavior. In order to clarify the situation we carried out density functional theory (DFT) calculations using the WIEN2k code14 and the on-site PBE0 hybrid functional15 . Our results show that the magnetic structure described in the space group Ia-3d is more favorable than the one described in the space group R-3, by about 480 meV per formula units. Actually YIG oxide is well-known for its room temperature ferrimagnetic properties that are originated from the antiparallel coupling of the two Fe3+ sublattices (octahedral and tetrahedral). The iron garnet exhibits also magneto-optical, thermal, electrical and mechanical properties such as radiation damage resistance, high thermal conductivity, high electrical resistivity, controllable saturation magnetization and others16.
Conventional high-temperature solid-state reactions were performed to synthesize undoped Y3Fe5O12. The purity of the samples was checked by X-ray diffraction. All patterns were refined
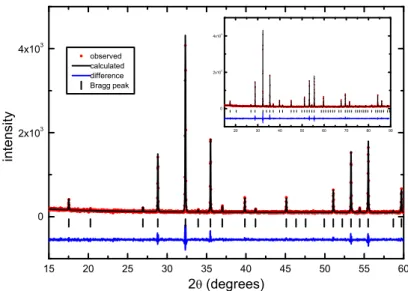
with a cubic structure (JCPDS n° 83-1027), reflecting that the compounds are single-phased. Rietveld refinement were carried out on undoped YIG, as represented in Figure 1, and refined lattice parameter was determined to be equal to 12.3736(5) Å at room temperature, in good agreement with the literature16,17.
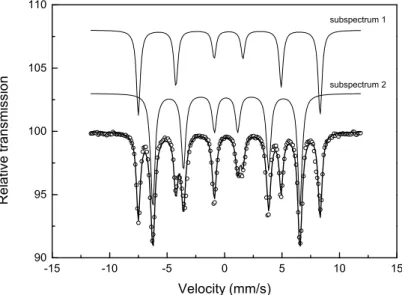
The oxidation state of irons cations were checked by 57Fe Mössbauer analyses at room temperature. The spectrum of the undoped yttrium iron garnet is reported in Figure 2. This is a typical spectrum of single-phase yttrium iron garnet Y3Fe5O1216,18. The obtained data can be fit
with two sextets, the first magnetic sextet (sub-spectrum 1) corresponds to the iron in the octahedral site in the garnet structure with an isomer shift δ of 0.378 mm/s, a magnetic hyperfine field B equal to 49.1 T and a relative intensity I of 60.5%, while the second sextet
(sub-spectrum 2) corresponds to the iron in the tetrahedral site11,12,16 with δ of 0.146 mm/s, BHf equal
to 39.7 T and I of 39,5%. Accounting for Mössbauer analyses, no Fe2+ ions are present in the yttrium iron garnet.
3. Optical properties of Y3Fe5O12: effect of the temperature
Since its discovery in 1956, the optical properties of YIG have been investigated only a few times, mainly by Manning19, Wood20 and Wickersheim21, on single crystals. If it is well-know that YIG materials exhibit a green color, we will discuss in more details the origin of the color in this compound although the presence of Fe3+ ions in oxides mainly leads to red compounds as in Fe2O3, ZnFe2O4 or MgFe2O4 for example22. The assignment of absorption spectra of Fe-based
compounds is relatively difficult for several reasons: 1) the d-d transitions are spin-forbidden and consequently their intensity is expected to be quite weak. However in many oxides the spin rule is not respected because of spin-orbit coupling; 2) theses d-d bands often overlap the charge transfer edge, specially for Fe3+ ions; 3) Fe3+ and Fe2+ often coexist and their d-d bands are localized in the same wavelength range; 4) the simultaneous presence of Fe2+ and Fe3+ can lead to an intervalency phenomenon23. In our compounds, Mössbauer analyses have confirmed the absence of Fe2+ ions and consequently, the color of YIG is originated from the presence of Fe3+ only.
Room temperature optical properties (absorption via Kubelka-Munk transformation) of the undoped YIG sample are reported in the inset of Figure 3. As already notified in the literature19–
21,24
, the optical properties of YIG are originated from the combination of a charge transfer absorption and the Fe3+ d-d transitions. The band gap absorption, located around 485 nm (2.57
eV), is associated to a charge transfer from the 2p orbitals of oxygen to the empty 3d orbitals of Fe3+ ions20,21,25 (O2- + Fe3+ O- + Fe2+). The optical spectrum reveals also different absorption bands due to the d-d transitions of Fe3+ in both tetrahedral and octahedral sites. The bands assignment can be performed from the Tanabe Sugano diagram for the d5 configuration. In the crystal field theory, the ligand field in the tetrahedral coordination being lower than in the octahedral one, we can thus assert that the band located at 900 nm corresponds to the 6A1 4T1
transition of iron ions in the octahedral site19–21,24. Furthermore, the bands located around 600 nm and the shoulder at 700 nm can be assigned to the 6A1 4T2 of Fe3+ ions in the octahedral site
with a contribution of transitions 6A1 4T1, 4T2 for the tetrahedral coordination. In the same
way, a potential contribution of the transition 6A1 4A14E1 cannot be fully ruled out even if
expected at higher energy.
Accounting to the optical measurements, the greenish color of YIG compounds is originated from the slight absorption in the violet range (charge transfer) as well as the presence of d-d transitions in the orange-red region. Consequently, a temperature increase should cause a charge transfer shift associated with the thermal expansion of the unit cell and an increase of metal-oxygen interatomic distances. If the charge transfer shift is large enough, the YIG color can be modified. One can notice that normally the d-d transitions should be almost not affected by a temperature variation10. The thermochromism of undoped YIG was investigated and followed by diffuse reflectance spectroscopy from room temperature to 300°C (Figure 3). As expected, the rise of temperature implies a continuous red-shift of the absorption edge whereas the d-d absorption bands are weakly affected. This regular shift can be explained by a slight elongation of ionic bonds with temperature which is evidenced by an increase of the lattice parameters (Figure 4). The dilatation implies a reduction of the electrostatic interaction of the d electrons
resulting in a lowering of the position of the d6 energy level of Fe2+. Consequently the O2- Fe3+ charge transfer occurs at lower energy. The continuous red-shift is around 0.05 eV/100°C which is quite low compared to the usual shift (0.1 eV/100°C 22) observed in semiconductors such as ZnO, Bi2O3... In order to investigate this aspect from first-principles calculations we have
considered 3 models considering the magnetic structure described in the space group Ia-3d with increasing the a parameter of the cubic unit cell, i.e. [a + 0], [a + 0.1] and [a + 0.2] Å, respectively. We found a linear relationship between the charge transfer band position and the cell parameters showing a redshift of -0.05 eV / 0.1 Å. Although this theoretical shift is too small compared to experiments it provides a qualitative confirmation that the volume expansion leads to a redshift of the charge transfer optical transitions. To illustrate the red-shift, pictures were taken for different temperatures and are reported in Figure 5. Thus the evolution of the charge transfer with the temperature leads to a visible color change. Finally, undoped YIG material exhibits a thermochromic behavior at relatively low temperature with a gradual color change from greenish to brownish.
The originality of this compound lies in the association of a charge transfer located in the violet range with d-d transitions in the visible region which leads to a greenish initial color that is impossible to obtain with only a charge transfer. Furthermore, the color change with temperature is due to the presence of charge transfer only (abrupt threshold moving from 2.52 eV to 2.39 eV) and not to the d-d transitions whose position does not change with temperature. Thus, in this study, instead of combining a semiconductor and a d-d transition based-compound to obtain a new inorganic thermochromic material, we have an original material where the mixing rule occurs10 directly within the same single-phase material.
4. Optical properties of Cr-doped Y3Fe5O12
Y3Fe5O12 compounds were also doped with chromium ions (up to 10 mol.%) and the purity of all
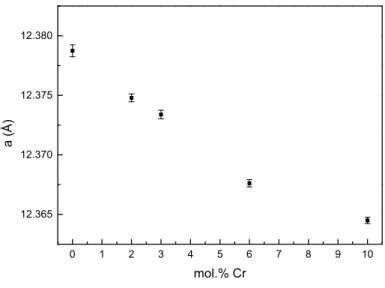
doped samples was checked by X-ray diffraction. In Figure 6 is depicted the variation of the lattice parameters with the chromium content. The unit cell variation can be attributed to the smaller ionic radii of six-fold coordinated Cr3+ (0.61 Å) compared to that of six-fold high spin Fe3+ (0.64 Å)26. This result is in good agreement with literature where the preference of Cr3+ for octahedral site was proved, especially from Mössbauer measurements11,17,27.
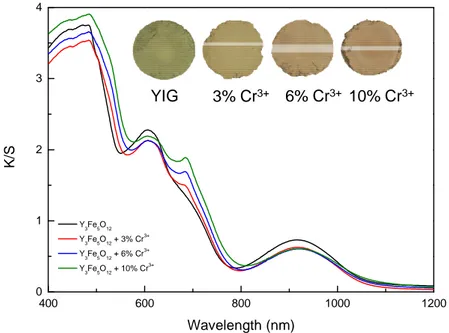
The introduction of chromium cations in the YIG structure leads to a clear color change of the material from greenish to brownish (Figure 7). This color change is very similar to that induced by a temperature increase in YIG although the chromium doping induces a contraction of lattice contrary to the effect of a temperature increase. The optical properties of doped compounds have been also investigated by diffuse reflectance and compared with the undoped sample, all optical spectra being reported in Figure 7. The addition of chromium causes a visible red-shift of the charge transfer, mainly responsible for the color change, and a reinforcement of the d-d transition located at around 700 nm, the others being affected neither in intensity nor in position. The impact of chromium addition on the charge transfer red-shift can be explained according two ways: 1) the Cr3+ gets an inductive effect on the Fe-O bonds and consequently, on the O 2-Fe3+ charge transfer28,29 or 2) the Cr3+ has a direct contribution with the generation of a specific O2- Cr3+ charge transfer.
In the former case, the red-shift can be explained by an inductive effect of the introduction of chromium ions in the host lattice. If we consider the purely ionic model of Brown and Altermatt30 to estimate bond valence, we can assume that the substitution of Fe3+ by Cr3+ in one
octahedron needs an adjustment of bond distances around this octahedron to maintain the ionic bond valence of each ion. Actually, the substitution of one iron ion by a chromium one in a regular FeO6 octahedron (without any change of metal-oxygen bond lengths) leads to a valence
of + 2.70 for Cr to compare with a valence of +3.00 for Fe in the isolated octahedron, which means 10% difference. To counterbalance the valence deviation, metal-oxygen bonds in the octahedron will need to be reduced and will impact the others metal-oxygen bonds (and especially the Fe-O bonds) in the surrounding. Thus, the introduction of many chromium ions would locally create an effect of compression-dilatation of O-Fe bonds within the structure to maintain the ideal valence for all ions, which could explain the red-shift and simulate the effect of temperature.
In the latter case, the red-shift going from undoped Y3Fe5O12 to Cr3+ doped Y3Fe5O12 would be
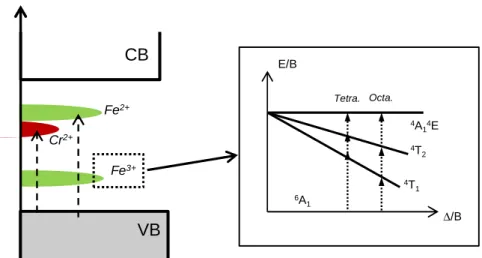
correlated to the appearance of new accessible new electronic states within the forbidden gap that play a major role in absorption phenomena. Actually, the band structure of the YIG can be viewed as built upon a valence band (VB) consisting mainly of O-2p orbitals and a conduction band (CB) consisting of Y-4d orbitals. The Fe-3d levels are located between the VB and the CB (Figure 8) and give rise to absorptions at energy lower than 2.4 eV (d-d transitions) as explained previously (see inset in Figure 8). Charge transfer from oxygen towards iron takes place at higher energy (about 2.4 eV) and is associated to the oxidation of O2- anions into O- ones concomitantly with the reduction of Fe3+ cations into Fe2+ ones, O- and Fe2+ being photogenerated metastable species which recombined instantaneously. Due to strong Coulomb repulsions related to the pairing of two electrons in the same orbital, the 3d6 configuration of Fe2+ cations is expected at much higher energy than the 3d5 configuration of Fe3+ cations, naturally strongly stabilized due to its half-filled sub-shell. When Cr3+ cations substitute Fe3+
ones, extra intrasite d-d transitions occur which may explain the appearance of absorption shoulders and intensity changes in the low energy part of the absorption spectrum (Figure 7). But the Cr3+ d-d transitions overlap with those of Fe3+ and do not modify the hue. In contrast, chromium strongly influences the positioning in energy of the charge transfer. Indeed, the O 2-Cr3+ charge transfer is expected to take place at a lower energy than the O2- Fe3+ one because the 3d4 high spin electronic configuration of Cr2+ ions is expected to lye below the 3d6 high spin configuration of Fe2+ cations31. Consequently, the Cr3+/Fe3+ substitution simulates a temperature increase, the higher the substitution rate, the more red-shifted the charge transfer.
5. Concluding remarks
In that work, we have reported for the first time the reversible thermochromic behavior of the yttrium iron garnet. The intrinsic optical properties of YIG are originated from O2--Fe3+ ligand-to-metal charge transfer together with d-d transitions of Fe3+ ions in octahedral and tetrahedral configuration. By increasing the temperature, the color changes continuously from a greenish to a brownish tone due to a regular red-shift of the absorption threshold associated to the ionic bonds dilatation.
The chromium doping tends to simulate the effect of temperature increase with regular red-shift when raising the Cr3+ content. The role of Cr3+ is explained by a modification of the electronic structure and the apparition of a O2- Cr3+ charge transfer at lower energy than that of O2--Fe3+.
EXPERIMENTAL SECTION
Conventional high-temperature solid-state reactions were performed to synthesize Y3Fe5O12 and
Y3Fe5-xCrxO12 compounds. The constituent oxides Y2O3 (Alfa Aesar, 99.9%), Fe2O3 (Alfa Aesar,
99.945%, <5 µm powder) and Cr2O3 (Alfa Aesar, 99.997%) were used as starting materials. The
raw materials were weighed in stoechiometric proportions and ball milled with ethanol in a Fritsch Pulverisette 7. Then, the blends were dried at 100°C and annealed at 1350°C in air during 6 hour to finally lead to greenish powder. Each powder was ball milled 10 minutes before characterization.
Phase purity and crystal structure were examined by X-ray diffraction (XRD) analysis with a Bruker AXS D8 advanced automatic diffractometer with Cu K-L3 radiation (germanium
monochromator) operating at 40 kV and 40 mA. The XRD patterns were collected in the 10-90 degrees 2θ with a 0.02° step. The structures were refined with the full-matrix least-squares technique using the Jana2006 program32. The errors bars on all parameters were calculated as the following: 3 x the Berar’s33 coefficient x the standard deviation. To record data as a function of temperature, we used a Brüker "D8 Advance" powder diffractometer equipped with an Anton Paar HTK 1200 N high temperature attachment. Data were collected in Bragg-Brentano geometry with a Cu-anode X-ray source (CuK-L2, CuK-L3) operated at 40 kV and 40 mA. We used
a 1-D position-sensitive detector ("Vantec" detector), with an active area restricted to 3° 2θ to improve the angular resolution of XRD patterns. The Cu Kβ radiation was filtered by means of a Ni foil.
Room-temperature UV-visible diffuse reflectance spectra were recorded on a Perkin Elmer Lambda 1050 for each finely ground sample. For room-temperature spectra, the
spectrophotometer was equipped with an integrating sphere coated with Spectralon®, a highly reflecting fluoropolymer. For measurements versus temperature, the spectrometer was fit with a praying mantis accessory. All spectra were recorded between 200 and 1200 nm with 1 nm step. The absorption (α/S) values were calculated from the reflectance using the Kubelka-Munk transformation: α/S = (1-R)²/2R where R is the reflectance at the given wavelength, α is the absorption coefficient, and S is the scattering coefficient. The S value is supposed to be particle size independent when grains size is larger than a few micrometers, as in our case.
Mössbauer spectra were obtained with a constant acceleration automatic folding Elscint-type spectrometer using a room temperature 57Co(Rh) source in transmission geometry and a triangular reference signal. α-Fe was used as reference. The spectra were computed with a least square routine using Lorentzian lines. To obtain an acceptable accuracy, a velocity scale of 11.78 mm/s was used at room temperature.
AUTHOR INFORMATION
Corresponding Author
E-mail: [email protected]; [email protected]
Fax: (+33)240-373-995
REFERENCES
(1) Nassau, K. The Physics and Chemistry of Color; A Wiley-Interscience Publication.; John Wiley & Sons, 1983.
(2) Sone, K.; Fukada, Y. Inorganic Thermochromism; Springer-Verlag, 1923.
(3) Robertson, L.; Gaudon, M.; Pechev, S.; Demourgues, A. J. Mater. Chem. 2012, 22, 3585– 3590.
(4) Eom, S. H.; Kim, D. J.; Yu, Y.-M.; Choi, Y. D. J. Alloys Compd. 2005, 388, 190–194. (5) Gaudon, M.; Carbonera, C.; Thiry, A. E.; Demourgues, A.; Deniard, P.; Payen, C.; Letard,
J.-F.; Jobic, S. Inorg. Chem. 2007, 46, 10200–10207.
(6) Kiri, P.; Hyett, G.; Binions, R. Adv. Mater. Lett. 2010, 1, 86–105.
(7) Robertson, L. C.; Gaudon, M.; Jobic, S.; Deniard, P.; Demourgues, A. Inorg. Chem. 2011,
50, 2878–2884.
(8) Thiry, A.-E.; Gaudon, M.; Payen, C.; Daro, N.; Letard, J.-F.; Gorsse, S.; Deniard, P.; Rocquefelte, X.; Demourgues, A.; Whangbo, M.-H.; Jobic, S. Chem. Mater. 2008, 20, 2075–2077.
(9) Gaudon, M.; Deniard, P.; Demourgues, A.; Thiry, A.-E.; Carbonera, C.; Le Nestour, A.; Largeteau, A.; Letard, J.-F.; Jobic, S. Adv. Mater. Weinh. Ger. 2007, 19, 3517–3519. (10) Gaudon, M.; Deniard, P.; Voisin, L.; Lacombe, G.; Darnat, F.; Demourgues, A.; Perillon,
J.-L.; Jobic, S. Dyes Pigments 2012, 95, 344–350.
(11) Bouziane, K.; Yousif, A.; Widatallah, H. M.; Amighian, J. J. Magn. Magn. Mater. 2008,
320, 2330–2334.
(12) Cheng, Z.; Cui, Y.; Yang, H.; Chen, Y. J. Nanoparticle Res. 2009, 11, 1185–1192.
(13) Rodic, D.; Mitric, M.; Tellgren, R.; Rundlof, H.; Kremenovic, A. J. Magn. Magn. Mater.
1999, 191, 137–145.
(14) Blaha, P.; Schwarz, K.; Kvasnicka, D.; Luitz, J. WIEN2k: An Augmented Plane Wave+LO
Program for Calculating Crystal Properties; Techn. Universität Wien.; Vienna, 2001.
(15) Perdew, J. P.; Ernzerhof, M.; Burke, K. J. Chem. Phys. 1996, 105, 9982–9985.
(16) Garskaite, E.; Gibson, K.; Leleckaite, A.; Glaser, J.; Niznansky, D.; Kareiva, A.; Meyer, H.-J. Chem. Phys. 2006, 323, 204–210.
(17) Murumkar, V. D.; Modi, K. B.; Jadhav, K. M.; Bichile, G. K.; Kulkarni, R. G. Mater. Lett.
(18) Waerenborgh, J. C.; Rojas, D. P.; Shaula, A. L.; Kharton, V. V.; Marques, F. M. B. Mater.
Lett. 2004, 58, 3432–3436.
(19) Manning, P. G. Can. Mineral. 1972, 11, 826–839.
(20) Wood, D. L.; Remeika, J. P. J. Appl. Phys. 1967, 38, 1038–1045. (21) Wickersheim, K. A.; Lefever, R. A. J. Chem. Phys. 1962, 36, 844–850.
(22) Pailhe, N.; Wattiaux, A.; Gaudon, M.; Demourgues, A. J. Solid State Chem. 2008, 181, 1040–1047.
(23) Marfunin, A. S. Physics of Minerals and Inorganic Materials; Springer-Verlag, 1979. (24) Wemple, S. H.; Blank, S. L.; Seman, J. A.; Biolsi, W. A. Phys. Rev. B Solid State 1974, 9,
2134–2144.
(25) Grant, P. M.; Ruppel, W. Solid State Commun. 1967, 5, 543–546. (26) Shannon, R. D.; Prewitt, C. T. Acta Crystallogr. B 1969, 25, 925–946.
(27) Kuznetsov, M. V.; Pankhurst, Q. A.; Parkin, I. P.; Affleck, L.; Morozov, Y. G. J. Mater.
Chem. 2000, 10, 755–760.
(28) Etourneau, J.; Portier, J.; Menil, F. J. Alloys Compd. 1992, 188, 1–7.
(29) Gauthier, G.; Jobic, S.; Boucher, F.; Macaudiere, P.; Huguenin, D.; Rouxel, J.; Brec, R.
Chem. Mater. 1998, 10, 2341–2347.
(30) Brown, I. D.; Altermatt, D. Acta Crystallogr. B 1985, B41, 244–247.
(31) Orofino, H.; Machado, S. P.; Faria, R. B. Quimica Nova 2013, 36, 894–896.
(32) Petricek, V.; Dusek, M.; Palatinus, L. The Crystallographic Computing System JANA,
2006 Beta; 2006.
FIGURES CAPTION
Figure 1. Rietveld refinement of the powder diffraction data of undoped YIG at room
temperature. The space group Ia-3d was used for the structural model.
Figure 2. Mössbauer spectrum of Y3Fe5O12. Experimental data are represented with open circles
and calculated spectrum is represented with black line. The sub-spectra 1 and 2 correspond to the octahedral site (δ = 0.378 mm/s, BHf = 49.1 T, I = 60.5%) and the tetrahedral site (δ = 0.156
mm/s, BHf = 39.7 T, I = 39.5%), respectively.
Figure 3. Kubelka-Munk transformed reflectivity vs wavelength of undoped Y3Fe5O12 at room
temperature (inset) and in temperature.
Figure 4. Evolution of refined lattice parameters of Y3Fe5O12 with temperature.
Figure 5. Photographs of undoped YIG at different temperatures (The temperature
measurements have been carried out with an optical pyrometer).
Figure 6. Variation of the lattice parameters of Y3Fe5O12:x% Cr with the molar percentage of
chromium.
Figure 7. Room-temperature α/S spectrum (Kubelka-Munk transformation) of undoped YIG and Cr3+-doped YIG and photographs of the evolution of room-temperature color with introduction of Cr3+ ions in the YIG structure.
Figure 8. Schematic band structure of YIG when doped with chromium ions and Tanabe-Sugano
Figure 1 15 20 25 30 35 40 45 50 55 60 0 2x10 3 4x10 3 20 30 40 50 60 70 80 90 0 2x10 3 4x10 observ ed calculated difference Bragg peak i n t e n si t y 2 (degrees)
Figure 2 -15 -10 -5 0 5 10 15 90 95 100 105 110 subspectrum 2 R e l a t i v e t r a n s m i s s i o n Velocity (mm/s) subspectrum 1
Figure 3 400 500 600 700 800 0 10 20 30 40 50 60 α /S Wavelength (nm) RT 100°C 150°C 200°C 250°C 300°C T 6A 1 4T 2 6A 1 4T 1, 4T 2 6 A1 4 T1 400 600 800 1000 0 2 4 [6] [4] Room temperature α /S Wavelength (nm) Charge transfer [6]
Figure 4 0 50 100 150 200 250 12.375 12.380 12.385 12.390 12.395 12.400 12.405 12.410 a ( Å ) T emperature (°C)
Figure 6 0 1 2 3 4 5 6 7 8 9 10 12.365 12.370 12.375 12.380 a ( Å ) mol.% Cr
Figure 7 YIG 3% Cr3+ 6% Cr3+ 10% Cr3+ 400 600 800 1000 1200 0 1 2 3 4 Y3Fe5O12 Y3Fe5O12 + 3% Cr3+ Y3Fe5O12 + 6% Cr3+ Y3Fe5O12 + 10% Cr 3+ K /S Wavelength (nm)
Figure 8 E/B ∆/B 6A 1 4T 1 4T 2 4A 14E Tetra. Octa. CB VB Fe3+ Cr2+ Fe2+
Table of Contents Synopsis
The effect of temperature increase on the optical properties of yttrium iron garnet has been investigated by diffuse reflectance. This work evidences a sample color change from green to brown by applying a temperature variation. This color change originates from a continuous red-shift of the O2--Fe3+ ligand-to-metal charge transfer whereas no impact on the d-d transition is observed. Furthermore, the samples have been doped with Cr3+ ions and the introduction of chromium cations has the same effect than a temperature increase although its effect on the crystal structure is opposite.
Synopsis Artwork 25°C
![Figure 3 400500600 700 8000102030405060α/SWavelength (nm) RT 100°C 150°C 200°C 250°C 300°CT6A1 4T26A1 4T1, 4T26A1 4T1400600800 1000024[6][4] Room temperatureα/SWavelength (nm)Charge transfer[6]](https://thumb-eu.123doks.com/thumbv2/123doknet/8272032.278517/19.892.283.615.156.402/figure-swavelength-rt-room-temperatureα-swavelength-charge-transfer.webp)