HAL Id: hal-00789082
https://hal.archives-ouvertes.fr/hal-00789082
Submitted on 15 Feb 2013
HAL is a multi-disciplinary open access
archive for the deposit and dissemination of sci-entific research documents, whether they are pub-lished or not. The documents may come from teaching and research institutions in France or abroad, or from public or private research centers.
L’archive ouverte pluridisciplinaire HAL, est destinée au dépôt et à la diffusion de documents scientifiques de niveau recherche, publiés ou non, émanant des établissements d’enseignement et de recherche français ou étrangers, des laboratoires publics ou privés.
Stereoscopic 3D video coding quality evaluation with 2D
objective metrics
Kun Wang, Kjell Brunnström, Marcus Barkowsky, Matthieu Urvoy, Marten
Sjöström, Patrick Le Callet, Sylvain Tourancheau, Borje Andrén
To cite this version:
Kun Wang, Kjell Brunnström, Marcus Barkowsky, Matthieu Urvoy, Marten Sjöström, et al.. Stereo-scopic 3D video coding quality evaluation with 2D objective metrics. SPIE Electronic Imaging 2013, Feb 2013, San franscisco, United States. pp.1-7, �10.1117/12.2003664�. �hal-00789082�
Updated 1 March 2012
Stereoscopic 3D video coding quality evaluation with 2D objective
metrics
K. Wang
1,3, K. Brunnström
1,3, M. Barkowsky
2, M. Urvoy
2, M.Sjöström
3, P. Le Callet
2, S.
Touranchean
3, B. Andrén
11. Dept. of NetLab: Visual Media Quality, Swedish ICT-Acreo AB, Sweden
2. Dept. of Image and Video Communication, IRCCyN, University of Nantes, France
3. Dept. of Information Technology and Media (ITM), Mid Sweden University, Sweden
ABSTRACT
The 3D video quality is of highest importance for the adoption of a new technology from a user’s point of view. In this paper we evaluated the impact of coding artefacts on stereoscopic 3D video quality by making use of several existing full reference 2D objective metrics. We analyzed the performance of objective metrics by comparing to the results of subjective experiment. The results show that pixel based Visual Information Fidelity metrics fits subjective data the best. The 2D stereoscopic video quality seems to have dominant impact on the coding artefacts impaired stereoscopic videos.
Keywords: 3D, stereoscopic, video quality, objective metrics
1. INTRODUCTION
With the increasing interest in stereoscopic technology, driven by the entertainment, scientific, and industrial applications, 3D videos have become more and more popular nowadays. It is necessary to define standardized protocols to assess the perceived quality of 3D videos.
The perceived video quality is of highest importance for the adoption of a new technology from a user’s point of view and thus, consequently, from an industry perspective. Subjective assessment is commonly used to measure users’ quality experience. Subjective tests are performed in order to obtain accurate and reliable quality evaluations, however the use of subjective tests is time consuming and expensive. Therefore objective quality metrics, a fast and automatic way of measure or predict video or image quality according to image physical characteristics, is highly desired. For 2D videos a great effort has been done on developing objective models see e.g.[1]. There are some studies on the evaluation of Stereoscopic 3D (S3D) images with existing 2D quality metrics [2][3], however for S3D videos the objective quality metrics are still not widely studied.
The objective of this paper is to evaluate S3D quality by making use of several existing 2D objective metrics, and compare whether they are suitable for stereoscopic images. Coding artefacts and spatial down-sampling are main quality degradation artefacts considered. The results from objective metrics are compared with subjective experiment results of the same video database that had been prepared in previous work [4][5][6].
The paper is organized as follows: Section 2 gives a brief introduction of the video sets used for the quality assessment, and the method for objective quality assessment. The performance of different quality metrics is compared and evaluated in Section3. Section 4 discusses the general 3D video quality based on the objective metrics results. Conclusions are drawn in section 5.
2. METHOD
2.1 Video database and Subjective test
Stereoscopic 3D videos used in this paper are based on the same video set prepared in previous work [4][5][6]. In total, 11 source stereoscopic video sequences (SRC) were extracted out of 7 different longer video clips as TABLE I shows. Each SRC is about 10 seconds long, covered from low motion and low detail through high motion and high detail content. The left and right views of the stereoscopic 3D videos are in their original resolution. Several different video processing scenarios, called Hypothetical Reference Circuits (HRC) according to the terminology of the VQEG [7][8]
Updated 1 March 2012
were used in creating the Processed Video Sequences (PVS). In this paper we focus on the coding and spatial down-sampling effects on the S3D video quality, therefore the selected SRC and HRCs are listed in TABLE II. The 3D quality of experience of this video set had been evaluated by human subjects in several subjective experiments [4][5]. Users’ 3D experience were recorded with mean opinion score (MOS), and additional subjective visual comfort of every watched S3D videos as a second scale.
2.2 Objective measurement
In this paper we have investigated the performance of three 2D quality metrics for S3D quality assessment: Peak Signal-to-Noise Ratio (PSNR) [9][10], Single-scale Structural SIMilarity (SSIM) [11], Visual Information Fidelity (VIFP) [12] pixel based version. The PSNR and SSIM are widely used for objective image and video quality assessment in many publications, we selected them for references.
Figure 1 Follow chart of objective quality assessment for stereoscopic 3D video,
TABLE II
LIST OF PROCESSING CONDITIONS (HRC) HRC Nr. Encode QP Process Type
1 - Ref. 3D 2 26 (H.264) - 3 32 (H.264) - 4 38 (H.264) - 5 44 (H.264) - 107 26 (H.264) Res./4 108 26 (H.264) Res./16 TABLEI
SOURCE VIDEO SEQUENCES IN CODING EXPERIMENT
SR C Nr. Resolution Frame rate Description 1 1920x1080p 25 Hz Macro-Recording, time-lapse, surprising motion
2 1920x1080p 25 Hz Car racing preparation, high detail, colorful
3 1920x1080p 25 Hz Car race, high motion, large depth range
4 1920x1080p 25 Hz Animation, human characters, rare colors
5 1920x1080p 24 Hz Mesh grid rendering, high detail, small depth range 6 1920x1080p 24 Hz Rendered transparent glass
ball, circular motion 7 1280x720p 25 Hz Group of parachutists,
unsteady camera, flapping clothes
8 1440x1080p 25 Hz Market place with groups of people, skin colors 9 1024x576p 25 Hz Night scene, fireworks, large
depth effects, sudden motion 10 1024x576p 25 Hz Uphill hiking group, natural
colors, highly detailed trees 11* 1920x1080p 25 Hz Macro-Recording, time-lapse,
Updated 1 March 2012
Figure 1 shows a flow chart of objective quality assessment for stereoscopic 3D videos based on the model described in [3]. The full reference model has been applied on each view of stereoscopic videos separately, and calculated frame by frame. The software implementation of above mentioned three objective metrics are from MeTriX MuX Visual Quality Assessment Package [13]. A depth map was generated from a pair of left and right views using a disparity estimation algorithm [14]. Depth map generation was done at IRCCyN lab, University of Nantes. Examples of depth map are show in Figure 2. The (a) figure shows the left view from undistorted reference video frame. The depth map extracted from the reference frame pair is shown in (b). The (c) figure shows the depth map extracted from a heavily compressed (Quantification parameter 44) stereopair.
(a) (b)
(c)
Figure 2 An example of video frame and depth map. (a) left view frame of a reference video, (b) depth map extracted from the reference stereopair. (c) depth map extracted from QP44 coded stereopair. The positive values (brighter part) in the depth map refer to uncrossed disparities, and the negative values are crossed disparities.
Since the individual left and right views in fact are 2D videos, the full reference 2D quality models are directly applied on each view of the stereoscopic video pair. Then the general 2D video quality of two views can be combined together by the first pooling function in the Figure 1. The S3D videos included in this paper were symmetric encoded for both left and right channel with H.264 simulcast coding. The quality metrics results of two individual views also show a high correlation coefficient (0.99). Therefore we averaged the left and right view scores and take the mean value as the overall stereoscopic video pair quality. However if other coding schemes had been applied, e.g. Multi-view coding (MVC) or asymmetric coding, we would have explored other pooling functions as well.
In order to obtain final general 3D quality estimation from the metrics, the second pooling function handles the combination of depth map quality and the stereoscopic pair video quality produced by the first pooling process. In this paper we reused the pooling function (formula 1 and 2) suggested in [3] as a reference.
3 _1 ∗ (1)
Updated 1 March 2012
3. OBJECTIVE METRICS PERFORMANCE ANALYSIS
We evaluated the performance of the objective metrics according to evaluation criteria from VQEG [8].Firstly, based on the Mean Opinion Score (MOS) obtained from the subjective experiments, Differential Mean Opinion Score (DMOS) is computed according to (3).
5 (3)
Secondly, objective scores were mapped to the same scale as the subjective DMOS by a non-linear mapping function. We used a monotonic cubic polynomial function (4) as suggested in [8], where the “x” is the original scores computed by objective metrics, and “DMOSp” is the objective score mapped to the subjective DMOS scale. “a,b,c,d” are the coefficients of the mapping function.
(4)
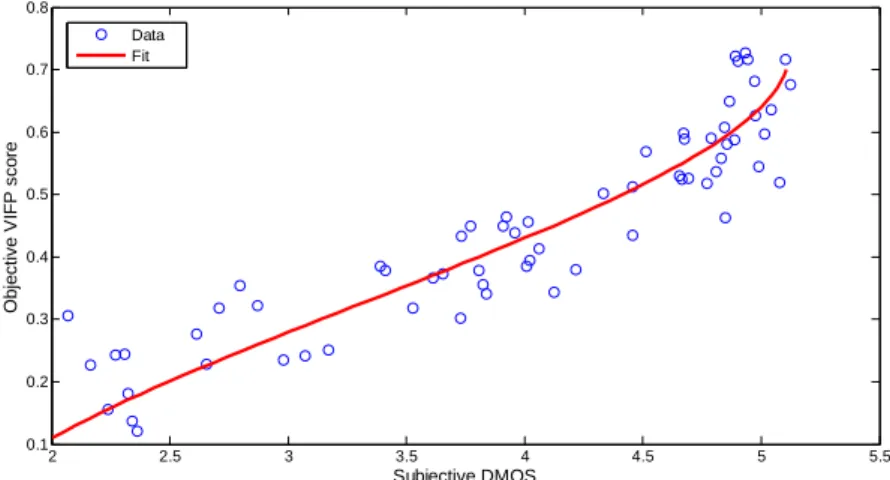
Figure 3 shows the nonlinear fitting function (red line) maps the results from VIFP objective metrics to subjective DMOS scale. The blue circles present the score of the PVS in both subjective DMOS scale (X axis) and VIFP scale (Y axis).
Figure 3 a nonlinear mapping function (red line) for VIFP objective metrics, the coefficients of the function are: a=-14; b=13.8; c=2.2; d=1.6. * some of the subjective DMOS data are larger than 5, that is due to the process of cross-lab and cross-experiemnt integration of several subjective tests results, the detailed information can be found in [6].
TABLE III shows the objective metrics results of SRC02 video. The left table shows the original score estimated by the objective metrics, and right table shows the mapped results after applying the monotonic polynomial function.
TABLE III objective scores, original (left), and mapped to subjective DMOS scale (right)
We evaluated the objective metrics performance with root mean square error (RMSE) and Pearson correlation coefficient as shown in TABLE IV. When comparing the predicted stereoscopic pair quality from objective metrics to subjective DMOS value, we see the VIFP metrics gives highest Pearson correlation and lowest RMSE.
2 2.5 3 3.5 4 4.5 5 5.5 0.1 0.2 0.3 0.4 0.5 0.6 0.7 0.8 Subjective DMOS O b je ct ive V IF P s c o re Data Fit SRC02 original score HRC02 HRC03 HRC04 HRC05 HRC107 HRC108 PSNR 43.38 39.39 35.11 31.29 37.58 31.70 SSIM 0.98 0.97 0.94 0.91 0.96 0.91 VIFP 0.71 0.58 0.44 0.31 0.58 0.39 SRC02 maped to DMOS HRC02 HRC03 HRC04 HRC05 HRC107 HRC108 PSNR 5.15 4.22 3.67 3.46 3.93 3.48 SSIM 4.10 4.08 4.08 4.07 4.08 4.07 VIFP 5.12 4.84 4.12 3.26 4.83 3.77 subjective DMOS 4.94 4.79 3.77 2.71 4.89 4.02
Updated 1 March 2012
TABLE IV Pearson correlation and RMSE of objective models
The statistical significance of the difference among three objective metrics was further tested according to formula (5) described in [8].
1 2
(5) where Pearson correlation was transformed to normally distributed Fisher’s Z distribution. Z1 and Z2 are the Z distribution of the compared two correlation coefficients. σ is standard deviation of the Fisher’s Z statistic.
Figure 4 Fish Z transform of correlation coefficient
Figure 4 shows the Fisher’s Z transform of the correlation coefficient in TABLE IV. The results show that VIFP’s Pearson correlation with the subjective scores was significantly different or higher than PSNR and SSIM for both stereoscopic pair quality and depth map quality. The 95% Student-t value is t(0.05)=1.96, the Zn value was 5.2 for the stereoscopic pair difference between VIFP and PSNR, and for the difference between VIFP and SSIM the Zn was 7. Comparing SSIM to PSNR, no statistical significant differences were found.
4. ASSESMENT OF GENERAL S3D VIDEO QUALITY
According to the results from the objective metrics analysis we select VIFP for both stereoscopic pair quality and the depth map quality estimation. The general 3D quality is calculated by combining stereoscopic pair video quality and depth quality as the 2nd pooling process described in Figure 1. The results are shown in TABLE V.
TABLE V Correlation between subjective 3D quality and objective metrics estimated 3D quality
Correlation to DMOS Stereopair quality Depth quality General 3D_1 General 3D_2
VIFP 0.94 0.84 0.93 0.92
By pooling the depth map quality and the stereopair quality together, the general 3D quality prediction from objective metrics did not really improve. The correlation coefficient after pooling were 0.93 and 0.92 for two pooling function (formula 1 and 2) respectively. They are close to the 0.94 that the pure stereoscopic video pair gives. Therefore in this study the 2D video quality of the stereoscopic pair seems dominant in the overall 3D quality estimation. There could be many reasons for that:
1. Mapping function (formula 4): The stereoscopic pair quality estimation from 2D objective metrics are based on the 2D videos (individual left and right view videos), however the non-linear mapping from objective scores to the subjective data were optimized for 3D DMOS scale where depth quality were considered by subjects in some extend.
Pearson Correlation PSNR SSIM VIFP DMOS vs Stereopair quality 0.65 0.42 0.94
DMOS vs Depth quality 0.43 0.53 0.84
RMSE PSNR SSIM VIFP
DMOS vs Stereopair quality 0.74 0.88 0.34 DMOS vs Depth quality 0.87 0.82 0.53 0.00 0.50 1.00 1.50 2.00 2.50 PSNR SSIM VIFP DMOS_L/R DMOS_depth
Updated 1 March 2012
2. Subjective data: we used the “general 3D quality experience” scale to collect the scores from subjects for the overall 3D user experience. The depth quality and 2D video quality are considered by the subjects as a part of their evaluation criteria. However, it is not clear to us how much weight the 2D video quality and how much weight the depth quality or other perceptual attributes are given by the subjects when evaluating their “3D experience”
3. Pooling function: the function for combining 2D stereoscopic quality and depth quality is experimental, future research are required in developing reliable pooling functions.
4. Video degradation type: Only coding and spatial down-sampling artefacts are included in this work, the coding artefacts might have more impact on degrading 2D image quality than on depth information.
5. Depth map: firstly estimating the 3D quality may require more accurate depth maps, secondly applying 2D metrics to the depth maps may not be suitable (e.g. they do not take into account the stereo-acuity, binocular rivalry effects, etc).
5.
CONCLUSION
In this paper, the impact of coding artefacts on stereoscopic 3D video quality has been evaluated with three 2D objective metrics. The objective evaluation of the S3D video quality has been divided into two parts: stereoscopic 2D video quality and depth map quality. The results show that only the VIFP results were highly correlated with subjective data among selected objective metrics. The 2D stereoscopic video quality seems to be a dominant factor in the overall 3D quality estimation. The depth map quality has less impact on the general S3D quality with coding impairment. However this finding might only applies with respect to the proposed metrics. The future work will focus on the improvement of pooling functions and mapping function from objective metrics to subjective data.
6. ACKNOWLEGEMENT
This work has been partly financed by VINNOVA (The Swedish Governmental Agency for Innovation Systems). The participation of the observers is gratefully acknowledged.
REFERENCES
[1] Sheikh, H. R., Sabir, M. F., and Bovik, A. C., “A statistical evaluation of recent full reference image quality assessment algorithms,” IEEE Trans. Image Processing, 15(11), pp. 3440-3451, Nov. 2006.
[2] Campisi, P., Le Callet, P., and Marini, E., “Stereoscopic imagesquality assessment,” in Proceedings of 15th European Sig-nal Processing Conference (EUSIPCO ’07), Poznan, Poland,September 2007.
[3] A. Benoit, P.L. Callet, P. Campisi, et al., “Quality assessment of stereoscopic images,” EURASIP Journal Image and Video Processing, 2008
[4] Barkowsky, M., Wang, K., Cousseau, R., Brunnstrom, K., Olsson, R., and Le Callet, P., "Subjective quality assessment of error concealment strategies for 3DTV in the presence of asymmetric transmission errors." Packet Video Workshop (PV), 2010 18th International. IEEE, (2010).
[5] Wang, K., Barkowsky, M., Cousseau, R., Brunnström, K., Olsson, R., Le Callet, P., and Sjöström, M., "Subjective evaluation of HDTV stereoscopic videos in IPTV scenarios using absolute category rating", Proc. SPIE 7863, 78631T (2011).
[6] Wang, K., Barkowsky, M., Brunnström, K., Sjöström, M., Cousseau, R., and Le Callet, P., "Perceived 3D TV Transmission Quality Assessment: Multi-Laboratory Results Using Absolute Category Rating on Quality of Experience Scale," Broadcasting, IEEE Transactions on , vol.58, no.4, pp.544-557, Dec. 2012
[7] Cermak, G., L. Thorpe and M. Pinson;"Test Plan for Evaluation of Video Quality Models for Use with High Definition TV Content", Video Quality Experts Group (VQEG), (2009).
Updated 1 March 2012
[8] Cermak, G., Brunnström, K., Hands, D.: P., Margaret, Speranza, F., & Webster, A. (Eds.). (2008). Final Report from the Video Quality Experts Group on the Validation of Objective Models of Multimedia Quality. Video Quality Experts Group.
[9] Girod,B., “What’s wrong with mean-squared error” . Digital images and human vision. MIT press, 1993. pp. 207-220.
[10] Wang, Z. and Bovik, A. C., “Mean squared error: love it or leave it? - A new look at signal fidelity measures”, IEEE Signal Processing Magazine, vol. 26,no. 1, pp. 98-117, Jan. 2009.
[11] Wang, Z., Lu, L. and Bovik, A. C., “Video quality assessment using structural distortion measurement,” Signal Processing: Image Communication, vol. 19, no. 2, pp. 121-132, 2004.
[12] Sheikh, H. R., and Bovik, A. C., “Image information and visual quality,” Image Processing, IEEE Transactions on, vol. 15, no. 2, pp. 430–444, 2006.
[13] Chandler, D.M., and Hemami, S.S., “MeTriX MuX Visual Quality Assessment Package.” http://foulard.ece.cornell.edu/gaubatz/metrix mux/ (2007).
[14] Urvoy, M., Gutiérrez, J., Barkowsky, M., Cousseau, R., Koudota, Y., Ricordel, V., and Le Callet, P., "Subjective video quality assessment database on coding conditions introducing freely available high quality 3D stereoscopic sequences", Proc. Fourth International Workshop on Quality of Multimedia Experience, Yarra Valley, (2012)

![Figure 1 shows a flow chart of objective quality assessment for stereoscopic 3D videos based on the model described in [3]](https://thumb-eu.123doks.com/thumbv2/123doknet/8181674.274669/4.892.117.779.272.700/figure-shows-objective-quality-assessment-stereoscopic-videos-described.webp)