Titre: Title:
On the application of minimum noise tracking to cancel cosine shaped residual noise
Auteurs:
Authors: Abdelaziz Trabelsi, François-Raymond Boyer et Yvon Savaria Date: 2006
Type: Rapport / Report Référence:
Citation:
Trabelsi, A., Boyer, F.-R. & Savaria, Y. (2006). On the application of minimum
noise tracking to cancel cosine shaped residual noise (Rapport technique n°
EPM-RT-2006-09).
Document en libre accès dans PolyPublie Open Access document in PolyPublie
URL de PolyPublie:
PolyPublie URL: https://publications.polymtl.ca/3157/
Version: Version officielle de l'éditeur / Published versionNon révisé par les pairs / Unrefereed Conditions d’utilisation:
Terms of Use: Tous droits réservés / All rights reserved
Document publié chez l’éditeur officiel Document issued by the official publisher
Maison d’édition:
Publisher: Les Éditions de l’École Polytechnique
URL officiel:
Official URL: https://publications.polymtl.ca/3157/
Mention légale:
Legal notice: Tous droits réservés / All rights reserved
Ce fichier a été téléchargé à partir de PolyPublie, le dépôt institutionnel de Polytechnique Montréal
This file has been downloaded from PolyPublie, the institutional repository of Polytechnique Montréal
EPM–RT–2006-09
ON THE APPLICATION OF MINIMUM NOISE TRACKING TO CANCEL COSINE SHAPED RESIDUAL NOISE
Abdelaziz Trabelsi, François-R Boyer, Yvon Savaria Département de Génie informatique
Département de génie électrique École Polytechnique de Montréal
EPM-RT-2006-09
On the Application of Minimum Noise Tracking
to Cancel Cosine Shaped Residual Noise
Abdelaziz Trabelsi
, François-R Boyer
, Yvon Savaria
Département de génie informatique
Département de génie électrique
École Polytechnique de Montréal
©2006
Abdelaziz Trabelsi, François-R Boyer, Yvon Savaria Tous droits réservés
Dépôt légal :
Bibliothèque nationale du Québec, 2006 Bibliothèque nationale du Canada, 2006
EPM-RT-2006-09
On the Application of Minimum Noise Tracking to Cancel Cosine Shaped Residual Noise par : Abdelaziz Trabelsi, François-R Boyer, Yvon Savaria
Département de génie informatique École Polytechnique de Montréal
Toute reproduction de ce document à des fins d'étude personnelle ou de recherche est autorisée à la condition que la citation ci-dessus y soit mentionnée.
Tout autre usage doit faire l'objet d'une autorisation écrite des auteurs. Les demandes peuvent être adressées directement aux auteurs (consulter le bottin sur le site
http://www.polymtl.ca/) ou par l'entremise de la Bibliothèque : École Polytechnique de Montréal
Bibliothèque – Service de fourniture de documents Case postale 6079, Succursale «Centre-Ville» Montréal (Québec)
Canada H3C 3A7
Téléphone : (514) 340-4846
Télécopie : (514) 340-4026
Courrier électronique : biblio.sfd@courriel.polymtl.ca
Ce rapport technique peut-être repéré par auteur et par titre dans le catalogue de la Bibliothèque : http://www.polymtl.ca/biblio/catalogue/
RÉSUMÉ
It has been shown recently that for coherence based dual microphone array speech enhancement systems, cross-spectral subtraction is an efficient technique aimed to reduce the correlated noise components. The zero-phase filtering criterion employed in these methods is derived from the standard coherence function that is modified to incorporate the noise cross power spectrum between the two channels. However, there has been limited success at applying coherence based filters when speech processing is carried out under relatively harsh acoustic conditions (SNR below -5 dB) or when the speech and noise sources are closely spaced. We propose an alternative method that is effective, and that attempts to use a phase-based filtering criterion by substituting the cross power spectrum of the noisy signals received on the two channels by its real part. Then, a variant of the running minimum noise tracking procedure is applied on the estimated speech spectrum as an adaptive postfiltering to reduce the cosine shaped power spectrum of the remaining residual musical noise to a minimum spectral floor. Using that adaptive postfilter, a soft-decision scheme is implemented to control the amount of noise suppression. Our preliminary results based on experiments conducted on real speech signals show an improved performance of the proposed method over the coherence based approaches. These results also show that it performs well on speech while producing less spectral distortion even in severe noisy conditions.
On the Application of Minimum Noise Tracking
to Cancel Cosine Shaped Residual Noise
A. Trabelsi, F.R. Boyer, and Y. Savaria
Departments of computer and electrical engineering Ecole Polytechnique de Montreal
C.P.6079, Succ. Centre-Ville, Montreal, Quebec, Canada, H3C 3J7 { Abdelaziz.Trabelsi, Francois-R.Boyer, Yvon.Savaria }@PolyMtl.ca
Abstract—It has been shown recently that for coherence based dual microphone array speech enhancement systems, cross-spectral subtraction is an efficient technique aimed to reduce the correlated noise components. The zero-phase filtering criterion employed in these methods is derived from the standard coherence function that is modified to incorporate the noise cross power spectrum between the two channels. However, there has been limited success at applying coherence based filters when speech processing is carried out under relatively harsh acoustic conditions (SNR below -5 dB) or when the speech and noise sources are closely spaced. We propose an alternative method that is effective, and that attempts to use a phase-based filtering criterion by substituting the cross power spectrum of the noisy signals received on the two channels by its real part. Then, a variant of the running minimum noise tracking procedure is applied on the estimated speech spectrum as an adaptive postfiltering to reduce the cosine shaped power spectrum of the remaining residual musical noise to a minimum spectral floor. Using that adaptive postfilter, a soft-decision scheme is implemented to control the amount of noise suppression. Our preliminary results based on experiments conducted on real speech signals show an improved performance of the proposed method over the coherence based approaches. These results also show that it performs well on speech while producing less spectral distortion even in severe noisy conditions.
I. Introduction
The effect of background noise present in many operating environments, and acoustically or digitally added to speech, may lead to substantial degradation of the intelligibility and quality perception of speech. Because of the established idea that the auditory system is more responsive to sound energy and tends to ignore several aspects of sound phase, speech enhancement (SE) and coding algorithms often focus on the accurate estimation of high-amplitude frequencies (the harmonic peaks) in the magnitude spectrum of the degraded signal, leaving aside the issue of phase spectrum estimation. The common assumption in these methods is that the phase is relatively unimportant perceptually, and retains much less features of speech signals than the magnitude of spectral components [1].
Numerous SE methods, including spectral subtraction [2]−[5], and parametric Wiener filtering [6], assume that significant noise reduction can be achieved by removing the noise from the magnitude spectrum or the estimated periodograms of the corrupted speech. In [2,3,5,6], the estimated spectrum is coupled to the phase spectrum of the 4
degraded speech signal and transformed back into a time waveform, whereas in [4], the resultant periodograms are converted back by inverse DFT into desired time autocorrelation coefficients. However, those methods become less reliable when the interfering noise statistics are time varying or when the additive noise power is equal to or higher than the signal power.
While spectral subtraction techniques are the most common zero-phase filtering methods, there have also been extensive research that examined many different ways to enhance a noisy speech signal corrupted by both stationary and transient noise. That attempt gave rise namely to two well-known approaches. The former employs a zero-phase filtering based coherence function together with a cross-power subtraction technique as a weighting criterion to deal with both coherent and incoherent noise [7]−[9]. However, there has been limited success at applying this coherence based approach when the speech processing is carried out under relatively harsh acoustic conditions (SNR below -5 dB) or when the cross-correlation between the noise signals received on the two channels is high enough, which is true for closely distributed channels. Accordingly, the corresponding filter is perceived to be suboptimal in these realistic noise conditions, which are typical in many speech enhancement applications. In addition, that approach is less effective to reduce “structured” background noises such as helicopter or lively cocktail party environments. The latter approach involves the phase information of the spectral components within the filter weighting function [10]−[12]. Unfortunately, such method gave rise to an unpleasant audible residual noise that exhibits itself in the spectrum as periodically spaced narrow bands added to the spectrum of the enhanced signal. The annoying effect of these bands is more salient when the speech signal is degraded by a wide-band uniformly distributed Gaussian noise.
In this paper, we propose an alternative method that is effective, and that attempts to use a phase-based filtering criterion by substituting the cross power spectrum of the noisy signals received on the two channels by its real part, given that the power spectral density of speech is a real function of w (the frequency in radian per second). Then, a variant of the running minimum noise tracking procedure originally proposed by Martin [17] is applied on the estimated speech spectrum as an adaptive postfiltering to reduce the cosine shaped power spectrum of the remaining residual noise to a minimum spectral floor. Using that adaptive postfilter, a frequency dependent soft-decision scheme is implemented to control the amount of noise suppression. Unlike the methods mentioned previously, the enhanced speech spectrum is combined with a refined phase spectrum before being transformed back into a time waveform. That phase spectrum estimate is obtained by normalizing the sum of the phase spectra associated with the noisy signals being analyzed. In experiments conducted on real speech signals recorded in different background noise environments at diverse SNR levels, the proposed speech enhancement method yields significantly better performance in terms of segmental SNR and speech distortion than the coherence based approaches, and suffers less spectral distortion even in severe noisy environments.
The method re-synthesizes a related time waveform from the computed phase-based weighting and phase functions. This makes it suitable to be used as a front end to digital voice-controlled systems in adverse acoustic environments, and can easily be implemented in portable digital aids for hearing handicapped.
The remainder of the paper is structured as follows. Section II presents the detailed formulation and implementation of the proposed speech enhancement method. Our experimental performance evaluation of quantitative results is given in Section III. Included in that section are the generation of the test data and the performance comparison of the proposed method with the coherence based [7] and Zelinski [12] approaches. Section IV incorporates some notes about suggested directions for further performance improvement of the proposed method. Finally, Section V summarizes our results.
II. Method Formulation and Implementation
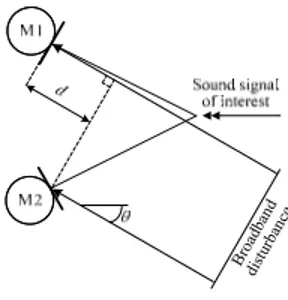
Let s(t) denote a time history sound signal of interest arising from a remote source and monitored in a noisy environment in front of an array of M spatially distributed microphones. The various relationships illustrated herein will be performed for the case M=2, but a generalization has occasionally been considered. Since it is generally assumed that the signal characteristics of speech are locally slowly time varying in a statistical sense, a short-time window is used to extract the speech parameters, hypothesized to remain time stationary all over the section length of the window. Let N be the window length. Each received noisy signal is segmented and windowed such that, in the absence of processing and when the corresponding sequences are half-overlapped and added together, the resulting overall process reduces to identity. The discrete-time windowed version of the noisy signals received on the two channels can be mathematically modeled as (1) 2 ,1 ), ( ) ( ) ( ) (i =h i *s i +n i m= xm m m
where and denote the noisy and the noise signals received on the mth channel respectively, s(i) is the speech signal of interest coming from the direct path, is the mth channel impulse response, "
) (i xm nm(i) ) (i hm
∗" denotes the linear convolution, and i, 0≤i≤ N−1 is
the sampling time index.
Consider the case in which a magnitude average of the short-time Fourier transform (STFT) of two received noisy sequences is passed through an adaptive phase-based filter and combined with a refined phase spectrum estimate. Let the phase-based gain and phase spectrum estimate of the filter be denoted byψˆ(jw,k) andϕˆ(jw,k)respectively. Then, the STFT spectrum of the estimated signal on the filter output is obtained
as follows ( , ) ˆ jw k X ) 2 ( 2 ) , ( ) , ( ) , ( ˆ ) , ( ˆ jw k jw k X1 jw k X2 jw k ejˆ(jw,k) X ψ ⎟⎟ ϕ ⎠ ⎞ ⎜⎜ ⎝ ⎛ + =
where and denote the STFT of and respectively, w is the
frequency bin (in rad/s), and k is the frame index. 1( , ) k
jw
X X2(jw,k) x1(i) x2(i)
The selection of ψˆ(jw,k) to optimize certain performance criteria has been studied by several investigators [12]−[15]. It has been shown in [12] that an effective microphone array filter estimator could be derived given the assumptions that the power spectral density of speech is a real function of w and the reverberations are insignificant
{
}
(3a) ) , ( ˆ ) , ( ˆ 1 2 ) , ( ˆ 1 1 1 1∑
∑ ∑
= − = = + Φ Φ ℜ ⎟ ⎠ ⎞ ⎜ ⎝ ⎛ − = M m x x M m M m r x x k jw k jw M k jw m m r m ψ where (3b) ) , ( ˆ ) , ( ˆ ) , ( ˆ ) , ( ˆ ) , ( ˆ jw k jw k * jw k jw k jw k r m r m r mx ss sn sn n n x =Φ +Φ +Φ +Φ Φ and (3c) ) , ( ˆ ) , ( ˆ ) , ( ˆ ) , ( ˆ ) , ( ˆ jw k jw k jw k * jw k jw k m m m m m mx ss sn sn n n x =Φ +Φ +Φ +Φ Φdenote the estimated cross and auto power spectral densities of the received signals on the channels m and r respectively, M is the number of microphones in the array, "*" denotes the complex conjugate, and where ℜ
{}
⋅ is the real operator. The filter estimator defined in (3a) yields a normalized frequency weighting function, and the normalization is such that) , ( ˆ jw k
ψ always lies within the range0≤ψˆ(jw,k)≤1.
The auto and cross power spectral densities specified in (3a)−(3c) can be estimated by carrying out a frequency independent moving average performed with respect to time (see Appendix A.1). It can be seen that for models of the form of (1), and for nonrecursive smoothing of the spectral densities estimation, equation (3a) reduces to
(
)
(4) ) , ( ) , ( ) , ( ) , ( cos ) , ( ) , ( 2 ) , ( ˆ 2 2 2 1 2 1 1 2 k jw X k jw X k jw k jw k jw X k jw X k jw X X + − = ϕ ϕ ψwhere ϕX1(jw,k) and ϕX2(jw,k)denote the phase spectra of and respectively, and satisfying the condition
) ( 1 i x x2(i) 2 / ) , ( ) , ( 2 1 ϕ π
ϕX jw k − X jw k < . Any negative values in
equation (4) are reset to spectral floor, on the assumption that such frequencies cannot be recovered.
The following assumptions can be made regarding the speech and noise signals (a1) The speech and noise sources are statistically independent random processes. (a2) The noise signals are spatially uncorrelated.
For dual microphone array filter estimator and under assumptions (a1) and (a2), if the estimated power spectral density (psd) of noise in (1) becomes roughly close to that of , the frequency weighting in (3a) would then be equal to the frequency response of an optimum linear Wiener filter whose estimated lth output spectral component is given by ) ( 1 i n ) ( 2 i n (5) 1 ), , ( ) , ( ) , ( ) , ( ) , ( ˆ = Φ + Φ Φ = α α jw k X jw k k jw k jw k jw X l nl sl sl l
where denotes the lth parameter of the mean power spectrum of the sound signal of interest, is the estimated power spectrum of the noise, is a vector of noisy spectral samples, and
) , (jwk sl Φ ) , (jw k nl Φ Xl(jw,k)
α is a control factor equal to 1 in the classical case.
Using a dual microphone array filter estimator, a secondary procedure is applied to further reduce the background noise power by comparing the frequency weighting function ψˆ(jw,k) to an upper and lower statistical threshold ψmax andψmin respectively. The procedure is implemented as follows
(p1) Ifψˆ(jw,k)≥ψmax, thenψˆ(jw,k)=1. This presumes that dominant speech is present at that frequency; therefore, it should be processed without distortion. (p2) Ifψˆ(jw,k)≤ψmin, thenψ
(
ψ)
β min ˆ ) , (ˆ jw k = , where β ≥1 is a scalar spectral floor control parameter. This presumes that the spectrum at that frequency is dominated by noise; thus, taking a minimum spectral floor mitigates that noise while improving the quality perception of output speech.
(p3) Ifψmin <ψˆ(jw,k)<ψmax, then there are both speech and noise present at that frequency; consequently, the spectrum at that frequency should be biased according to the estimator strength.
In addition, better results were obtained when the frequency weighting ψˆ(jw,k) was squared and smoothed recursively with respect to time.
The dual microphone array filter estimator has shown interesting capabilities. On the one hand, it is able to perform complete cancellation of the incoherent noise components. On the other hand, its time varying nature allows dealing with transient acoustic environments even in severe noisy conditions [16]. Unfortunately, such estimator gives rise to residual musical noise that is not pleasant to listen to due to its cosine shaped power spectrum. Broa dban d distu rban ce
Fig. 1. Dual-directional microphone array in noisy environment.
Consider the situation where two directional microphones are spatially distributed in a noisy environment and monitoring the sound signal of interest coming from the direct path, as shown in Fig. 1. Let θ be the angle from which arises a broadband disturbance, and d be the path length difference of travel of the interfered signals. The multiplication of the filter gain estimator by the average of the STFT magnitudes of the received noisy sequences yields a periodic convolution sum in the time domain of the estimated signal by a sequence of impulses uniformly spaced at intervals proportional to the path length difference d. That convolution sum process will exhibit itself in the spectrum as periodically spaced narrow bands added to the spectrum of the signal estimate. The frequency bins within these narrow bands are equally weighted with gain close to unity, while those between them are scaled according to the estimator strength. Transformed 8
back to the time domain, these bands produce an annoying effect that sounds like a loud hissing noise.
As we will show in the paper, the performance of that estimator would be significantly improved if those frequency bins were properly tracked in each frequency band and subtracted from the spectrum of the estimated signal. In the following, a variant of the running minimum noise tracking procedure [17] is used as an adaptive postfiltering for keeping track of those frequency bins.
Following the proposal in [17], an optimal time and frequency dependent smoothing parameter is used to smooth recursively the psd of the estimated signal (see Appendix A.2). When performing the running minimum search, the D subsequent psd estimates were divided into 2 sliding data subwindows of samples, and the minimum estimate is updated every time instant. Using that running update rate, the highest delay that could occur in response to a rising noise power is approximately
2 / D 1 ) ( log2 D − .
To discard the inappropriate frequency bins in each band, a frequency dependent soft-decision scheme is implemented. For each frequency w and frame index k, it compares the normalized deviation of the actual short-term psd estimate to a given statistical threshold. Based on that comparison, the running decision is taken by preserving the sound frequency bins of interest and reducing the noise ones to a minimum spectral floor. The scheme is summarized below
(
)
(
)
(
)
(
)
(
)
(
)
(
)
(
)
(
)
(
)
(
)
2 min ) , ( 2 2 2 ˆˆ . ˆ ˆ set . ˆ ˆ set 0 1 ˆ ˆ ˆ as spectrum output estimated the Compute 1 ˆ 10 log 10 as decibel in deviation normalized the Compute ˆ ⎟ ⎠ ⎞ ⎜ ⎝ ⎛ = − < • = − < • ⎟ ⎠ ⎞ ⎜ ⎝ ⎛ − − = − • ⎟⎟ ⎠ ⎞ ⎜⎜ ⎝ ⎛ − Φ = − • threshold ND jw,k X jw,k X threshold ND elseif X jw,k X jw,k X ND if .e jw,k jw,k X jw,k X jw,k jw,k . ND k jw j n n x x dB x ϕ σ σwhere and denote the psd of the estimated signal and the latest
noise psd estimate respectively, and is such that ) , ( ˆ ˆx jw k x Φ ˆ2(jw,k−1) n σ min
X 20log10
(
Xmin)
≅−80dB. When the normalized deviation is lower than the given statistical threshold, the term allows the estimated output spectrum to be smoothed during noise suppression. Note that the normalized deviation should take high values during speech activity within a given analysis frame, and small values during speech pause periods.(
2ld
ND/thresho
)
Before being transformed back into a time waveform, the estimated magnitude spectrum is combined with a refined phase spectrum estimate, obtained by normalizing a sum of the phase spectra associated with the noisy signals being analyzed. Consider a 9
mathematical transformation that takes a set of phase spectra into an estimated circular mean phase spectrumϕˆ(jw,k), and satisfies the equation
(6) ) , ( ) , ( ) , ( ) , ( ) , ( ˆ 2 1 2 1 k jw j k jw j k jw j k jw j k jw j X X X X e e e e e ϕ ϕ ϕ ϕ ϕ + + =
When that phase transformation is applied on the estimated spectrum and transformed back to the time domain, the corresponding time waveform would match better the sound signal of interest coming from the direct path. The transformation defined in (6) gives rise to a normalized phase spectrum estimate, and the normalization is such that
) , ( ˆ jw k
ϕ lies always within the range−π ≤ϕˆ(jw,k)≤π .
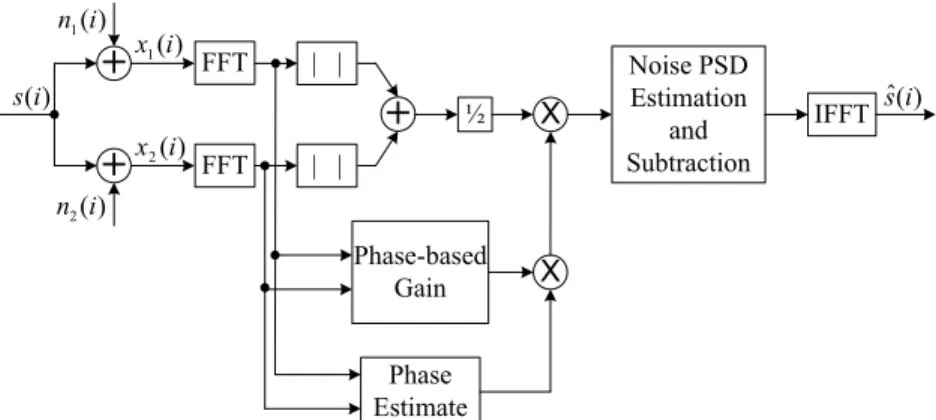
After an inverse DFT of the estimated spectrum, the resultant time waveform is half-overlapped and added to adjacent processed segments to produce the enhanced output speech sequence. A block diagram of the proposed speech enhancement method is depicted in Fig. 2.
III. Performance Evaluation and Results
The performance of the proposed method has been assessed in experiments involving four different types of background noise at diverse SNR levels: (W) wide-band uniformly distributed Gaussian noise, (H) helicopter rotor noise, (I) impulsive noise, and (B) uncorrelated multitalker babble noise. The experimental setup and the generation of the test data for objective performance evaluation are presented in the next section. Quantitative results based on objective quality distance measures and spectrograms are given in Section IV-B. That section also includes the performance comparison of the proposed method with the coherence based [7] and Zelinski [12] approaches.
A. Experimental setup
Experiments were conducted on real speech filtered at 20 kHz and digitized to 16 bits at a 44.1 kHz sampling rate. On a frame-by-frame basis, the digitized speech wave was subjected to spectral analysis with nearly 23.2 msec sine analysis frame length and about 11.6 msec frame rate. A smoothed sine synthesis window was applied on the enhanced speech frame prior to reconstruction. In all the experiments, the channels were set to nearly 20cm apart, and the recordings were made using Presonus FIREPOD 24-bit/96k firewire recording interface along with two Panasonic WM-61 B type directional microphones. For these experiments, the upper and lower statistical thresholds ψmax and
min
ψ were set to 0.9 and 0.05 respectively. The spectral floor control parameter β was fixed to 2. The length of D subsequent psd estimates was set to 100 samples. A global SNR estimation of the input data was used in the experiments. It is computed by averaging over the received two channel signals
[
( ) ( )]
(7) ) ( log 10 SNR(dB) 2 1 1 2 2 1 1 2 10 ⎥ ⎥ ⎥ ⎥ ⎦ ⎤ ⎢ ⎢ ⎢ ⎢ ⎣ ⎡ − =∑∑
∑∑
= = = = m L i m m m L i m i s i x i s 10where L is the number of samples of the signal received on the mth channel. Throughout the experiments, background noise was acoustically added to clean speech with varying a posteriori SNR from -8 dB to 8 dB in 4 dB steps.
One speech sentence selected from the HINT database, lasting 6 sec, was recorded and used within the experiments, and four different background noise types at diverse SNR levels were generated or recorded and acoustically added to that speech sentence (see Table III in Appendix B). Time series of zero-mean, i.i.d. Gaussian noise were generated by computer. Various controlled levels of spectral distortion were obtained by adjusting the Gaussian noise variance . A recorded UH-60A Black Hawk helicopter rotor noise was chosen and its level was adjusted to provide a posteriori SNR ranging from -8 dB to 8 dB. The multitalker babble noise was recorded in a lively cocktail party environment. Sequences of impulsive noise were generated by amplitude-modulating diverse binary-state random sequences with a heavy tableware noise.
2 σ
B. Objective quality measure
The Itakura-Saito (IS) spectral distance and the log spectral distortion (LSD) were chosen to perform the quantitative measures (see Appendix C). To get a reasonable overall measure as was suggested in [19], the highest 5 % of the distance values were discarded, which allows for the removal of a fixed number of unrealistically high spectral distortion levels. To prevent log(0) in the computation of those two measures, a zero-mean Gaussian noise sequence with approximately -40 dB energy was added both to clean and enhanced speech segments. In addition to the IS and LSD distance measures, a frame-based segmental SNR was used as a reasonable measure of speech quality that takes into consideration both speech distortion and noise reduction. It is computed by averaging frame level SNR estimates over M frames of length N
[
() ˆ( )]
(8) ) ( log 10 1 (dB) SNR 1 0 1 2 1 2 10 seg∑
∑
∑
− = + − = − + = ⎥ ⎥ ⎥ ⎥ ⎦ ⎤ ⎢ ⎢ ⎢ ⎢ ⎣ ⎡ − = M j jN N jN i N jN jN i i s i s i s Mwhere s(i) and ŝ(i) are the clean and enhanced speech signals respectively.
To perform the above measures, an average of the two channel clean signals was used as the clean signal.
The original speech sentence L_1 was corrupted with different background noise types, such that the input SNR is about 0 dB. Figs. 3-6 show the spectrograms of the signals corresponding to the clean, degraded, Zelinski filter output, coherence based output, and output of the proposed method. For noise (W) (Fig. 3), note the periodically spaced dark bands added to the spectrum of the Zelinski output. That residual noise is not pleasant to listen to. Whereas our method and the method in [7] provide sufficient amount of noise suppression, the spectrum of the former preserves better the desired speech components. In particular, note the elimination of the fourth speech formant in the spectrogram corresponding to the method in [7] as seen in the vicinity of 4.5 sec. Omitting energy above 3 kHz can slightly impair the perception of some consonants. In the case of noise (H) (Fig. 4), large residual noise components are observed in the Zelinski and method [7] 11
results. Unlike these two methods, our method result shows that the noise between the speech periods is noticeably reduced, while the shape of the speech periods is nearly unchanged. For noise (I) (Fig. 5), it can be observed that the Zelinski and method [7] results are less effective in that case. On the contrary, result of our method shows that the impulsive noise is moderately reduced on both the speech and noise periods. In the case of noise (B) (Fig. 6), it can be seen that Zelinski and [7] methods achieve insufficient noise reduction, particularly in the noise only periods. On the contrary, the noise reduction given by our method is more important on the entire spectrum. From these figures, it can be concluded that, while the noise (W) degradation is the most serious for Zelinski approach, the method in [7] achieves insufficient noise reduction for “structured” background noises such as helicopter or babble noise environments. On the other hand, our method can deal efficiently with both stationary and transient noises with less spectral distortion even in severe noisy environments.
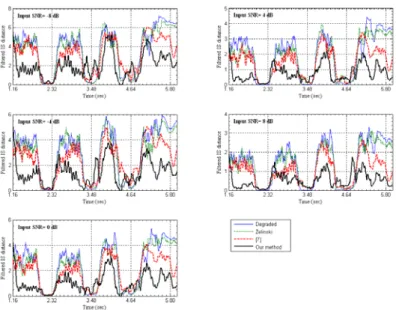
Figs. 7-10 illustrate the frame by frame IS distance comparison of the proposed method with the Zelinski and [7] approaches for several input SNR in the presence of different background noise types. These figures were obtained by averaging the IS distance values corresponding to each estimated output over a sliding window size of ten (10) elements. These figures indicate that Zelinski and [7] methods yield more speech distortion than that produced with the proposed method, particularly in helicopter and babble noise environments.
Figs. 11 and 12 demonstrates the comparative results in terms of LSD measures and segmental SNR respectively, of the proposed method with the Zelinski and [7] approaches under various input SNR levels in the presence of different background noise types. From these figures, it can be seen that, whereas the three methods are almost comparable in terms of LSD for noise (I), the LSD values of the proposed one are lowest in all noise types. In terms of segmental SNR, the proposed method can get about 4 dB and 2 dB improvements on average over Zelinski and [7] approaches respectively.
IV. Discussion
In the previous sections, the sound signal of interest is assumed to be monitored by a dual microphone array whose characteristics are uniformly linear and unconstrained. This implies that the array characteristics are invariable over the entire frequency band of the signals, i.e., gain and phase matching. In practice, however, the performance of many speech communication systems based microphone array (e.g., voice terminals, hearing aids) depends to a large extent on how sensitive the array characteristics to random errors such as amplitude and phase dissimilarities [21]. The robustness against frequency-invariant random errors can be improved by performing a calibration procedure on the microphone array being used [22]. Unfortunately, such calibration procedure fails to improve the microphone array robustness when the errors are random and vary across frequency. A special emphasis should be focused on the array characteristics when using a phase-based microphone array filter estimator, since such frequency-variant random errors lead to a decrease of the effectiveness of the noise suppressor. Fig. 13 plots the case of a phase error occurrence over the frequency range of interest obtained from two closely spaced microphones.
Most of the methods developed in order to accomplish the speech enhancement process assume that the speech signal is corrupted only by an additive background noise. Nonetheless, in an auditorium (e.g., amphitheatre, concert hall) where multiple sound echoes may emerge, these methods seem to be suboptimal since they do not consider the spatial characteristics of both the sound source of interest and the noise. The accuracy of the method discussed herein could further be improved if an appropriate HRTF model representing the spectral cues of spatial sound positions is carefully chosen and synthesized, and the processed HRTF data is incorporated into the filter estimator transfer function. This would imply the use of a multi-microphone array as an input to the expected filter estimator, and would allow finer deal with a more realistic speech enhancement situation.
V. Conclusions
Given two received signals corrupted by both stationary and transient noise, the use of the minimum noise tracking procedure by the proposed method as an adaptive postfiltering can substantially reduce the cosine shaped power spectrum of the residual musical noise that would otherwise be present at the output of a phase-based filter estimator and would be unpleasant to listen to. When performing that variant of the running minimum search, the highest delay that could occur in response to a rising noise power is approximatelylog2(D)−1. The explicit formulation of our method has shown to be computationally efficient and its time updating properties make it suitable for real time applications.
In situations where the speech processing is carried out under relatively harsh acoustic conditions (SNR below -5 dB) or when the speech and noise sources are closely spaced, objective evaluations carried out herein made evident that the proposed method can improve the performance of a speech communication system by at least 2 dB on average in terms of segmental SNR relative to that achieved when using Zelinski or the coherence based approaches. It was also observed that our method suffers less spectral distortion even in severe noisy conditions.
Appendix A A.1 Power and cross spectral densities estimation
Let and be the short-term spectra defined over frequency bin w and frame index k of the signals and being analyzed. The auto and cross power spectral densities can be estimated by using a time average performed through a standard first order recursive update formula on a frame by frame basis [14]
) , ( 1 jwk Y Y2(jw,k) ) ( 1 i y y2(i)
(
1 ( , ))
( , ) ( , ) ( , 1) ( .1. ) ) , ( 11 1 1 2 1 jw k jw k jw k A a Y k jw k jw yy y y = − + Φ − Φ λ λ(
1 ( , ))
( , ) ( , ) ( , 1) ( .1. ) ) , ( 2 2 2 2 2 2 jw k jw k jw k A b Y k jw k jw yy y y = − + Φ − Φ λ λ(
1 ( , ))
( , ) ( , ) ( , ) ( , 1) ( .1. ) ) , ( 1 2 2 1 * 2 1 jw k Y jw k jw k jw k A c Y k jw k jw yy y y = − + Φ − Φ λ λ 13In the previous equations,λ, 0<λ<1 is a time and frequency dependent smoothing parameter. It has been shown in [17] thatλ should take small values during speech activity within a given analysis frame, and high values during speech pause periods. This however allows a small estimator variance.
A.2 Optimum smoothing parameter
Let and denote the latest short term estimate of the signal
and the noise power spectral densities respectively. The optimal time varying smoothing parameter required to smooth recursively the psd of the noisy signal is defined as follows
) 1 , ( ˆ − Φxx jw k ˆ2(jw,k−1) n σ ) 2 . ( 1 ) 1 , ( ˆ ( , 1) ˆ 1 ) ( ) , ( ˆ 2 2 max A k jw k jw k k jw n xx corr opt ⎟⎟ ⎠ ⎞ ⎜⎜ ⎝ ⎛ − − − Φ + = σ λ λ λ
where λmax refers to a higher limit used to improve the noise estimator performance in high transient noise levels, and where λcorrdenotes a correction factor used to decrease the smoothing parameter in case of large deviations in the estimated noise psd [17]. Note that λcorr is a time dependent parameter.
Appendix B
TABLE III
SPEECH SENTENCE FROM HINT DATABASE AND BACKGROUND NOISE DATA
L_1 "Flowers grow in the garden" Adult male talker
Noise (W) Gaussian Uniformly distributed
Noise (H) UH-60A Black Hawk helicopter Rotor blade in motion Noise (I) Impulsive
Binary-state random sequence modulated by heavy tableware noise
Noise (B) Multitalker babble Cocktail party
Appendix C C.1 Itakura-Saito (IS) distance
Let arr and be the augmented LPC coefficient vectors for the reference and test speech segments respectively. The IS distance originally proposed by Itakura [23] for the autocorrelation method of linear prediction is given by
t ar ) 1 . ( 1 log ) , ( 22 22 C a V a a V a a a d r t T t t t T r t r t r t r IS ⎟⎟− ⎠ ⎞ ⎜⎜ ⎝ ⎛ + ⎥ ⎦ ⎤ ⎢ ⎣ ⎡ ⎥ ⎦ ⎤ ⎢ ⎣ ⎡ = σ σ σ σ r r r r r r
In the previous equation, is the autocorrelation matrix of the test speech segment, and
t V r
σ and σt are the LPC gain parameters for the reference and test speech segments
respectively. Note that the quadratic form T i t iVa
a rr represents the energy per sample, or
power in the prediction residual. Lower values of IS distance corresponds to lesser dissimilarity between two sets of linear prediction coefficients, and accordingly better speech quality.
C.2 Log spectral distortion (LSD)
Let u and be two M-dimensional vectors that are divided into P frames of length N. Let v )
( ~ l
Up and V~p(l)be the lth spectral components of the pth frame of the normalized versions u~ and v~ of those vectors respectively. Assuming K-point DFT, the log spectral distortion, in decibels, between and is given by [19] u v
) 2 . ( ) ( ~ log ) ( ~ log 20 . ) , ( 1 0 C l V l U K M N v u d P p K l p p LSD
∑∑
= = − ⎥⎦ ⎤ ⎢⎣ ⎡ =The normalized vectors u~ and v~ are such that their corresponding energies are set equal to unity (0 dB). Note that the lower LSD level indicates better speech quality.
Acknowledgments
This research was supported by the Fonds québécois de la recherche sur la nature et les technologies (FQRNT) and the Fondation de l'École Polytechnique. The authors wish to thank Dr. M. Boukadoum for the fruitful discussions he has had throughout the writing of the paper and his help in commenting constructively the proposed method.
References
[1] D. O’Shaughnessy, Speech Communications: Human and Machine, 2nd ed. New York: IEEE Press, 2000.
[2] W. Kim et al., “Spectral subtraction based on phonetic dependency and masking effects,” IEE Proc. On VISP, vol. 147, no. 5, pp. 423-427, 2000.
[3] G.S. Kang and L.J. Fransen, “Quality improvement of LPC-processed noisy speech by using spectral subtraction,” IEEE Trans. on ASSP, vol. 37, no. 6, pp. 939-942, 1989.
[4] C.K. Un and K.Y. Choi, “Improving LPC analysis of noisy speech by autocorrelation subtraction method,” IEEE Int. Conf. on ASSP, vol. 6, pp. 1082-1085, 1981.
[5] S.F. Boll, “Suppression of acoustic noise in speech using spectral subtraction,” IEEE Trans. on ASSP, vol. 27, no. 2, pp. 113-120, 1979.
[6] J.S. Lim and A.V. Oppenheim, “Enhancement and bandwidth compression of noisy speech,” Proc. IEEE, vol. 4, no. 12, pp. 699-702, 1979.
[7] X. Zhang and Y. Jia, “A soft decision based noise cross power spectral density estimation for two-microphone speech enhancement systems,” IEEE IC on ASSP, vol. 1, pp. I/813-16, 2005.
[8] A. Guerin et al., “A two-sensor noise reduction system: applications for hands-free car kit,” in EURASIP JASP, pp. 1125-1134, 2003.
[9] R. Bouquin et al., “Enhancement of speech degraded by coherent and incoherent noise using a cross-spectral estimator,” IEEE Trans. on SAP, vol. 5, no. 5, pp. 484-487, 1997.
[10] I.A. McCowan and H. Boulard, “Microphone array post-filter based on noise field coherence,” IEEE Trans. on SAP, vol. 11, no. 6, pp. 709-716, 2003.
[11] E. Lindemann, “Two microphone nonlinear frequency domain beamformer for hearing aid noise reduction,” IEEE ASSP Workshop on ASPAA, pp. 24-27, 1995. [12] R. Zelinski, “A microphone array with adaptive post-filtering for noise reduction in
reverberant rooms,” in Proc. ICASSP, vol. 5, pp. 2578-2581, 1988.
[13] G.C. Carter, “Coherence and time delay estimation,” Proc. IEEE, vol. 75, no. 2, pp. 236-255, 1987.
[14] J.B. Allen et al., “Multimicrophone signal-processing technique to remove room reberberation from speech signals,” J. Acoust. Soc. Amer., vol. 62, no. 4, pp. 912– 915, 1977.
[15] G.C. Carter and C.H. Knapp, “Coherence and its estimation via the partitioned modified chip-Z transform,” IEEE Trans. on ASSP, vol. 23, no. 3, pp. 257-264, 1975.
[16] C.C. Marro et al., “Analysis of noise reduction and dereverberation techniques based on microphone arrays with postfiltering,” IEEE Trans. on SAP, vol. 6, no. 3, pp. 240-259, 1998.
[17] R. Martin, “Noise power spectral estimation based on optimal smoothing and minimum statistics,” IEEE Trans. on SAP, vol. 9, no. 5, pp. 504-512, 2001.
[18] J.H.L. Hansen and B. Pellom, “An effective quality evaluation protocol for speech enhancement algorithms,” Inter. Conf. on SLP, vol. 7, pp. 2819-2822, 1998.
[19] U. Mittal and N. Phamdo, “Signal/Noise KLT based approach for enhancing speech degraded by colored noise,” IEEE Trans. on SAP, vol. 8, no. 2, pp. 159-167, 2000. [20] ITU-T, Recommendation P.800, Methods for subjective determination of
transmission quality. International Telecommunication Union Radiocommunication Assembly, 1996.
[21] S. Doclo and M. Moonen, “Design of broadband beamformers robust against gain and phase errors in the microphone array characteristics,” IEEE Trans. on SP, vol. 51, no. 10, pp. 2511-2526, 2003.
[22] C. Sydow, “Broadband beamforming for a microphone array,” J. Acoust. Soc. Am., vol. 96, no. 2, pp. 845-849, 1994.
[23] F. Itakura, “Minimum prediction residual principle applied to speech recognition,” IEEE Trans. on ASSP, vol. 23, pp. 67-72, 1975.
[24] Y. Negata et al., “Speech enhancement based on auto gain control,” IEEE Trans. on ASLP, vol. 14, no. 1, pp. 177-190, 2006.
[25] Z. Zhang et al., “Multi-sensory microphones for robust speech detection, enhancement and recognition,” IEEE Int. Conf. on ASSP, vol. 3, pp. iii-781-4, 2004.
[26] J.R. Deller et al., Discrete-Time Processing of Speech Signals. New York: IEEE Press, 2000.
[27] S.R. Quackenbush et al., Objective Measures of Speech Quality. Prentice-Hall, NJ, 1988.
[28] Y.T. Chan and R.K. Miskowicz, “Estimation of coherence and time delay with ARMA models,” IEEE Trans. on ASSP, vol. 32, no. 2, pp. 295-303, 1984.
[29] E.J. Hannan and P.J. Thomson, “Delay estimation and the estimation of coherence and phase,” IEEE Trans. on ASSP, vol. 29, no. 3, pp. 485-490, 1981.
[30] M. Berouti et al., “Enhancement of speech corrupted by acoustic noise,” IEEE Int. Conf. on ASSP, vol. 6, pp. 1082-1085, 1979.
[31] W.D. Voiers, “Diagnostic acceptability measure for speech communication systems,” IEEE Int. Conf. on ASSP, vol. 2, pp. 204-207, 1977.
[32] R. Viswanathan et al., “Towards perceptually consistent measures of spectral distance,” IEEE Int. Conf. on ASSP, vol. 1, pp. 485-488, 1976.
+
+
FFT FFT | | | |+
½ X IFFT Phase-based Gain Phase Estimate X ) ( 1i n ) ( 2 i n ) (i s ) ( 1i x ) ( 2 i x ) ( ˆ i s Noise PSD Estimation and SubtractionFig. 2. Block diagram of the proposed speech enhancement method, where "| |" denotes the magnitude spectrum.
Fig. 3. Spectrograms of clean signal, degraded signal, Zelinski filter output, [7] output, and output of the proposed method; obtained in the presence of white Gaussian noise (W) (Input SNR = 0 dB).
Fig. 4. Spectrograms of clean signal, degraded signal, Zelinski filter output, [7] output, and output of the proposed method; obtained in the presence of helicopter rotor noise (H) (Input SNR = 0 dB).
Fig. 5. Spectrograms of clean signal, degraded signal, Zelinski filter output, [7] output, and output of the proposed method; obtained in the presence of impulsive noise (I) (Input SNR = 0 dB).
Fig. 6. Spectrograms of clean signal, degraded signal, Zelinski filter output, [7] output, and output of the proposed method; obtained in the presence of babble noise (B) (Input SNR = 0 dB).
Fig. 7. Comparative performance in terms of filtered IS distance for several input SNRs in the presence of white Gaussian noise (W).
Fig. 8. Comparative performance in terms of filtered IS distance for several input SNRs in the presence of helicopter rotor noise (H).
Fig. 9. Comparative performance in terms of filtered IS distance for several input SNRs in the presence of impulsive noise (I).
Fig. 10. Comparative performance in terms of filtered IS distance for several input SNRs in the presence of babble noise (B).
Fig. 11. Comparative performance in terms of log spectral distortion (LSD) for several input SNR in the presence of different background noise types.
Fig. 12. Comparative performance in terms of segmental SNR for several input SNR in the presence of different background noise types.
Fig. 13. Phase error occurrence over the frequency range of interest (20 Hz - 20 kHz) acquired from two closely spaced microphones.

![Fig. 4. Spectrograms of clean signal, degraded signal, Zelinski filter output, [7] output, and output of the proposed method;](https://thumb-eu.123doks.com/thumbv2/123doknet/8251835.277729/22.918.261.657.106.415/spectrograms-signal-degraded-signal-zelinski-filter-output-proposed.webp)
![Fig. 6. Spectrograms of clean signal, degraded signal, Zelinski filter output, [7] output, and output of the proposed method;](https://thumb-eu.123doks.com/thumbv2/123doknet/8251835.277729/23.918.261.657.105.414/spectrograms-signal-degraded-signal-zelinski-filter-output-proposed.webp)