Titre:
Title:
The role of public funding in nanotechnology scientific production: Where Canada stands in comparison to the United States
Auteurs:
Authors: Leila Tahmooresnejad, Catherine Beaudry et Andrea Schiffauerova
Date: 2015 Référence:
Citation:
Tahmooresnejad, Leila, Beaudry, Catherine et Schiffauerova, Andrea (2015). The role of public funding in nanotechnology scientific production: Where Canada stands in comparison to the United States. Scientometrics, 102(1), p. 753-787. doi:10.1007/s11192-014-1432-2
Document en libre accès dans PolyPublie
Open Access document in PolyPublie
URL de PolyPublie:
PolyPublie URL: http://publications.polymtl.ca/2317/
Version: Version finale avant publication / Accepted versionRévisé par les pairs / Refereed Conditions d’utilisation:
Terms of Use: CC BY-NC-ND
Document publié chez l’éditeur commercial
Document issued by the commercial publisher
Titre de la revue:
Journal Title: Scientometrics
Maison d’édition:
Publisher: Springer
URL officiel:
Official URL: http://dx.doi.org/10.1007/s11192-014-1432-2
Mention légale:
Legal notice: The final publication is available at Springer via http://dx.doi.org/10.1007/s11192 -014-1432-2
Ce fichier a été téléchargé à partir de PolyPublie, le dépôt institutionnel de Polytechnique Montréal
This file has been downloaded from PolyPublie, the institutional repository of Polytechnique Montréal
The Role of Public Funding in Nanotechnology Scientific
Production: Where Canada Stands in Comparison to the United
States
Leila Tahmooresnejad1, Catherine Beaudry2*, Andrea Schiffauerova3
Polytechnique Montreal, Montreal, QC, H3C 3A7, Canada Concordia University, Montreal, QC, H3G 1M8, Canada
Abstract
This paper presents cross-country comparisons between Canada and the United States in terms of the impact of public grants and scientific collaborations on subsequent nanotechnology-related publications. In this study we present the varying involvement of academic researchers and government funding to capture the influence of funded research in order to help government agencies evaluate their efficiency in financing nanotechnology research. We analyze the measures of quantity and quality of research output using time-related econometric models and compare the results between nanotechnology scientists in Canada and the United States. The results reveal that both research grants and the position of researchers in co-publication networks have a positive influence on scientific output. Our findings demonstrate that research funding yields a significantly positive linear impact in Canada and a positive non-linear impact in the United States on the number of papers and in terms of the number of citations we observe a positive impact only in the US. Our research shows that the position of scientists in past scientific networks plays an important role in the quantity and quality of papers published by nanotechnology scientists.
Keywords: Nanotechnology, Research funding, Scientific papers, Collaboration, Network
analysis 1leila.tahmooresnejad@polymtl.ca , Tel : +1 514 340 4711 x3963 2catherine.beaudry@polymtl.ca , Tel : +1 514 340 4711 x3357
* Corresponding Author: catherine.beaudry@polymtl.ca, Department of Mathematics and Industrial Engineering, Polytechnique Montreal, P.O. Box. 6079, Downtown office, Montreal, QC, H3C 3A7, Canada. Tel.: +1 514 340 4711x3357; fax: +1 514 340 4173.
3 andrea@encs.concordia.ca, Concordia Institute for Information Systems Engineering, Faculty of Engineering and Computer Science, Concordia University, 1455 Maisonneuve West, Montreal, Quebec, Canada, H3G 1M8
Introduction
Nanotechnology is an emerging technology that is considered one of the primary forces to drive future economic development. For this reason, worldwide investment in this emerging technology has increased substantially in the past two decades and governments have considerably subsidized nanotechnology-related R&D in recent years. Fitzgibbons and McNiven (2006) indicate that in Canada the main funding source for nanotechnology R&D is the Canadian government which provides the funding through different organizations: the Natural Sciences and Engineering Research Council (NSERC), Canadian Institutes for Health Research (CIHR), National Research Council (NRC), Canada Foundation for Innovation (CFI), etc. In addition to the federal funding, various activities are concentrated in specific provinces in Canada to develop nanotechnology. The British Columbia Nanotechnology Alliance, Nanotechnology Network of Ontario, NanoQuebec and NanoAlberta are the main provincial frameworks that help develop nanotechnology along with the federal programs (Dufour 2005; Allan et al. 2008; Pelley and Saner 2009).
According to Roco (2005), the United States invested approximately $1 billion US in government funding dedicated to nanotechnology R&D in 2005, 65% of which was specifically allocated to academic R&D and education. The US government nanotechnology funding has been raised mainly by the National Nanotechnology Initiative (NNI), which was launched in 2000 and consists of numerous federal agencies. Fifteen NNI agencies are responsible for the funding of nanotechnology research and development. The NNI has invested $18 billion in total since 2001, and $1.8 billion has been provided for 2013 alone. The National Institutes of Health (NIH) and the National Science Foundation (NSF) are two agencies that occupy the second largest investment rank in 2011 between the agency members of the NNI after the Department of Energy (DOE) (NNI 2013; Jacob and Lefgren 2011; Sargent 2010).
Given the magnitude of government investment in nanotechnology research in recent years, it is of great importance to measure the efficiency and productivity of research financing. The efficient allocation of government resources requires a better understanding of how funding influences scientists’ productivity and their scientific output. Such financing evaluations can help governments develop policies that will foster the development of this emerging technology.
Nanotechnology is an emerging technology that will have enormous impact on future products and processes. This technology has potential to affect economic development and gives new tools for governments to take advantage of the recent leaps in technology and science. Growing understanding of the role of public funding research in nanotechnology development will help governments to launch strategies that meet their high expectations associated with this new concept. Considering the potential new world market of nanotechnology related products, countries develop research in the field of nanotechnology to ensure that they are going to take advantage of the opportunities that are available in this area. In this study, we therefore focus on government grants rather than other funding sources. This leads to a strong necessity to study the impact of public funding, with a special focus on the public funding sources in the field of nanotechnology. We hence compare the impact of investments in Canada with that of the US, which is a leader in setting up numerous targeted nanotechnology programs and research grants in the hope of fostering future economic development. It is of great importance to realize that whether the research funding strategies have been productive in this field.
To explore the impact of public funding on scientific papers, to reflect how nanotechnology research grants influence researchers’ productivity, we utilize econometric models to measure this impact on the quantity and quality of nanotechnology-related papers. The evidence of past studies (Huang et al. 2005; Payne and Siow 2003) reveals the positive impact of government funding on research output. Because scientists increasingly work in larger teams, in addition to research financing, we wish to discuss the role that scientific networks play in the scientific production. This paper thus explores the effects that collaboration networks have on research productivity by measuring the position of these researchers within scientific co-publication networks. According to the work by Ni et al. (2011) and Breschi et al. (2006), researchers who have more connections with other scientists in networks publish more papers and tend to collaborate more with other researchers, enhancing research output.
There are some important differences between the US and the Canadian science, technology and innovation system. Although Canadian universities play key roles in basic research and produce a reasonable number of research papers, their contribution to domestic industrial research is less than that of US institutions. The majority of university research funding is provided through government grants and industry accounts for a small part in Canada whereas private funding is considerable in the US (Niosi 2000).
Our main contribution consists in further understanding how government research funding and scientific networks influence research publications in the field of nanotechnology. The remainder of the paper is organized as follows. In Section 2, the theoretical background focuses on university research funding and social network analysis, from which hypotheses are drawn concerning public grants and collaborations. In Section 3, we discuss variables, econometric models and the methodology employed. Section 4 discusses regression results and graphs, and finally Section 5 concludes.
Conceptual framework
Nanotechnology is a relatively young discipline characterized by different subfields. It generated almost a quarter trillion dollars worth of products worldwide in 2009 and $91 billion of these products found their market in the US. This emerging technology draws substantial amounts of public and private investment and its relative success encourages governments to increase their funding in nanotechnology research (Canton 1999, Freeman and Shukla 2008; Roco and Bainbridge 2005; Roco 2011).
US financial investment in nanotechnology research has been substantial in the last decade. The US government plays a central role in nanotechnology research programs and is among the 10 leading countries in nanotechnology. The US ranked first in terms of nanotechnology public funding in 2006 (Roco et al. 2011; Sargent 2008). Youtie et al. (2008) reviewed the rapid growth of nanotechnology publications in different countries between 1990 and 2006 and showed that the US has been one of the leading countries in nanotechnology research and that it has ranked first in terms of the quality of publications. Furthermore, the major US federal support of nanotechnology academic research is provided by the interagency program of the NNI which is mostly motivated by an interest in economic outcomes (Mowery 2011). The public funding of nanotechnology academic research fosters the emergence of collaboration among universities, industry and government and highlights a Triple-Helix of relationships between these organizations (Etzkowitz 2008; Leydesdorff and Meyer 2006; Schultz 2011). Niosi (2000) shows that universities in the US are frequently encouraged to collaborate more with industries and this collaboration streams industry funding toward university research.
In Canada, the majority of university research funding is provided through public funding, while private firms account for only a small part of research funding (Fitzgibbons and McNiven 2006;
Mcfetridge 1993; Niosi 2000). The Natural Sciences and Engineering Research Council (NSERC) focuses on university and industry collaborations through Industrial Chairs and Collaborative R&D programs. The Canadian Institutes for Health Research (CIHR), the Canada Foundation for Innovation (CFI) and National Research Council (NRC) are other federal agencies that provide funding for R&D (Gordon 2002).
Addressing how universities, play a significant role in knowledge-based nanotechnology research, Hullmann (2006) and Mcfetridge (1993) indeed suggest that the number of academic publications is an appropriate indicator to understand the growth of this new technology. Furthermore, the number of citations papers receive is a quality index that can properly measure the impact of researchers.
Many scholars (Hudson 2007; Lawani 1986; Moed 2005; Schoonbaert 1996) study the number of citations to measure the quality of papers and argue that high-quality papers receive significantly more citations. Despite some problems that arise in using the number of citations as a quality index for papers, it is widely used and still considered to be an appropriate indicator. For example critics such as Adler et al. (2009) highlight that citation analysis does provide worthwhile information and should be part of the evaluation process.
Following the massive investment in nanotechnology, the interest in the influence funded research has on scientific output has also increased in recent years. Huang et al. (2005) highlight that it is imperative to understand the impact of public funding on nanotechnology research output and nanotechnology development. Some scholars examine the impact of funding on scientific output and their results indicate that government R&D funding in universities increases the number of publications (Adams and Griliches 1998; Blume-Kogut et al. 2009; Fitzgibbons and McNiven 2006; Mcfetridge 1993). Payne and Siow (2003) demonstrate that a one million dollar increase in government funding in a research university yields ten additional papers. In another study in the US, Jacob and Lefgren (2007) investigate the influence of the National Institutes of Health (NIH) grants on researchers and research productivity. According to their study, NIH postdoctoral fellowshipsincrease the rate of publications by nearly twenty percent in the following five years as well as the citations received by these papers. Obtaining research funding affects the productivity of researchers in other ways, for instance, Adams et al. (2005) recognized that according to a study in the top 110 US universities, public funding significantly
affects the size of scientific teams. Scientists with prestigious awards and a large stock of federal funding are encouraged to collaborate in larger teams. This collaboration increases research quality and consequently these scientists are more cited (Sauer 1988; Adams et al. 2005). Arora et al. (1998) raised the point of a positive influence on publication quality and mentioned that it acts as a signal for the government to allocate additional funding to higher-quality researchers. Although the number of citations can be used as a proxy to measure the scientific quality of papers, we must recognize and address the disparity in citation rates of papers published in English compared to those in French, a concern evident for Canada. Poomkottayil et al. (2011) found that English papers are seven times more cited based on the Google Scholar database compared to non-English papers (German or French papers in their study). The theoretical study of Van Leeuwen et al. (2001) showed that the impact factors of non-English language journals are considerably lower than English-language journals. Due to increased interest in the bibliometric evaluation of papers in recent years, it is important to recognize that the language of publication affects such analyses.
Empirical evidence of Matthew effect can be shown at various aggregation levels: countries, research institutions and individual researchers. The Matthew effect holds that the most influential scientists gain more influence (Merton 1968; Larivière and Gingras 2010). Some studies used the number of citations as Matthew indicator and showed that specific papers, researchers or even universities are more frequently cited compared to others (Bonitz et al. 1997; Katz 1999; Tol 2009). According to Laudel (2006), scientists that have already received funding are more likely to receive more funding, which is evidence of Matthew effect in research funding. This effect can occur at the individual or department level, hence indicating that those that obtain the most funds become even more successful in subsequent grant applications.
Since the US is a leading country in nanotechnology research and research funding, in light of the impact of government research financing on nanotechnology-related scientific output and the difference between the influence of research funding in Canada and the US, we aim to probe the following hypotheses in this paper separately for Canada and the US.
Hypothesis 1: Increased public funding to nanotechnology scientists contributes to (a) more
nanotechnology-related publications and (b) higher-quality nanotechnology-related publications.
Scientists generally work in research communities and tend to publish the results in research groups. Glänzel and Schubert (2005) highlighted co-publication networks as a tangible measure of scientific collaborations. Since the collaboration of researchers is seen to be of great importance in fostering output productivity research, funding is commonly allocated to research teams, particularly when the amount of financing is rather large. Theoretical studies show a positive correlation between the collaboration of researchers and their respective scientific output. For example Newman (2001) and Balconi et al. (2004) constructed a scientist network using co-authorship information to study the interconnected nature of scientists in these networks. Ni et al. (2011) and Breschi et al. (2006) stated that scientists with central positions in the network produce more papers compared to other scientists that are less central. Velema (2012) argues that collaborative ties in co-authorship networks lead to receiving more citations. The diffusion of knowledge is thus more efficient among researchers who actively collaborate and the numerous collaborations help researchers to increase their productivity. The question we address in this paper is how evolving scientific networks influence the emergence of new publications and enhance the quality of these publications in Canada, as well as the difference in this impact between Canada and the US. In order to measure whether collaborations in Canada have a similar impact as in the US on nanotechnology scientific output, we therefore consider the following hypotheses separately for Canada and the US:
Hypothesis 2: A better network position4 of nanotechnology scientists within co-publication
networks has a positive effect on (a) the number of publications and (b) on the quality of publications.
In Canada the proportion of government-funded R&D is high compared to industrial R&D (Niosi 2000). We therefore propose in our third Hypothesis to test whether this government funding leads to scientific production of higher quality and quantity in Canada in comparison to the impact of public funding in the US:
Hypothesis 3: Increased public funding to nanotechnology scientists in Canada contributes to
(a) more nanotechnology-related publications and (b) higher-quality nanotechnology-related publications in Canada compared to increased public funding to nanotechnology scientists in the US.
Data and methodology
Data and Variables
The rapid growth of nanotechnology implies that governments have to develop a complete database of all desired information about nanotechnology development and commercial utilization (Holtz 2007). This study requires the evaluation of scientific output during the periods in which public grants were received by researchers. Our data was extracted from different databases of articles and patents to which at least one Canadian-affiliated and one American-affiliated scientist contributed: We extracted publication and authorship data from Elsevier’s Scopus using specific keyword searches, described below, for nanotechnology-related publications, while the United States Patent and Trademark Office (USPTO) provided the related patenting information for these researchers.
We chose Elsevier’s Scopus since it provides accurate and more comprehensive information regarding author affiliations, which greatly facilitates the disambiguation of author’s names, especially for data dating as far back as 1985. Scopus directly links authors and their affiliations while this feature is relatively recent in other databases. We examined other databases (JCR, Science Direct, Web of Science, Microsoft Academic Search, Scirus, Google Scholar, etc.) and realized that Scopus covers a wide diversity of fields and additional information, which was deemed more appropriate to our needs regarding an emerging multidisciplinary field that may not at first get published in the “best” journals that are currently listed in the Web of Science for instance.
The Canadian Federal granting agencies database provided information on government research financing from the National Sciences and Engineering Research Council of Canada (NSERC) and the Canadian Institutes of Health Research (CIHR). For US researchers we used Nanobank which is a dataset of scientific journal articles, patents and government grants (NIH and NSF grants) in nanotechnology (Nanobank 2013; NSF 2013 ;Zucker et al. 2011).
For the purpose of this research and in order to have precise data on nanotechnology-related publications in the US, we combined the keywords from various keyword search strategies of several scholars (Alencar et al. 2007; Fitzgibbons and McNiven 2006; Mogoutov and Kahane 2007; Noyons et al. 2003; Porter et al. 2008; Zucker and Darby 2005; Zitt and Bassecoulard
2006) while removing the redundant keywords after consulting with nanotechnology experts. We believe that the final set of keywords is quite comprehensive and is able to effectively identify articles directly related to nanotechnology.
In order to complement and clean the large data, we extracted data using a combination of Scopus and Google Scholar since the latter enabled us to search the full text of publications for nanotechnology-related keywords. We used the “Publish or Perish” software to filter the results in Google Scholar and then matched each identified article with the data from Scopus. This methodology allowed us to combine an in-depth full-text search of Google Scholar with well-structured data from Scopus.
We then merged our data from different sources using a unique ID for each individual scientist. A considerable amount of work was required to perform the disambiguation of scientists’ names in merging different publishing, patenting and funding databases. We performed a check of individuals’ name to avoid ambiguity and bias in our data. We then created a panel dataset in which we compiled yearly information for each individual scientist over the period 1985 to 2005. Selecting for the regressions the years 1996 onwards yields 33,655 individual US scientists and 3,684 Canadian scientists in our final panel data5.
In relation to our hypotheses, let us first define the variables measuring the quantity and quality of papers (H1a and H1b). The variable nbPaper counts the number of papers that are published every year by an individual scientist. It is used to measure the impact of government funding on the quantity of scientific output. We used three spans of citation counts, nbCitation, that the articles of a scientist received within three, five and seven years after the publication year to measure paper quality. We found more consistent results using five-year citations (nbCitation5) for our time period (1996-2005).
This study addresses the impact that funding granted for nanotechnology academic research has on scientific output. We thus calculate the average amount of public funding received over three years (GovGrant3) lagged by one-year to account for the time lapse between receiving government grants and generating scientific output. We also add the square of GovGrant3, to investigate the non-linear effect of public funding. This will allow the validation of hypothesis 1.
5 Even though the regressions are estimated on a sample starting in 1996, we extracted data from 1985 onwards to build the ‘career age’ variable described below.
To examine our second hypothesis we explore how a researcher’s position in his/her co-authorship network influences his/her scientific output by computing two measures related to their network position: betweenness centrality (BetweenCent) and cliquishness or clustering coefficient (Cliquishness). Betweenness centrality is generally employed to evaluate the importance of a researcher as an intermediary in a network and refers to the proportion of all geodesic distances6 between two scientists that include the specific scientist. This measure indicates which researcher potentially controls the flow of knowledge between pairs of scientists (Benedictis and Tajoli 2008;Izquierdo and Hanneman 2006). Cliquishness is computed using the egocentric density7 that refers to the likelihood that two scientists who are both connected to a specific third scientist are also connected to each other (Barabasi 2002; Singh 2007). These two variables will allow the validation of hypothesis 2 (H2a and H2b).
The evolution of collaborations between scientists over years was analyzed using three-year co-publication sub-networks. An important consideration relates to the time period of collaboration networks. Fleming et al. (2007) used three-year windows to analyze the effect of past network structure on collaborative creativity. Nerkar and Paruchuri (2005) also opt for three-year windows to study the R&D activities in inventor networks. We therefore created three-year co-authorship sub-networks8 for all the three-year moving intervals using the social network
analysis software Pajek, which is considered to be very suitable for the analysis of large networks (Batagelj and Mrvar 1998).
In addition to the variables of interest, another issue that we take into account is non-publication innovative output of researchers that may restrict their scientific output. Debates have arisen around the question of whether the involvement of academics in patenting can produce negative impacts on their publication record. Despite the concerns about the substitution effects of university patents on publications, Geuna and Nesta (2006) argue that university papers and patents are not really substitutes, and a growing literature (e.g. Azoulay et al. 2006; Louis et al. 1989; Carayol and Matt, 2004) is in fact proposing that patents and publications are complements. Moreover, Van Looy et al. (2004, 2006) show that university researchers who are involved in patenting activities publish more articles in applied fields and Azoulay (2009),
6 Geodesic distance is a shortest path between any particular pair of researchers in a scientific network.
7 Egocentric density is the density among a researcher’s direct connections and indicates the fraction of possible links present in the network (Koput, 2010).
Czarnitzki, et al. (2007) and Wong and Sing (2010) reveal that the patenting activity of academic researchers positively influences publication output in universities. In this regard, we study the influence of academic researchers’ nanotechnology-related patents from the past three years to examine whether there is a correlation between these patents and their future publications (nbPast3Pat). We also add the square of nbPast3Pat to investigate the non-linear effect of researchers’ past patents on scientific output.
Governments implement various mechanisms to allocate funding to universities based on research performance (Geuna et al. 2003; Liefner 2003). A notable concern in our study is that researchers with a higher performance receive more funding from governments: this causes potential endogeneity due to simultaneity and omitted variable bias. To deal with this potential endogeneity, we employ instrumental variables techniques in our econometrics models to correct for endogeneity and add a number of control variables in addition to the variables of interest. We first identify the career age (CareerAge) of nanotechnology scientists as the time elapsed since their first publication in nanotechnology. This variable shows how long a scientist has been active in this field and is a proxy for experience of a scientist in this field over time. Some scholars such as Cole (1979), Costas et al. (2010) and Stephan and Levin (1993) highlight the influence of career age on the performance of scientists to account for the fact that older scientists are more productive and more likely to receive grants. To consider the fact that the past articles are used to evaluate the proposals that lead to the granting of public funding, we use the average number of papers published by researchers in the past three years with a one-year lag (nbAvgPapers3).
Model specification
There are various models for count data that have been used in economics and industrial organizations. The Poisson model is the most frequently employed method in such modeling (Hausman et al. 1984; King 1989; Riphahn et al. 2003). Because of the restriction on the distribution in the Poisson model regarding over-dispersion, some researchers find that the Negative Binomial Model (NB) is more appropriate (Greene 2008; Hilbe 2011). Many scholars have employed one of these two methods to analyze count data (Wang et al. 1998; Fleming and Sorenson 2001; Maurseth and Verspagen 2002; Mowery et al. 2002; Payne and Siow 2003; Tsionas 2010; Petruzzelli 2011). In the Poisson model, it is assumed that the conditional variance
equals the mean. The dependent variable 𝑦!" in Equation (1) follows a Poisson distribution where the mean is function of the coefficients 𝛽 and of the covariates 𝑥!" as shown in Equation (2), (𝑖
indexes individual researchers and 𝑡 indexes years).
Pr(yit xit) = e−λitλ it yit yit! (1) E(yit xit) =λit= e xitβ (2)
The Poisson model imposes equi-dispersion as shown by Equation (3):
E(y
itx
it) = Var[y
itx
it] =
λ
it (3)If the variance of yitis larger than the mean (
E(y
itx
it) < Var[y
itx
it]
), we have over-dispersion in the data, which implies that the Negative Binomial Regression is a proper alternative for this method. 𝐸𝑥𝑝 𝜀!" is assumed to follow a gamma distribution where the variance equals α and the mean equals 1 (Hausman et al. 1984; King 1989; Greene 2008), which yields equations (4) and (5).λ
it= Exp(β x
it+
ε
it)
(4)Var[yit xit] = E(yit xit) 1+α E(y
(
!" it xit#$)
(5)We thus use both the Poisson and Negative Binomial models in our regressions to find the most consistent and significant results in measuring the impact of government grants and of network position on the quantity of scientific publications (represented by nbPaperit of academic researcher i in year t) and on the publication quality (represented by nbCitation5it). In case of having excessive zeros in our count data, we consider inflated Poisson vs. Poisson and zero-inflated negative binomial vs. negative binomial model and use Voung test as suggested by Vuong (1989). Zero-inflated models allow for complication of analyzing datasets with an excessive number of outcome zeros (Greene 1994; Long 1997; Vuong 1989). For the given data, Vuong test proved zero-inflated models are superior over standard Poisson and negative binomial models.
We express the model to be estimated in Equation (6), which shows our two dependent variables explained by the same function. We examined a variety of lag structures during the course of our study and presented models are the models which yield the most consistent results. Logically, however, one would think that the team is formed first, then they apply for funding and do the work to finally publish. Learning from collaborators and integrating into knowledge networks needs time to lead to further jointly developed publications. So we would expect that the network variables to be lagged by at least two years and the funding variables to be lagged by at least one year. nbPaperit nbCitation5it ! " # $ % & = f GovGrant3it−1
(
)
, GovGrant3!"(
it−1)
$%2nbPast3Patit,[nbPast3Patit]2, BetweenCent3
it−2, Cliquishness3it−2, Cliquishness3it−2)
[
]
2, nbPast3Patit× BetweenCent3it−2, BetweenCent3it−2× Cliquishness3it−2, dt)) * + + + + + , -. . . . . (6)
We also test the moderating effect between our variables by introducing interactive variables. This helps us to examine whether betweenness centrality has an intrinsic relation with patenting and cliquishness, and it also moderates the influence of these two measures on the dependent variables. To account for the fact that funding may affect both scientific output and the number of patents to which a researcher may have contributed, we treat the amount of grants received as endogenous. Given the potential endogeneity, we test three instruments for this variable to correct this problem. One of the alternatives that is suggested in econometric studies to estimate the parameters in this model on a set of instrumental variables is the Two Stage Least Squares (2SLS) method (Biro 2009; Terza et al. 2008; Stephan et al. 2007).
We thus express the first and second stage of our estimations in Equation (7) to account for the endogeneity bias on the average amount of grants received over three years by scientists in nanotechnology. The first stage regression estimates the endogenous variable on a set of instruments and the predicted value is then computed and added to the second stage regressions. The resulting first stage and second stage regressions are given by:
GovGrant3it−l = f (CareerAgeit−1,CareerAge
2
it−1, nbAvgPaper3it−l,Variables2 nd Stage, dt) 2SLS : nbPaperit nbCitation5it " # $ % & ' = f
(predicted1st GovGrant3
(
it−1)
, predicted1st GovGrant3"#(
it−1)
%&2nbPast3Patit,[nbPast3Patit]2, BetweenCent3
it−2,Cliquishness3it−2, Cliquishness3it−2)
[
]
2, BetweenCent3it−2× Cliquishness3it−2, BetweenCent3it−2× Cliquishness3it−2, dt)) * + + + + + , -. . . . . ) * + + + + + + + + + + , -. . . . . . . . . . (7)
Regression Results
Our study evaluates the impact of research funding and collaborations on scientific productions by measuring the quantity and quality of publications. The results showed in this section present the most reliable results. As mentioned previously we examined a variety of lag structures (one, two and three years) to investigate the most appropriate time period for each variable. As expected, the most significant results were obtained with a one-year lag for government grants and a two-year lag for the network.
Two groups of results are presented in which the first group does not account for potential endogeneity of public funding and the second group represents the results of the second stage for 2SLS regressions.
We find that the zero-inflated Poisson model (clustering method) yields significant and consistent results and hence present only this model in the paper9 as justified by Hall and Ziedonis (2001). We start from a simple model and hierarchically add quadratic term of variables to the model. The second stage of four models, shown in Table 1 and Table 2 for the number of papers and Table 3 and Table 4 for the number of citations, enable us to study the factors that influence scientific production in Canada and the US (for the first stage of regressions see Appendix A, and Poisson and xtpoisson regressions are presented in Appendix D).
9 We estimated more than 15 models as we considered and neglected potential endogeneity using panel data via xtnbreg and xtpoisson. We also
performed non-paneled regressions using the clustering method of nbreg and Poisson to account for repeated measures of the same individual scientist. Note that we tried zero-inflated negative binomial model as well, but it does not work on our data for the number of papers and the results for the number of citations are similar to zero-inflated Poisson model.
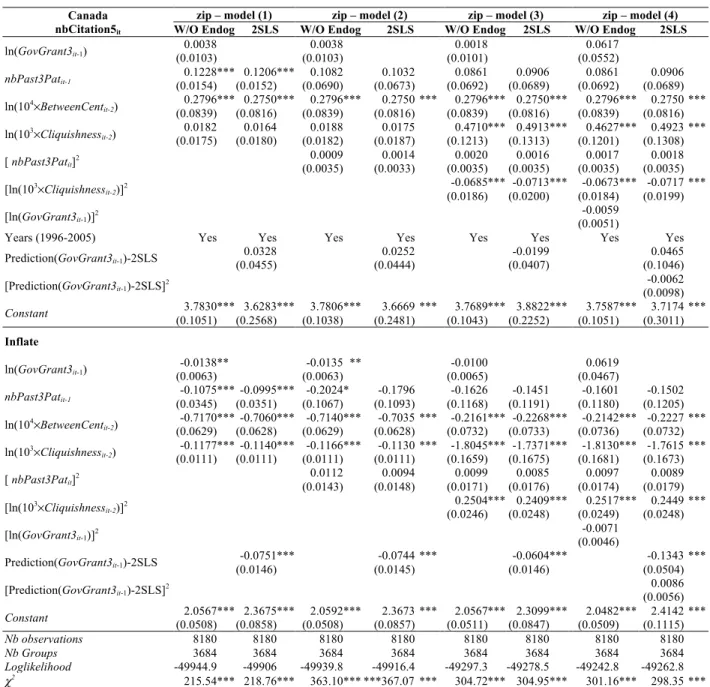
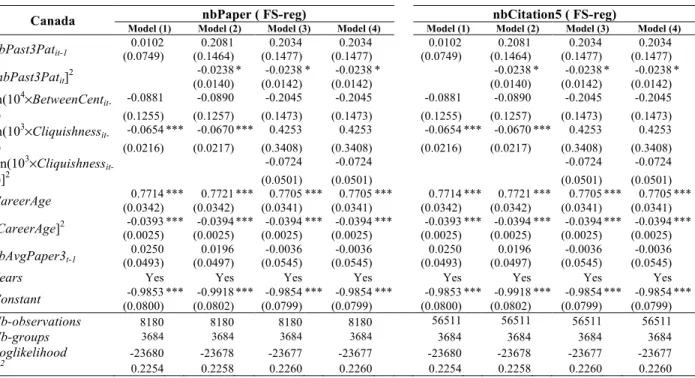
Table 1 Impact of public funding on nanotech papers in Canada - Second stage of regression results of zero-inflated Poisson (Standard errors in parentheses and *** p<0.01, ** p<0.05, * p<0.1)
Canada
nbPaperit
zip – model (1) zip – model (2) zip – model (3) zip – model (4)
W/O Endog 2SLS W/O Endog 2SLS W/O Endog 2SLS W/O Endog 2SLS
ln(GovGrant3it-1) (0.0086) -0.0056 -0.0055 (0.0087) -0.0088 (0.0085) (0.0480) 0.0873 * nbPast3Patit-1 (0.0149) 0.1045 *** 0.0962 *** 0.1506 *** 0.1293 ** 0.1120 ** (0.0149) (0.0527) (0.0520) (0.0551) (0.0546) 0.1103 ** 0.1194 ** (0.0552) (0.0545) 0.1101 ** ln(104×BetweenCent it-2) (0.0515) 0.3492 *** 0.3330 *** 0.3480 *** 0.3340 *** 0.1782 *** 0.1795 *** 0.1847 *** (0.0487) (0.0508) (0.0487) (0.0509) (0.0510) (0.0503) (0.0509) 0.1792 *** ln(103×Cliquishness it-2) (0.0127) 0.0495 *** 0.0429 *** 0.0476 *** 0.0416 *** 0.7381 *** 0.7147 *** 0.7233 *** (0.0133) (0.0131) (0.0137) (0.0932) (0.1014) (0.0918) (0.1010) 0.7147 *** [ nbPast3Patit]2 (0.0030) -0.0033 (0.0029) -0.0015 -0.0016 (0.0034) (0.0033) -0.0014 (0.0034) -0.0022 (0.0034) -0.0012 [ln(103×Cliquishness it-2)]2 -0.1047 *** -0.1015 *** -0.1026 *** -0.1017 *** (0.0143) (0.0154) (0.0141) (0.0153) [ln(GovGrant3it-1)]2 (0.0046) -0.0095 **
Years (1996-2005) Yes Yes Yes Yes Yes Yes Yes Yes Prediction(GovGrant3it-1)-2SLS (0.0375) 0.0890 ** (0.0363) 0.0801 ** (0.0319) 0.0126 (0.0884) 0.0688 [Prediction(GovGrant3it-1)-2SLS]2 -0.0051 (0.0086) Constant (0.0812) 0.7147 *** 0.2103 (0.2164) 0.7211 *** 0.2656 (0.0802) (0.2082) 0.6965 *** 0.5845 *** 0.6842 *** (0.0826) (0.1822) (0.0830) (0.2504) 0.4375 * Inflate ln(GovGrant3it-1) (0.0073) -0.0124 * -0.0120 (0.0073) -0.0101 (0.0075) 0.1244 ** (0.0598) nbPast3Patit-1 (0.0350) (0.0352) (0.1073) -0.0977 *** -0.0940 *** -0.1999 * (0.1093) -0.1889 * -0.1721 (0.1181) (0.1200) -0.1617 -0.1638 (0.1193) (0.1215) -0.1673 ln(104×BetweenCent it-2) (0.0667) (0.0669) (0.0668) -0.6803 *** -0.6729 *** -0.6763 *** -0.6691 *** -0.1940 ** -0.1995 ** -0.1853 ** (0.0670) (0.0779) (0.0778) (0.0790) (0.0777) -0.1943 ** ln(103×Cliquishness it-2) (0.0127) (0.0127) (0.0128) -0.0989 *** -0.0981 *** -0.0984 *** -0.0975 *** -1.6485 *** -1.6148 *** -1.6730 *** (0.0128) (0.1779) (0.1782) (0.1831) (0.1773) -1.6418 *** [ nbPast3Patit]2 (0.0144) 0.0126 (0.0148) 0.0118 0.0121 (0.0172) (0.0176) 0.0113 (0.0174) 0.0114 (0.0178) 0.0117 [ln(103×Cliquishness it-2)]2 (0.0264) 0.2286 *** 0.2239 *** 0.2322 *** (0.0265) (0.0272) (0.0263) 0.2282 *** [ln(GovGrant3it-1)]2 (0.0059) -0.0132 ** Prediction(GovGrant3it-1)-2SLS (0.0176) -0.0391 ** (0.0175) -0.0401 ** (0.0174) -0.0390 ** (0.0671) -0.1041 [Prediction(GovGrant3it-1)-2SLS]2 (0.0072) 0.0080 Constant (0.0635) (0.1105) (0.0637) 1.5421 *** 1.6764 *** 1.5439 *** 1.6864 *** 1.5334 *** 1.6848 *** 1.5165 *** (0.1097) (0.0643) (0.1053) (0.0652) (0.1454) 1.7610 *** Nb observations Nb Groups 8180 8180 8180 8180 8180 8180 8180 8180 3684 3684 3684 3684 3684 3684 3684 3684 Loglikelihood -6801.2 -6783.95 -6796.89 -6782.06 -6652.18 -6651.25 -6644.2 -6649.16 c2 200.40 *** 178.09 *** 185.02 *** 165.81 *** 238.11 *** 206.49 *** 246.22 ***205.61 ***
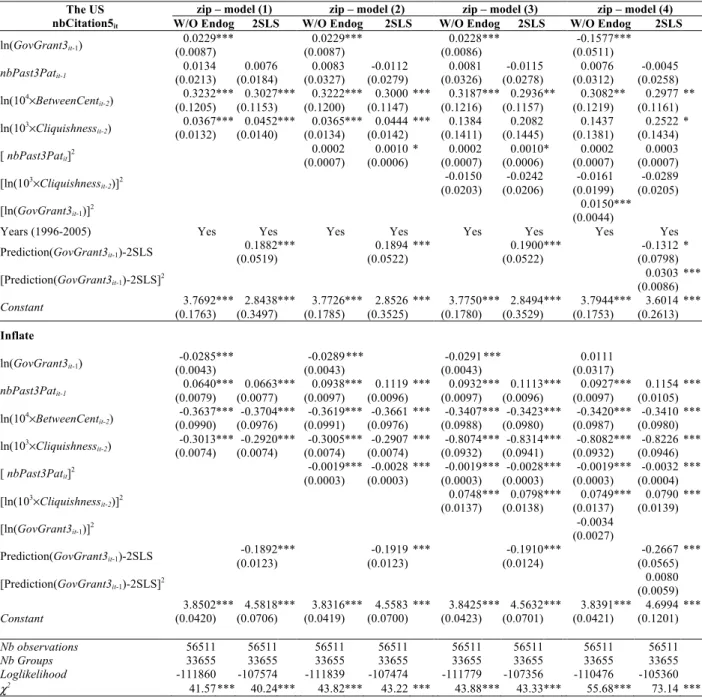
Table 2 Impact of public funding on nanotech papers in the US - Second stage of regression results of zero-inflated Poisson (Standard errors in parentheses and *** p<0.01, ** p<0.05, * p<0.1)
The US
nbPaperit
zip – model (1) zip – model (2) zip – model (3) zip – model (4)
W/O Endog 2SLS W/O Endog 2SLS W/O Endog 2SLS Endog W/O 2SLS
ln(GovGrant3it-1) (0.0037) 0.0264 *** 0.0264 *** (0.0037) 0.0264 *** (0.0037) (0.0303) -0.0530 * nbPast3Patit-1 (0.0089) 0.0035 (0.0075) -0.0006 0.0050 (0.0130) (0.0110) -0.0157 0.0054 (0.0130) (0.0110) -0.0156 (0.0131) 0.0058 (0.0094) -0.0062 ln(104×BetweenCent it-2) (0.0595) 0.1646 *** 0.1377 ** 0.1646 *** 0.1347 ** 0.1633 *** (0.0573) (0.0596) (0.0573) (0.0593) (0.0570) 0.1296 ** 0.1609 *** 0.1272 ** (0.0596) (0.0564) ln(103×Cliquishness it-2) (0.0059) 0.0865 *** 0.0921 *** 0.0865 *** 0.0912 *** 0.2135 *** (0.0059) (0.0060) (0.0059) (0.0674) (0.0686) 0.2781 *** 0.2111 *** 0.3243 *** (0.0670) (0.0672) [ nbPast3Patit]2 (0.0004) -0.0001 (0.0003) 0.0008 ** -0.0001 (0.0004) (0.0003) 0.0008 ** -0.0001 (0.0004) (0.0003) -0.0001 [ln(103×Cliquishness it-2)]2 -0.0187 * -0.0276 *** -0.0184 * -0.0320 *** (0.0098) (0.0099) (0.0097) (0.0097) [ln(GovGrant3it-1)]2 (0.0026) 0.0067 **
Years (1996-2005) Yes Yes Yes Yes Yes Yes Yes Yes Prediction(GovGrant3it-1)-2SLS (0.0238) 0.2246 *** (0.0239) 0.2267 *** (0.0238) 0.2272 *** (0.0379) -0.1958 *** [Prediction(GovGrant3it-1 )-2SLS]2 0.0400 *** (0.0037) Constant (0.0798) 0.5491 *** -0.5575 *** 0.5482 *** -0.5560 *** 0.5500 *** (0.1586) (0.0798) (0.1583) (0.0796) (0.1579) -0.5590 *** 0.5617 *** 0.4177 *** (0.0789) (0.1205) Inflate ln(GovGrant3it-1) (0.0030) -0.0143 *** -0.0147 *** (0.0030) -0.0148 (0.0030) *** -0.0078 (0.0233) nbPast3Patit-1 (0.0050) (0.0049) (0.0079) 0.0518 *** 0.0532 *** 0.0763 *** 0.0890 *** 0.0760 *** (0.0086) (0.0080) (0.0086) 0.0885 *** 0.0758 *** 0.0951 *** (0.0080) (0.0074) ln(104×BetweenCent it-2) (0.1175) (0.1212) (0.1177) -0.5410 *** -0.5253 *** -0.5390 *** -0.5228 *** -0.5070 *** (0.1218) (0.1160) (0.1201) -0.4922 *** -0.5097 *** -0.4875 *** (0.1168) (0.1195) ln(103×Cliquishness it-2) (0.0056) (0.0058) (0.0056) -0.3030 *** -0.2873 *** -0.3025 *** -0.2863 *** -0.8107 *** (0.0058) (0.0796) (0.0825) -0.7937 *** -0.8122 *** -0.7790 *** (0.0797) (0.0820) [nbPast3Patit]2 (0.0004) -0.0015 *** -0.0022 *** -0.0015 *** (0.0004) (0.0004) (0.0004) -0.0022 *** -0.0015 *** -0.0029 *** (0.0004) (0.0003) [ln(103×Cliquishness it-2)]2 (0.0117) 0.0751 *** (0.0121) 0.0750 *** 0.0753 *** 0.0739 *** (0.0117) (0.0121) [ln(GovGrant3it-1)]2 (0.0020) -0.0007 Prediction(GovGrant3it-1)-2SLS (0.0126) -0.1094 *** (0.0127) -0.1090 *** (0.0128) -0.1078 *** (0.0362) -0.3372 *** [Prediction(GovGrant3it-1 )-2SLS]2 (0.0036) 0.0205 *** Constant (0.0292) (0.0816) (0.0295) 2.2126 *** 2.5099 *** 2.1952 *** 2.4759 *** 2.1993 *** (0.0817) (0.0297) (0.0821) 2.4735 *** 2.2021 *** 3.0163 *** (0.0294) (0.0853) Nb observations Nb Groups 56511 33655 56511 33655 33655 56511 56511 33655 56511 33655 56511 33655 56511 33655 56511 33655 Loglikelihood -31075.8 -30079.1 -31064.7 30052.5 - -31029.5 -30016.6 -31003.1 29717.7 -χ2 454.95 *** 502.94 *** 460.95 *** 508.74 *** 460.52 ****** 518.98 468.44 *** 804.35 ***
Table 3 Impact of public funding on nanotech papers’ quality in Canada - Second stage of regression results of zero-inflated Poisson (Standard errors in parentheses and *** p<0.01, ** p<0.05, * p<0.1)
Canada nbCitation5it
zip – model (1) zip – model (2) zip – model (3) zip – model (4)
W/O Endog 2SLS W/O Endog 2SLS W/O Endog 2SLS W/O Endog 2SLS
ln(GovGrant3it-1) (0.0103) 0.0038 0.0038 (0.0103) 0.0018 (0.0101) (0.0552) 0.0617 nbPast3Patit-1 (0.0154) 0.1228 *** 0.1206 *** 0.1082 (0.0152) (0.0690) (0.0673) 0.1032 0.0861 (0.0692) (0.0689) 0.0906 0.0861 (0.0692) (0.0689) 0.0906 ln(104×BetweenCent it-2) (0.0839) 0.2796 *** 0.2750 *** 0.2796 *** (0.0816) (0.0839) (0.0816) 0.2750 *** 0.2796 *** 0.2750 *** 0.2796 *** 0.2750 *** (0.0839) (0.0816) (0.0839) (0.0816) ln(103×Cliquishness it-2) (0.0175) 0.0182 (0.0180) 0.0164 0.0188 (0.0182) (0.0187) 0.0175 0.4710 *** 0.4913 *** 0.4627 *** 0.4923 *** (0.1213) (0.1313) (0.1201) (0.1308) [ nbPast3Patit]2 (0.0035) 0.0009 (0.0033) 0.0014 0.0020 (0.0035) (0.0035) 0.0016 (0.0035) 0.0017 (0.0035) 0.0018 [ln(103×Cliquishness it-2)]2 -0.0685 *** -0.0713 *** -0.0673 *** -0.0717 *** (0.0186) (0.0200) (0.0184) (0.0199) [ln(GovGrant3it-1)]2 (0.0051) -0.0059
Years (1996-2005) Yes Yes Yes Yes Yes Yes Yes Yes Prediction(GovGrant3it-1)-2SLS (0.0455) 0.0328 (0.0444) 0.0252 (0.0407) -0.0199 (0.1046) 0.0465 [Prediction(GovGrant3it-1)-2SLS]2 -0.0062 (0.0098) Constant (0.1051) 3.7830 *** 3.6283 *** 3.7806 *** (0.2568) (0.1038) (0.2481) 3.6669 *** 3.7689 *** 3.8822 *** 3.7587 *** 3.7174 *** (0.1043) (0.2252) (0.1051) (0.3011) Inflate ln(GovGrant3it-1) (0.0063) -0.0138 ** -0.0135 ** (0.0063) -0.0100 (0.0065) 0.0619 (0.0467) nbPast3Patit-1 (0.0345) (0.0351) (0.1067) -0.1075 *** -0.0995 *** -0.2024 * (0.1093) -0.1796 -0.1626 (0.1168) (0.1191) -0.1451 -0.1601 (0.1180) (0.1205) -0.1502 ln(104×BetweenCent it-2) (0.0629) (0.0628) (0.0629) -0.7170 *** -0.7060 *** -0.7140 *** (0.0628) -0.7035 *** -0.2161 *** -0.2268 *** -0.2142 *** -0.2227 *** (0.0732) (0.0733) (0.0736) (0.0732) ln(103×Cliquishness it-2) (0.0111) (0.0111) (0.0111) -0.1177 *** -0.1140 *** -0.1166 *** (0.0111) -0.1130 *** -1.8045 *** -1.7371 *** -1.8130 *** -1.7615 *** (0.1659) (0.1675) (0.1681) (0.1673) [ nbPast3Patit]2 (0.0143) 0.0112 (0.0148) 0.0094 0.0099 (0.0171) (0.0176) 0.0085 (0.0174) 0.0097 (0.0179) 0.0089 [ln(103×Cliquishness it-2)]2 (0.0246) 0.2504 *** 0.2409 *** 0.2517 *** 0.2449 *** (0.0248) (0.0249) (0.0248) [ln(GovGrant3it-1)]2 (0.0046) -0.0071 Prediction(GovGrant3it-1)-2SLS (0.0146) -0.0751 *** (0.0145) -0.0744 *** (0.0146) -0.0604 *** (0.0504) -0.1343 *** [Prediction(GovGrant3it-1)-2SLS]2 (0.0056) 0.0086 Constant (0.0508) (0.0858) (0.0508) 2.0567 *** 2.3675 *** 2.0592 *** (0.0857) 2.3673 *** 2.0567 *** 2.3099 *** 2.0482 *** 2.4142 *** (0.0511) (0.0847) (0.0509) (0.1115) Nb observations Nb Groups 8180 8180 8180 8180 8180 8180 8180 8180 3684 3684 3684 3684 3684 3684 3684 3684 Loglikelihood -49944.9 -49906 -49939.8 -49916.4 -49297.3 -49278.5 -49242.8 -49262.8 χ2 215.54 *** 218.76 *** 363.10 *** ***367.07 *** 304.72 *** 304.95 *** 301.16 *** 298.35 ***
Table 4 Impact of public funding on nanotech papers’ quality in the US - Second stage of regression results of zero-inflated Poisson (Standard errors in parentheses and *** p<0.01, ** p<0.05, * p<0.1)
The US
nbCitation5it
zip – model (1) zip – model (2) zip – model (3) zip – model (4)
W/O Endog 2SLS W/O Endog 2SLS W/O Endog 2SLS W/O Endog 2SLS
ln(GovGrant3it-1) (0.0087) 0.0229 *** 0.0229 *** (0.0087) 0.0228 *** (0.0086) (0.0511) -0.1577 *** nbPast3Patit-1 (0.0213) 0.0134 (0.0184) 0.0076 0.0083 (0.0327) (0.0279) -0.0112 0.0081 (0.0326) (0.0278) -0.0115 (0.0312) 0.0076 (0.0258) -0.0045 ln(104×BetweenCent it-2) (0.1205) 0.3232 *** 0.3027 *** 0.3222 *** 0.3000 *** 0.3187 *** 0.2936 ** 0.3082 ** (0.1153) (0.1200) (0.1147) (0.1216) (0.1157) (0.1219) (0.1161) 0.2977 ** ln(103×Cliquishness it-2) (0.0132) 0.0367 *** 0.0452 *** 0.0365 *** 0.0444 *** 0.1384 (0.0140) (0.0134) (0.0142) (0.1411) (0.1445) 0.2082 0.1437 (0.1381) (0.1434) 0.2522 * [ nbPast3Patit]2 (0.0007) 0.0002 (0.0006) 0.0010 * (0.0007) 0.0002 (0.0006) 0.0010 * 0.0002 (0.0007) (0.0007) 0.0003 [ln(103×Cliquishness it-2)]2 -0.0150 -0.0242 -0.0161 -0.0289 (0.0203) (0.0206) (0.0199) (0.0205) [ln(GovGrant3it-1)]2 (0.0044) 0.0150 ***
Years (1996-2005) Yes Yes Yes Yes Yes Yes Yes Yes Prediction(GovGrant3it-1)-2SLS (0.0519) 0.1882 *** (0.0522) 0.1894 *** (0.0522) 0.1900 *** (0.0798) -0.1312 * [Prediction(GovGrant3it-1)-2SLS]2 0.0303 *** (0.0086) Constant (0.1763) 3.7692 *** 2.8438 *** 3.7726 *** 2.8526 *** 3.7750 *** 2.8494 *** 3.7944 *** 3.6014 *** (0.3497) (0.1785) (0.3525) (0.1780) (0.3529) (0.1753) (0.2613) Inflate ln(GovGrant3it-1) (0.0043) -0.0285 *** -0.0289 *** (0.0043) -0.0291 *** (0.0043) 0.0111 (0.0317) nbPast3Patit-1 (0.0079) (0.0077) (0.0097) 0.0640 *** 0.0663 *** 0.0938 *** 0.1119 *** 0.0932 *** 0.1113 *** 0.0927 *** 0.1154 *** (0.0096) (0.0097) (0.0096) (0.0097) (0.0105) ln(104×BetweenCent it-2) (0.0990) (0.0976) (0.0991) -0.3637 *** -0.3704 *** -0.3619 *** -0.3661 *** -0.3407 *** -0.3423 *** -0.3420 *** -0.3410 *** (0.0976) (0.0988) (0.0980) (0.0987) (0.0980) ln(103×Cliquishness it-2) (0.0074) (0.0074) (0.0074) -0.3013 *** -0.2920 *** -0.3005 *** -0.2907 *** -0.8074 *** -0.8314 *** -0.8082 *** -0.8226 *** (0.0074) (0.0932) (0.0941) (0.0932) (0.0946) [ nbPast3Patit]2 (0.0003) -0.0019 *** -0.0028 *** -0.0019 *** -0.0028 *** -0.0019 *** -0.0032 *** (0.0003) (0.0003) (0.0003) (0.0003) (0.0004) [ln(103×Cliquishness it-2)]2 (0.0137) 0.0748 *** 0.0798 *** 0.0749 *** 0.0790 *** (0.0138) (0.0137) (0.0139) [ln(GovGrant3it-1)]2 (0.0027) -0.0034 Prediction(GovGrant3it-1)-2SLS (0.0123) -0.1892 *** (0.0123) -0.1919 *** (0.0124) -0.1910 *** (0.0565) -0.2667 *** [Prediction(GovGrant3it-1)-2SLS]2 (0.0059) 0.0080 Constant (0.0420) 3.8502 *** 4.5818 *** 3.8316 *** 4.5583 *** 3.8425 *** 4.5632 *** 3.8391 *** 4.6994 *** (0.0706) (0.0419) (0.0700) (0.0423) (0.0701) (0.0421) (0.1201) Nb observations Nb Groups 56511 33655 56511 33655 33655 56511 56511 33655 56511 33655 56511 33655 56511 33655 56511 33655 Loglikelihood -111860 -107574 -111839 -107474 -111779 -107356 -110476 -105360 χ2 41.57 *** 40.24 *** 43.82 *** 43.22 *** 43.88 *** 43.33 *** 55.68 *** 73.14 ***
Before turning to the second stage regressions, let us briefly address the first stage results. Among the instruments used to correct for endogeneity in the first stage of our model,
CareerAge are strongly significant to explain the endogenous variable GovGrant3 in both
countries. Surprisingly we cannot find a significant effect of nbAvgPaper3 on future grants in Canada. However, Arora and Gambardella (1998) found that the past performance indirectly affects the probability of receiving grants in future. This may be due to the fact that
nanotechnology is a young discipline in Canada and that researchers only recently started publishing in this field. In contrast this variable is strongly significant in the US. The effect of nanotechnology being a young discipline also becomes apparent when we examine the non-linear impact of CareerAge. We observe a negative coefficient for the square of age on the scientific production. This result is consistent with the findings of Costas et al. (2010) who highlight the fact that as scientists grow older, they are likely to be more reluctant to be involved in new fields. However, we need to be careful in proposing this interpretation, as there have been
many mixed findings on this issue. Rappa and Debackere (1993) highlight that the relationship between age and the ability in science is influenced by numerous factors such as substantive and methodological perceptions, specialized interests and affiliations with certain schools of thoughts, and not only the age of scientists. Accordingly, Wray (2003; 2004) examined the contribution of young scientists in new scientific specialties and found that it is middle-aged scientists that are responsible for significant discoveries. There is an extended and inconclusive literature on age in science, which we will not review here.
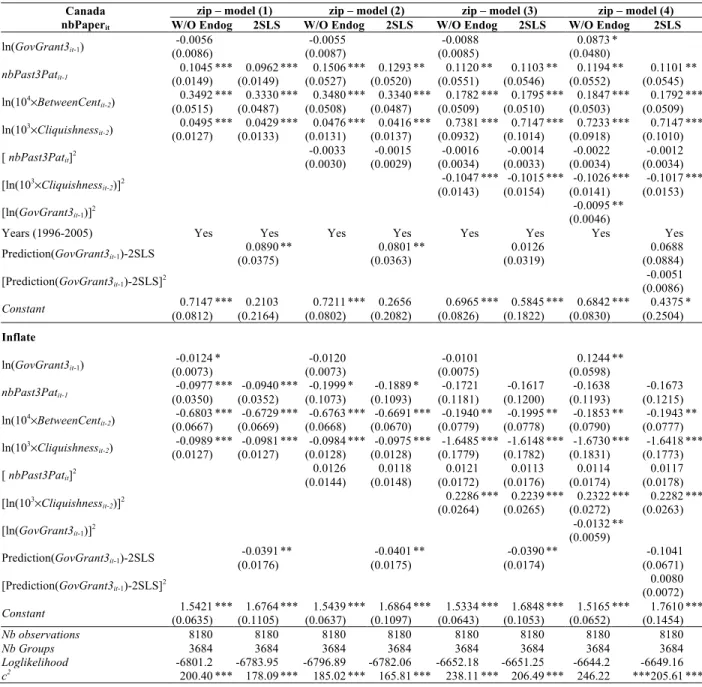
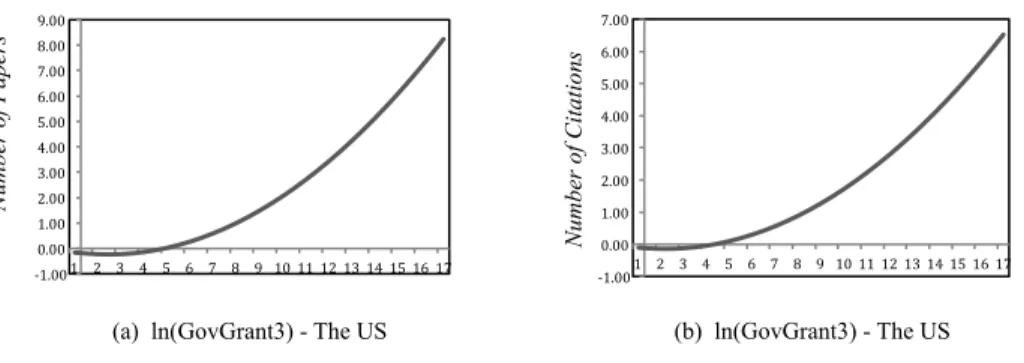
In the second stage regressions, we find that the number of publications rises as public funding increases. Our findings in Canada and the US show an increasing linear trend for the amount of publications. The results show that more simple models may be better able to represent the influence of government funding in Canada as we captured endogeneity in the first two models, but the additional parameters may not be useful. In the US when we increase the complexity of model by adding the quadratic term of government funding in model (4), we observe a right- hand of a U-shaped curve which also shows the increasing trend of the number of articles (Fig. 1.a).
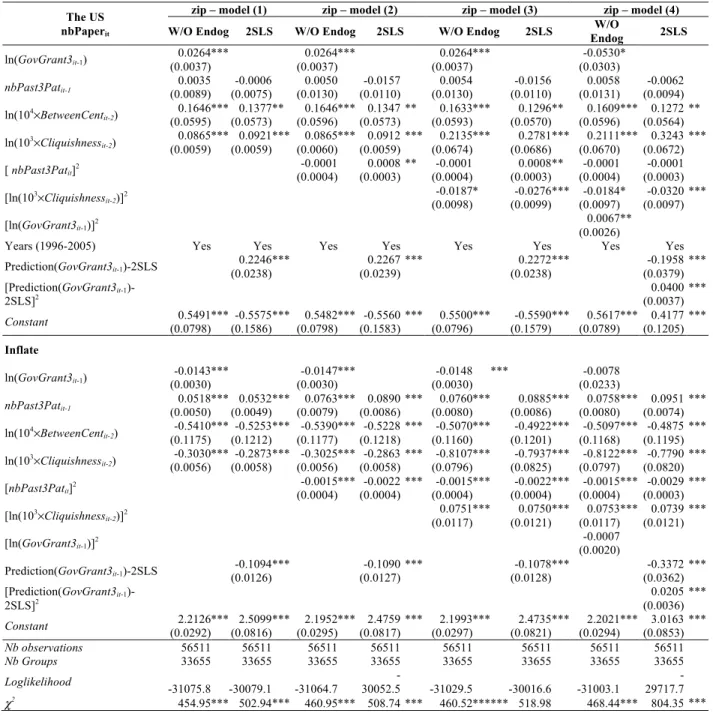
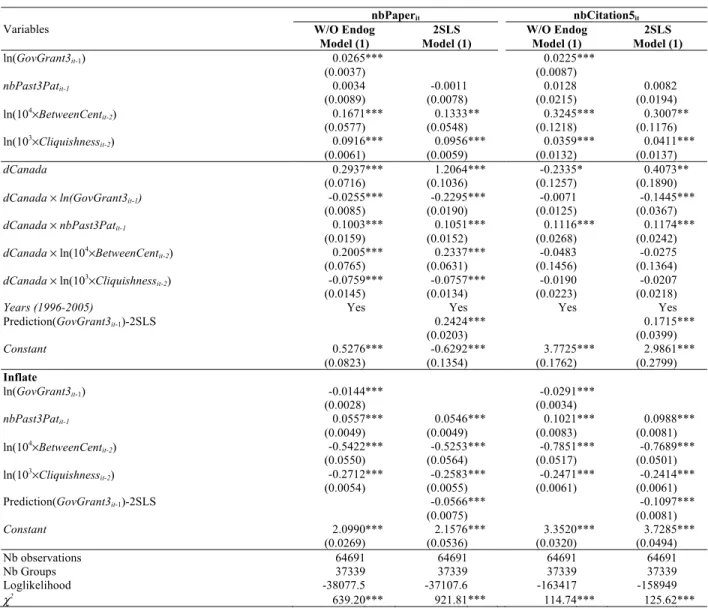
In regard to the influence of public funding on the number of citations (nbCitation5), the average amount of government funding seems has no impact for Canada to enhance the quality of publications, but exhibiting a J-shaped relationship beyond a point for the US. This observation highlights that beyond the minimum value of the J-shaped curve, the number of citations increases (Fig. 1.b)10. These results generally are in accordance with the findings of Blume-Kogut et al. (2009), Fox and Milbourne (1999) and Payne and Siow (2003), who imply that there
10 We do not believe that this relationship between funding and scientific production (and of its quality) is infinite. We examined a cubic term in the regressions but it turned out non significant. Considering the wisdom of the granting councils and of the peer review process, however, we very much doubt that an embarrassment of riches in academia is likely to appear.
is a positive correlation between funding and academic outputs. Accordingly, the positive effect of funding suggests a Matthew effect (Merton 1968) that is at play here, hence suggesting that greater productivity and greater influence imply greater funding and thus that greater funding implies greater productivity and greater influence.
Fig. 1 The effect of average amount of government grants, ln(GovGrant3), on (a) the number of papers in the US, (b) the number of citations in the US
The relationship between funding and scientific output always matters to answer policy questions and funding allocation decisions. Although prior studies in various fields or specific universities have examined this relationship (see Arora et al. 1998; Jacob and Lefgren 2011;Lewison and Dawson 1998; Zucker et al., 2007), our study presents a detailed comparison of nanotechnology between Canada and the US.
Regarding scientific collaborations, we find that betweenness centrality has a remarkably positive and significant effect on the number of papers in both Canada and the US. Turning to the influence of this central position of researchers on the number of citations received by papers, we find a positive impact on the number of citations in both the US and Canada. It shows that a higher intermediary position of researchers in co-publication networks increase the number of scientific papers and research quality in the field of nanotechnology.
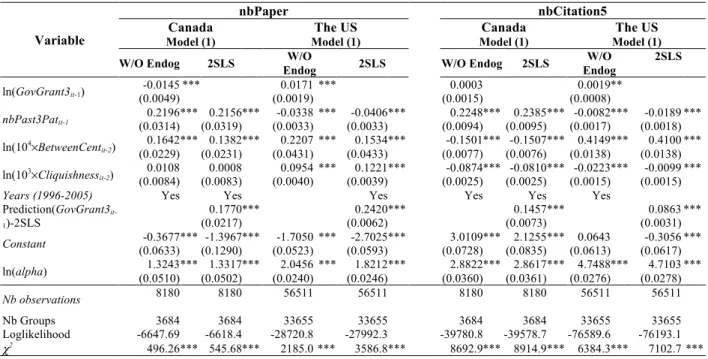
Continuing on network measures, we find that past individual cliquishness of scientists contributes to a positive impact on the publications in Canada and the US. When we add the quadratic term of cliquishness, we lose the significant results for the models accounting for endogeneity (2SLS models) in Canada. But in the US plotting the resulting quadratic curves shows a positive effect on the number of publications up to the maximum value of an inverted U-shaped curve (see Fig a in the Appendix 5). This suggests that the number of papers starts
-‐1.00 0.00 1.00 2.00 3.00 4.00 5.00 6.00 7.00 8.00 9.00 1 2 3 4 5 6 7 8 9 10 11 12 13 14 15 16 17 Number of Papers
(a) ln(GovGrant3) - The US
-‐1.00 0.00 1.00 2.00 3.00 4.00 5.00 6.00 7.00 1 2 3 4 5 6 7 8 9 10 11 12 13 14 15 16 17 Number of Citations (b) ln(GovGrant3) - The US
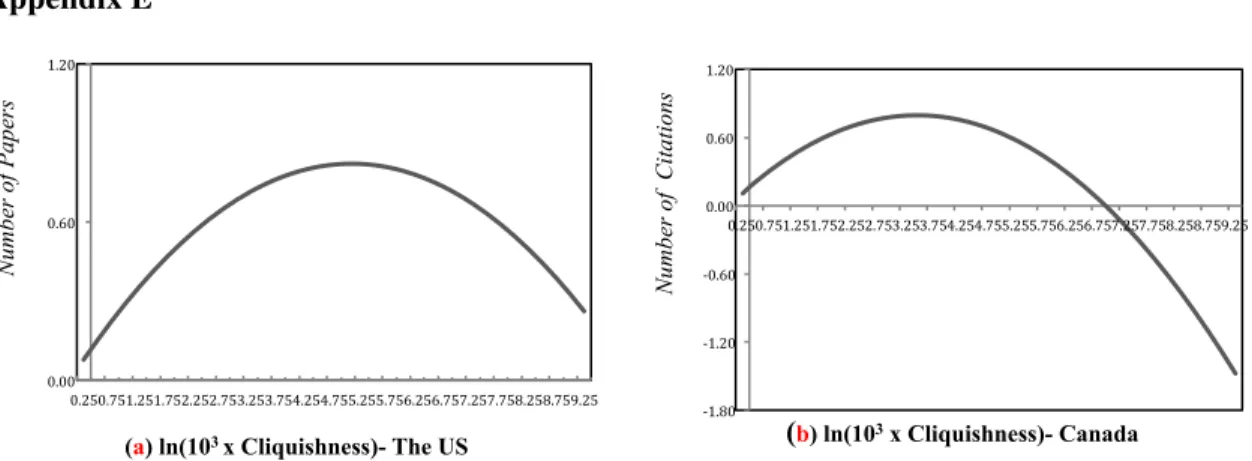
decreasing with higher cliquishness. Although researchers tend to collaborate with other scientists to generate more publications, a greater integration eventually hampers their activities beyond their collaborative circle in this multidisciplinary field: therefore, researchers should avoid acting solely in higher cliquishness groups and explore beyond their restricted networks. Similarly, the impact of the past individual cliquishness follows an inverted U-shaped curve on the number of citations in Canada when we account for the non-linear impact indicating that scientific production quality starts decreasing beyond the maximum value of the cliquishness, but in the US we only capture the linear impact on the number of citations (see Fig E.2 in the Appendix E). A better network position generally enhances research productivity and research quality of scientists in both studied countries.
We also examined whether there is a relationship between invention disclosures of academic researchers and their scientific output. The results show that the average number of patents to which a researcher has contributed over the past three years has a positive influence on his/her scientific production in Canada. These industrial interests increase the number of publications and the results of our first econometric model (model 1) show a reinforcing effect on the research quality of academic scientists in Canada. This can also reflect a self-selection effect rather than superior performance (see Moed 2007; Wildhagen 2009; Wagner 2010). The observed reinforcing effect may therefore derive from the fact that academic scientists with higher prior performance regarding scientific production move to patenting activities. Similarly, Cummings and Kiesler (2008) show the self-selection bias in successful collaborations in which collaborators that have had experience of working closely in the past develop strong ties with those collaborators in the future again and this plausibly result in higher performance.
In the US, no significant results are found for the correlation between the number of patents in past three years and the quantity and quality of scientific production in the field of nanotechnology. However, our results in Canada are similar to those of Azoulay et al. (2009), Czarnitzki et al. (2007) and Van Looy et al. (2006), who suggest a reinforcing effect of patenting on scientific outputs and highlight the fact that academic inventors create output of significantly higher quantity and quality. We posit that the same effect is at play in Canada in the field of nanotechnology and as a consequence, that the involvement in entrepreneurial activities within