HAL Id: hal-00000808
https://hal.archives-ouvertes.fr/hal-00000808
Submitted on 3 Nov 2003
HAL is a multi-disciplinary open access
archive for the deposit and dissemination of
sci-entific research documents, whether they are
pub-lished or not. The documents may come from
teaching and research institutions in France or
abroad, or from public or private research centers.
L’archive ouverte pluridisciplinaire HAL, est
destinée au dépôt et à la diffusion de documents
scientifiques de niveau recherche, publiés ou non,
émanant des établissements d’enseignement et de
recherche français ou étrangers, des laboratoires
publics ou privés.
First detection of triply-deuterated methanol
B. Parise, Alain Castets, E. Herbst, E. Caux, C. Ceccarelli, I. Mukhopadhyay,
A.G.G.M. Tielens
To cite this version:
B. Parise, Alain Castets, E. Herbst, E. Caux, C. Ceccarelli, et al.. First detection of triply-deuterated
methanol. Astronomy and Astrophysics - A&A, EDP Sciences, 2004, 416, pp.159-163.
�10.1051/0004-6361:20034490�. �hal-00000808�
ccsd-00000808 (version 1) : 3 Nov 2003
Astronomy & Astrophysicsmanuscript no. (will be inserted by hand later)
First detection of triply-deuterated methanol
B. Parise
1, A. Castets
2, E. Herbst
3, E. Caux
1, C. Ceccarelli
4, I. Mukhopadhyay
5, and A.G.G.M. Tielens
61
CESR CNRS-UPS, BP 4346, 31028 - Toulouse cedex 04, France
2
Observatoire de Bordeaux, BP 89, 33270 Floirac, France
3
Department of Physics, The Ohio State University, 174 W. 18th Ave. Columbus, OH 43210-1106, USA
4
Laboratoire d’Astrophysique, Observatoire de Grenoble, BP 53, 38041 Grenoble cedex 09, France
5
Dakota State University, 820 N. Washington Ave., Madison, SD 57042, USA
6
SRON, P.O. Box 800, NL-9700 AV Groningen, the Netherlands Received November 3, 2003 /Accepted
Abstract.We report the first detection of triply-deuterated methanol, with 12 observed transitions, towards the
low-mass protostar IRAS 16293−2422, as well as multifrequency observations of 13CH
3OH, used to derive the
column density of the main isotopomer CH3OH. The derived fractionation ratio [CD3OH]/[CH3OH] averaged on a
10′′beam is 1.4%. Together with previous CH
2DOH and CHD2OH observations, the present CD3OH observations
are consistent with a formation of methanol on grain surfaces, if the atomic D/H ratio is 0.1 to 0.3 in the accreting gas. Such a high atomic ratio can be reached in the frame of gas-phase chemical models including all deuterated
isotopomers of H+
3.
Key words.ISM: abundances – ISM: molecules – Stars: formation – ISM: individual: IRAS16293−2422
1. Introduction
Despite the relatively low elemental abundance of deu-terium in space (a factor of ∼ 1.5×10⁻⁵ less abundant
than H; Linsky 1998), extremely large amounts of doubly-deuterated formaldehyde (D2CO/H2CO ∼ 10%)
have been observed in the solar-type protostar IRAS 16293−2422 (hereafter IRAS 16293, Ceccarelli et al. 1998, Loinard et al. 2000, Ceccarelli et al. 2001), initi-ating the search for other multiply deuterated mole-cules. Subsequently, doubly deuterated formaldehyde, doubly deuterated hydrogen sulfide and multiply deuterated ammonia have been observed in other pro-tostars and dark clouds from where propro-tostars form (Roueff et al. 2000, Loinard et al. 2001, Ceccarelli et al. 2002, van der Tak et al. 2002, Lis et al. 2002, Vastel et al. 2003). These studies have been interpreted in terms of two different routes for formaldehyde, hydrogen sulfide and ammonia deuteration: active grain chemistry fol-lowed by at least partial desorption into the gas for formaldehyde and hydrogen sulfide on the one hand and gas-phase chemistry for ammonia on the other hand. However, ammonia may also be a grain surface product, provided a large D/H atomic ratio in the accreting gas. Recently, doubly-deuterated methanol was detected towards IRAS 16293 (Parise et al. 2002). This obser-vation provided new constraints for chemical models.
Send offprint requests to: [email protected]
The observations of the deuterated methanols CH2DOH
and CHD2OH were both consistent with the formation
of methanol from successive hydrogenations of CO by reaction with atomic H on grain surfaces, but required an atomic D/H ratio of 0.2 to 0.3 in the accreting gas. At the time of the observation of doubly-deuterated methanol, no gas-phase model was able to predict such a high atomic D/H ratio. Meantime, observations of doubly deuterated formaldehyde in a sample of pre-stellar cores showed that the degree of deuteration increases with increasing CO depletion (Bacmann et al. 2002, 2003). This deuteration of formaldehyde in pre-stellar cores may occur partially in the CO-depleted gas-phase and partially on the surface of dust grains, followed by some inefficient desorption mechanism. A further spectacular confirmation of enhanced deuteration in CO-depleted gas came from the detection of abundant H2D+, likely
the most abundant ion, in the prestellar core L1544 (Caselli et al. 2003). Phillips and Vastel (2003) suggested that in CO-depleted gas, even the multiple deuterated forms of H+
3 may be abundant and play a role in the
molecular deuteration enhancement. The suggestion has been fully confirmed by the modelling of Roberts et al. (2003), which shows that including HD+
2 and D + 3 in the
chemical network increases dramatically the molecular deuteration, and allows the production of the large atomic D/H ratio predicted by the methanol observations (Parise et al. 2002).
2 Parise et al.: First detection of triply-deuterated methanol
In this paper, we report the first detection of triply-deuterated methanol CD3OH in space, performed towards
the solar-type protostar IRAS 16293. We also present a multifrequency observation of 13CH
3OH, used to derive
the column density of the main isotopomer CH3OH. These
observations provide yet another stringent test to confirm the validity of grain surface models.
2. Observations and results
Using the IRAM 30-meter telescope (Pico Veleta, Spain), we detected the 12 CD3OH lines reported in
Table 1. The telescope was pointed at the coordinates α(2000) = 16h
32m
22.6s
and δ(2000) = -24◦28′33.0′′. The
observations were performed in April 2003. Two receivers were used simultaneously at 2 mm, to observe two bands around 156 and 160 GHz, with typical system tempera-tures of about 230 and 250 K respectively. These receivers were connected to the VESPA autocorrelator divided in six units. The telescope beam width is approximately 15′′
at 160 GHz. All observations were performed using the wobbler switching mode with an OFF position 4′ from
the source. The pointing accuracy was monitored regu-larly on strong continuum sources, and was found to be better than 3′′. All spectra were obtained with an
integra-tion time of 750 minutes. The rms noise is equal to 8 mK (Tmb) for a spectral resolution of 0.3 km s−1.
Observed spectra are shown in Fig. 1. The measured intensities, linewidths and main-beam temperatures are reported in Table 1. The frequencies of all detected lines have previously been measured in the laboratory with an accuracy of 25 kHz (Walsh et al. 1998), while the tran-sition strengths and energy levels were estimated from the published spectroscopic constants (Predoi-Cross et al. 1998) using the methanol program at Ohio State.
Some of the CD3OH lines (indicated by a star in Table
1) are close to CH2DCN lines. In that case, the intensity
was derived by using a two-component Gaussian fit, so the quoted fluxes have a further uncertainty due to the relative line contribution.
Two13CH
3OH lines at 156 GHz were observed
simul-taneously to the CD3OH lines. In addition, we analysed
330 GHz13CH
3OH observations obtained using the JCMT
in January 2000, with an rms noise of 37 mK. The beam size of the JCMT is 15′′at the considered frequencies, i.e.
equivalent to the beam size of the 30-meter at 160 GHz. Detailed information concerning the13CH
3OH spectra is
presented in Table 1.
3. Derivation of the column densities
We derived the abundance of CD3OH using the method
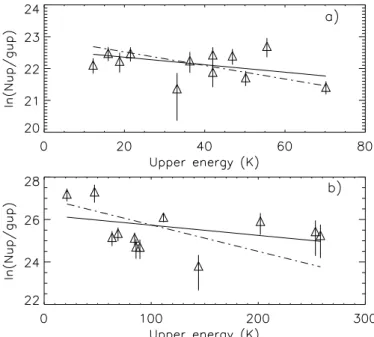
of rotational diagrams. The A and E species are consid-ered to be linked by ion-molecule reactions that transfer molecules from one species to the other. We then com-puted one single rotational diagram for the two species, presented in Fig. 2 (a). We averaged the level column
Fig. 2. Rotational diagram for : a) CD3OH (solid line
Trot= 85 K, dashed line: Trot= 47 K, see text), b) 13CH
3OH (solid line : Trot= 208 K, dashed line : Trot= 80
K, see text). Column densities are averaged on a 10′′beam.
densities on a 10′′ beam, as in Parise et al. (2002),
fol-lowing the suggestion by van Dishoeck et al. (1995) of en-hanced methanol emission in the central 10′′ region of
IRAS 16293. A more recent study of the spatial distri-bution of CH3OH was performed by Schoier et al. (2002),
and showed evidence for an abundance jump of methanol of two orders of magnitude in the inner part of the enve-lope (≤ 150 AU). However, in the following we consider averaged abundances on a 10′′ beam for consistency with
the Parise et al. (2002) study.
The ground E state is estimated to lie about 4.6 K above the ground A state. An A state has a relative spin-torsional weight of 11 whereas the relative spin-spin-torsional weight of an E state is 16. The partition function was computed from the asymmetric-top approximation :
Z(T ) = 11 × ZA(T ) + 16 × exp(−4.6/T ) × ZE(T ) where ZA(T ) = ZE(T ) = q πT3 ABC, with A = 3.3957 K, B = 0.9529 K and C = 0.9247 K, as determined by Walsh et al. (1998).
By fitting a straight line to the data in the rotational diagram, we derive a rotational temperature of 85 ± 28 K, consistent with the rotational temperature of CH3OH
(van Dishoeck et al. 1995). The CD3OH column density is
(1.4 ± 0.9)×1014 cm−2. We also derived the CD
3OH
col-umn density by fixing the rotational temperature to the one inferred from the CH2DOH and CHD2OH molecules
(Trot= 47 ± 7 K, Parise et al. 2002). The CD3OH column
density is then (7.8 ± 2.3)×1013
cm−2. Table 2 lists the
column densities for all deuterated methanols observed in IRAS 16293.
Fig. 1. CD3OH detected lines. The intensities are reported in main-beam brightness temperature. The label “both”
indicates the blending of one CD3OH and one CH2DCN lines. This latter CD3OH line has not been considered in the
population diagram analysis.
The column density of 13CH
3OH was derived using
the same method, with the molecular parameters taken from the Cologne Database for Molecular Spectroscopy (Muller et al. 2001). The rotational diagram is presented in Fig 2 (b). The inferred rotational temperature is 208 ± 70 K and the column density averaged over a 10′′
beam is (2.6 ± 1.8)×1014
cm−2. We also computed the
col-umn density for fixed rotational temperatures of 50 K and 80 K. The inferred value is (1.4 ± 0.6)×1014
cm−2,
independent of the temperature in this range. Using the
12
C/13
C ratio of 70 derived by Boogert et al. (2000), we derive a column density of (9.8 ± 4.2)×1015 cm−2 for
CH3OH. This value is nearly 3 times higher than the
col-umn density used by Parise et al. (2002), inferred from CH3OH observations from van Dishoeck et al. (1985).
The fractionation ratios, relative to this new estimate of the CH3OH column density, are reported in Table 2 for
all deuterated isotopomers of methanol.
4. Discussion and conclusions
The main result of this Letter is the first detection of triply-deuterated methanol in space, with 12 detected transitions. This discovery follows the detection of doubly-deuterated as well as singly-doubly-deuterated isotopomers to-wards the same object (Parise et al. 2002). Observations of multiple isotopomers of methanol represent a powerful constraining tool for chemical processes that lead to such a high deuteration.
4 Parise et al.: First detection of triply-deuterated methanol
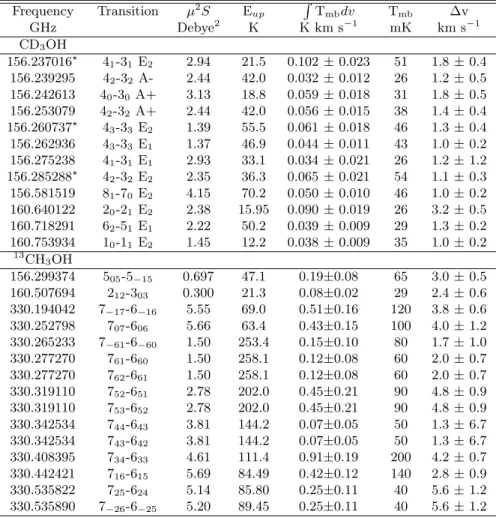
Table 1. Main-beam intensities1, peak temperatures2and widths for the observed CD
3OH and13CH3OH transitions3. Frequency Transition µ2S Eup RTmbdv Tmb ∆v GHz Debye2 K K km s−1 mK km s−1 CD3OH 156.237016⋆ 4 1-31 E2 2.94 21.5 0.102 ± 0.023 51 1.8 ± 0.4 156.239295 42-32 A- 2.44 42.0 0.032 ± 0.012 26 1.2 ± 0.5 156.242613 40-30 A+ 3.13 18.8 0.059 ± 0.018 31 1.8 ± 0.5 156.253079 42-32 A+ 2.44 42.0 0.056 ± 0.015 38 1.4 ± 0.4 156.260737⋆ 4 3-33 E2 1.39 55.5 0.061 ± 0.018 46 1.3 ± 0.4 156.262936 43-33 E1 1.37 46.9 0.044 ± 0.011 43 1.0 ± 0.2 156.275238 41-31 E1 2.93 33.1 0.034 ± 0.021 26 1.2 ± 1.2 156.285288⋆ 4 2-32 E2 2.35 36.3 0.065 ± 0.021 54 1.1 ± 0.3 156.581519 81-70 E2 4.15 70.2 0.050 ± 0.010 46 1.0 ± 0.2 160.640122 20-21 E2 2.38 15.95 0.090 ± 0.019 26 3.2 ± 0.5 160.718291 62-51 E1 2.22 50.2 0.039 ± 0.009 29 1.3 ± 0.2 160.753934 10-11 E2 1.45 12.2 0.038 ± 0.009 35 1.0 ± 0.2 13CH 3OH 156.299374 505-5−15 0.697 47.1 0.19±0.08 65 3.0 ± 0.5 160.507694 212-303 0.300 21.3 0.08±0.02 29 2.4 ± 0.6 330.194042 7−17-6−16 5.55 69.0 0.51±0.16 120 3.8 ± 0.6 330.252798 707-606 5.66 63.4 0.43±0.15 100 4.0 ± 1.2 330.265233 7−61-6−60 1.50 253.4 0.15±0.10 80 1.7 ± 1.0 330.277270 761-660 1.50 258.1 0.12±0.08 60 2.0 ± 0.7 330.277270 762-661 1.50 258.1 0.12±0.08 60 2.0 ± 0.7 330.319110 752-651 2.78 202.0 0.45±0.21 90 4.8 ± 0.9 330.319110 753-652 2.78 202.0 0.45±0.21 90 4.8 ± 0.9 330.342534 744-643 3.81 144.2 0.07±0.05 50 1.3 ± 6.7 330.342534 743-642 3.81 144.2 0.07±0.05 50 1.3 ± 6.7 330.408395 734-633 4.61 111.4 0.91±0.19 200 4.2 ± 0.7 330.442421 716-615 5.69 84.49 0.42±0.12 140 2.8 ± 0.9 330.535822 725-624 5.14 85.80 0.25±0.11 40 5.6 ± 1.2 330.535890 7−26-6−25 5.20 89.45 0.25±0.11 40 5.6 ± 1.2 1
The fluxes were derived using Gaussian fits, and the uncertainty given ispσ2
stat+ σ 2
calwhere σstatis the statistical error and
σcal the calibration uncertainty (15%). 2The noise rms is 8 mK for the CD3OH data and 37 mK for the13CH3OH data. 3A
star following the frequency indicates that the line is close to a CH2DCN line and was fitted by a two-component Gaussian fit
(see text).
Table 2. Derived column densities and fractionation ratios relative to CH3OH for deuterated methanols in
IRAS 16293
Molecule Trot(K) N (cm−2) fractionation
CD3OH 85 ± 28 (1.4 ± 0.9)×1014 1.4 ± 1.4 % 47 ± 7a (7.8 ± 2.3)×1013 0.8 ± 0.6 % CHD2OHb 47 ± 7 (6.0 ± 2.2)×10 14 6 ± 5 % CH2DOHb 48 ± 3 (3.0 ± 0.6)×10 15 30 ± 20 % CH3ODb 20 ± 4 (1.5 ± 0.7)×1014 2 ± 1 %
afixed temperature, see text.bObserved in Parise et al. 2002
It is interesting to compare these observations to the predictions of the simple grain chemistry scheme of Rodgers & Charnley (2002). If the D atoms are ran-domly distributed in the methanol isotopomers (i.e. this scheme does not consider any activation barrier for the reactions but rather assumes that all reactions are equiprobable), the fractionation ratios R of each iso-topomer relative to CH3OH should scale as follows:
R(CH3OD) = α, R(CH2DOH) = 3α, R(CHD2OH) = 3α2
and R(CD3OH) = α3, where α is the accreting atomic
D over H ratio. The three independent observations of CH2DOH, CHD2OH and CD3OH are consistent within
the error bars with a value of 0.1−0.2 for the D over H accretion rate. Accounting for the different mass of the atoms, this ratio corresponds to an abundance ratio in the gas-phase of D/H =√2×(0.1−0.2) = 0.15−0.3. However, this simple scheme fails to explain the observed low abun-dance of CH3OD.
More accurate grain chemical models accounting for different activation barriers for the reactions have been developed in the last few years. We compare in the fol-lowing our observations with the model developed by Stantcheva & Herbst (2003). This model is based on the direct solution of the master equation and therefore gives essentially the same predictions as the Monte Carlo mod-els described by Caselli et al. (2002) or Charnley et al. (1997). Fig. 3 shows predictions for fractionation ra-tios of deuterated isotopomers of methanol relative to CH3OH versus the atomic D/H ratio in the accreting gas
Fig. 3. The deuterium fractionation ratio for the various deuterated isotopomers of methanol is plotted against the abundance ratio of deuterium to hydrogen atoms in the gas phase. Dashed lines: model results of Stantcheva et al. 2003. Thick lines: observations of IRAS 16293.
are formed by active grain chemistry. In the limit of low temperature (10 K), this model essentially gives the ra-tios corresponding to a random distribution of deuterium atoms. Observed fractionation ratios with their error bars have been overlaid on each curve, allowing the derivation of the required atomic D/H ratio in the gas-phase. The CD3OH, CHD2OH and CH2DOH observations are
con-sistent with a formation on grain surfaces with an atomic D/H abundance ratio of 0.1−0.2. Such a high atomic frac-tionation ratio in the gas phase is predicted by the recent gas-phase model of Roberts et al. (2003), which involves not only H2D+ but also D2H+ and D
+
3 as precursors for
deuterium fractionation, when the density of gas is very high and heavy species such as CO are strongly depleted. As can be seen in Fig. 3, CH3OD appears to be
under-deuterated when compared with the grain chemical pre-dictions. It is possible that the CH3OD fractionation may
be affected in the warm gas; e.g., this isotopomer may be preferentially converted into CH3OH when released in
the gas-phase by protonation reactions followed by dis-sociative recombination with an electron (Charnley et al. 1997, Parise et al. 2002) :
CH3OD + H+3 → CH3ODH++ H2
CH3OHD++ e−→ CH3OH + D.
The corresponding reactions with H2D+, HD + 2 and D
+ 3
come of little importance in view of their low abundance in the warm gas of the hot core. This hypothesis, which as-sumes that protonation reactions attack the oxygen end of the methanol only (Osamura, Roberts & Herbst, in prep), could be tested by observing the CH2DOD isotopomer.
This observation may be difficult due to the expected low intensity of the lines.
Acknowledgements. E. Herbst acknowledges the support of the
National Science Foundation (US) for his research program in astrochemistry.
References
Bacmann, A., Lefloch, B., Ceccarelli, C., Castets, A., Steinacker, J., & Loinard, L. 2002, A&A 389, L6
Bacmann, A., Lefloch, B., Ceccarelli, C., Steinacker, J., Castets, A., & Loinard, L. 2003, A&A 585, L55
Boogert, A.C.A., Ehrenfreund, P., Gerakines, P.A., Tielens, A.G.G.M., Whittet, D.C.B., Schutte, W.A., van Dishoeck E.F., de Graauw, Th., Decin, L., & Prusti T. 2000, A&A 353, 349
Caselli, P., Stantcheva, T., Shalabiea, O., et al. 2002 Planet. Space Sci., 50, 1257
Caselli, P., van der Tak, F.F.S., Ceccarelli, C., & Bacmann, A. 2003, A&A 403, L37
Cazaux, S., Tielens, A.G.G.M., Ceccarelli, C., Castets, A., Wakelam, V., Caux, E., Parise, B. & Teyssier, D. 2003, ApJL in press
Ceccarelli, C., Vastel, C., Tielens, A. G. G. M., Castets, A., Boogert, A. C. A., Loinard, L., & Caux, E. 2002, A&A, 381, L17
Ceccarelli, C., Loinard, L., Castets, A., Tielens, A. G. G. M., Caux, E., Lefloch, B., & Vastel, C. 2001, A&A, 372, 998 Ceccarelli, C., Castets, A., Loinard, L., Caux, E., & Tielens,
A. G. G. M. 1998, A&A, 338, L43
Charnley S.B., Tielens A.G.G.M., & Rodgers S.D. 1997, ApJ 482, L203
Linsky, J. L. 1998, Space Sci. Rev., 84, 285
Lis, D. C., Roueff, E., Gerin, M., Phillips, T. G., Coudert, L. H., van der Tak, F. F. S., & Schilke, P. 2002, ApJ, 571, L55 Loinard, L., Castets, A., Ceccarelli, C., Caux, E., & Tielens,
A. G. G. M. 2001, ApJ, 552, L163
Loinard, L., Castets, A., Ceccarelli, C., Tielens, A. G. G. M., Faure, A., Caux, E., & Duvert, G. 2000, A&A, 359, 1169 Maret S. et al. in prep
Muller, H.S.P., Thorwirth, S., Roth, D.A., & Winnewisser, G. 2001, A&A, 370, L49
Parise, B., Ceccarelli, C., Tielens, A. G. G. M., Herbst, E., Lefloch, B., Caux, E., Castets, A., Mukhopadhyay, I., Pagani, L., & Loinard, L. 2002, A&A, 393, L49
Phillips, T. & Vastel, C., 2003, in Chemistry as a Diagnostic of Star Formation, ed. C.L. Curry & M. Fish, in press (astro-ph/0211610)
Predoi-Cross, A., Xu. L.-H., Walsh, M.S., Lees, R.M., Winnewisser, M., & Lichau H. 1998, J. Mol. Spec., 188, 94
Roberts, H., Herbst, E., & Millar T. J. 2003, ApJ 591, 41 Rodgers, S. D., & Charnley, S. B. 2002, Planet. Space Sci., 50,
1125
Roueff, E., Tin´e, S., Coudert, L. H., Pineau des Forˆets, G., Falgarone, E., & Gerin M. 2000, A&A, 354, L63
Schoier, F.L., Jorgensen, J.K., van Dishoeck, E.F., & Blake, G.A. 2002, A&A 390, 1001
Stantcheva, T., & Herbst, E. 2003, MNRAS, 340, 983
van der Tak, F. F. S., Schilke, P., M¨uller, H. S. P., Lis, D. C.,
Phillips, T. G., Gerin, M., & Roueff, E. 2002, A&A, 388, L53
van Dishoeck, E. F., Blake, G. A., Jansen, D. J., & Groesbeck, T. D. 1995, ApJ, 447, 760
Vastel, C., Phillips, T.G., Ceccarelli, C., & Pearson, J. 2003, ApJL 593, L97
Walsh, M. S., Xu, L.-H., & Lees, R. M. 1998, J. Mol. Spectrosc.,188, 85