HAL Id: hal-00329276
https://hal.archives-ouvertes.fr/hal-00329276
Submitted on 1 Jan 2003
HAL is a multi-disciplinary open access
archive for the deposit and dissemination of
sci-entific research documents, whether they are
pub-lished or not. The documents may come from
teaching and research institutions in France or
abroad, or from public or private research centers.
L’archive ouverte pluridisciplinaire HAL, est
destinée au dépôt et à la diffusion de documents
scientifiques de niveau recherche, publiés ou non,
émanant des établissements d’enseignement et de
recherche français ou étrangers, des laboratoires
publics ou privés.
shear flow region determined by conjugate Cluster II
and MIRACLE ground-based observations
O. Amm, A. Aikio, J.-M. Bosqued, M. Dunlop, A. Fazakerley, P. Janhunen,
K. Kauristie, M. Lester, I. Sillanpää, M. G. G. T. Taylor, et al.
To cite this version:
O. Amm, A. Aikio, J.-M. Bosqued, M. Dunlop, A. Fazakerley, et al.. Mesoscale structure of a morning
sector ionospheric shear flow region determined by conjugate Cluster II and MIRACLE ground-based
observations. Annales Geophysicae, European Geosciences Union, 2003, 21 (8), pp.1737-1751.
�hal-00329276�
Mesoscale structure of a morning sector ionospheric shear flow
region determined by conjugate Cluster II and MIRACLE
ground-based observations
O. Amm1, A. Aikio2, J.-M. Bosqued3, M. Dunlop4,9, A. Fazakerley5, P. Janhunen1, K. Kauristie1, M. Lester6, I. Sillanp¨a¨a1, M. G. G. T. Taylor5,10, A. Vontrat-Reberac7, K. Mursula2, and M. Andr´e8
1Finnish Meteorological Institute, Geophysical Research, P.O. Box 503, FIN-00101 Helsinki, Finland
2University of Oulu, Department of Physical Sciences, P.O. Box 3000, FIN-90014 University of Oulu, Finland 3CESR/CNRS, BP 4346 9, Avenue Colonel Roche, 31028 Toulouse Cedex 4, France
4Blackett Laboratory, Space and Atmospheric Physics, Imperial College of Science, Technology, & Medicine, Prince Consort
Rd, South Kensington, London SW7 2BZ, UK
5Mullard Space Science Laboratory, Holmbury St. Mary, Dorking, Surrey RH5 6NT, UK
6Radio & Space Plasma Physics Group, Depart. of Physics & Astronomy, University of Leicester, Leicester LE1 7RH, UK 7CETP/UVSQ/IPSL, 10-12 Avenue de l’Europe, F-78140 Velizy, France
8Swedish Institute of Space Physics, Uppsala Division, Box 537, SE-75121 Uppsala, Sweden
9now at: Space Sciences Division, SSTD, Rutherford Appleton Laboratory, Chilton, Didcot, Oxfordshire, OX11 0QX, UK 10now at: Los Alamos National Laboratory, P.O. Box 1663, Mail stop D466, Los Alamos, New Mexico 87545, USA
Received: 18 October 2003 – Revised: 18 February 2003 – Accepted: 25 February 2003
Abstract. We analyse a conjunction event of the Cluster II
spacecraft with the MIRACLE ground-based instrument net-work in northern Fennoscandia on 6 February 2001, between 23:00 and 00:00 UT. Shortly after the spacecraft were located at perigee, the Cluster II satellites’ magnetic footpoints move northwards over Scandinavia and Svalbard, almost perfectly aligned with the central chain of the IMAGE magnetometer network, and cross a morning sector ionospheric shear zone during this passage. In this study we focus on the mesoscale structure of the ionosphere. Ionospheric conductances, true horizontal currents, and field-aligned currents (FAC) are cal-culated from the ground-based measurements of the IMAGE magnetometers and the STARE coherent scatter radar, us-ing the 1-D method of characteristics. An excellent agree-ment between these results and the FAC observed by Clus-ter II is reached afClus-ter averaging the ClusClus-ter measurements to mesoscales, as well as between the location of the convection reversal boundary (CRB), as observed by STARE and by the Cluster II EFW instrument. A sheet of downward FAC is observed in the vicinity of the CRB, which is mainly caused by the positive divergence of the electric field there. This FAC sheet is detached by 0.5◦–2◦ of latitude from a more equatorward downward FAC sheet at the poleward flank of the westward electrojet. This latter FAC sheet, as well as the upward FAC at the equatorward flank of the jet, are mainly caused by meridional gradients in the ionospheric conduc-tances, which reach up to 25 S in the electrojet region, but only ∼5 S poleward of it, with a minimum at the CRB.
Parti-Correspondence to: O. Amm ([email protected])
cle measurements show that the major part of the downward FAC is carried by upward flowing electrons, and only a small part by downward flowing ions. The open-closed field line boundary is found to be located 3◦–4◦poleward of the CRB, implying significant errors if the latter is used as a proxy of the former.
Key words. Ionosphere (electric fields and currents) –
Mag-netosphere physics (current systems; plasma convection)
1 Introduction
The antisunward convection in the outer parts of the magne-tosphere and the sunward return flow in its inner parts lead to a convection reversal boundary that is projected to the iono-sphere, and to the formation of the well-known ionospheric two-cell potential pattern for southward interplanetary mag-netic field (IMF), or to more complex patterns for northward IMF. In the most common two-cell potential case, the iono-spheric plasma flow on the dusk side is eastward in the high-latitude portion of the auroral zone, and westward in its lower latitude part, while on the dawn side of the Earth the flow di-rections are reversed. The border between these two flow directions on either side of the Earth is called “convection reversal boundary” (CRB) or “shear flow region”. Although this boundary often rather has the characteristics of a rota-tional discontinuity than of a strict shear (e.g. Ridley and Clauer, 1996; Amm et al., 2000), we use the term “shear flow region” here as the mesoscale region inside which the
large-scale reversal of the zonal component of the plasma flow (or equivalently of the meridional component of the ionospheric electric field) occurs, while the term “convection reversal boundary” is used to refer to the exact location where this component is vanishing.
While a lot of attention has been directed to the midnight part of this shear flow region, called the “Harang disconti-nuity”, where the dawn and dusk sunward flow areas in the lower latitude auroral zone may overlap each other and co-exist on the same meridian, causing a complex pattern of ionospheric electrodynamics (e.g. Maynard, 1974; Erickson, 1991; Inhester et al., 1992; Amm, 1998), and to the relation between the shear flow regions and the direct entry of solar wind particles in the noon sector (e.g. Newell et al., 1991; Ohtani et al., 1995a, b), surprisingly few studies analyse in detail the ionospheric electrodynamics of the shear flow re-gion on the dawn or dusk flanks. However, as these rere-gions are colocated with the large-scale region 1 field-aligned cur-rents (FAC), as defined by Iijima and Potemra (1978), they are key areas of ionosphere-magnetosphere coupling, as a considerable amount of interaction in terms of currents and energy flux takes place there (e.g. Kamide and Baumjohann, 1993).
Ridley and Clauer (1996) classified the CRBs into a sta-tionary and steady, a nonstasta-tionary, and an oscillating type. They found that nonstationarity is mostly caused by sign changes in the IMF, while changes of its magnitude alone often leave the CRB location unchanged. Their results also indicate that the common usage of the CRB as a proxy for the open/closed field line boundary can lead to an error in positioning this boundary by several degrees in latitude.
Comparing satellite particle mesurements and observa-tions from HF radars, Senior et al. (1994) concluded that the nightside CRB lies at the poleward edge of auroral arcs but equatorward of characteristic velocity dispersed ion signa-tures at the border between the auroral oval and the polar cap. Mapping its location to the magnetosphere, the authors found it to be connected to the plasma sheet boundary layer. Trochichev et al. (1996) compared the CRB location to the hard auroral precipitation boundary which they defined as the position where the average electron energy drops below 0.45 keV at the poleward side of the auroral oval. In the low-altitude terminology of Newell et al. (1996), this boundary would be close to his b5e boundary. Trochichev et al. (1996) found that both borders are typically colocated within one de-gree of latitude, except for in the morning sector, where the CRB was more frequently observed several degrees poleward of the hard precipitation boundary. One general shortcoming of these previous satellite-based studies is that data of only one satellite (or of two satellites with a spatial separation of several hours in magnetic local time) were used. Therefore it is difficult to follow spatial and temporal changes in the CRB, and to divide them up correctly.
Using a large database of ground-based magnetometer recordings and all-sky camera data, Kauristie et al. (2001) found in a statistical analysis of evening sector auroral arcs and ionospheric current systems that the CRB, here defined
as the transition between the eastward electrojet in the auro-ral oval and the westward currents at high latitudes, is located ∼2–3◦poleward of the polewardmost auroral arc associated
with the electrojet.
A detailed two-dimensional electrodynamical analysis of five shear flow events in the early morning sector, using the two-dimensional method of characteristics to derive the iono-spheric currents, FAC, and conductances, was carried out by Amm et al. (2000). They found that the downward FAC as-sociated with the shear region consist of two parts: one part is caused by the divergence of the electric field at the CRB it-self, where the ionospheric conductances were found to show a minimum. The other part has its peak about ∼1–2◦ equa-torward of the CRB and is caused by a positive conductance gradient in equatorward direction from the CRB towards the westward electrojet flowing in the auroral oval. The two FAC parts can partly overlap one another.
Geophysical features may look very differently if viewed at different scales. On a global scale, the changing position of the convection reversal boundaries as part of the global ionospheric convection system for different orientations of the IMF has been studied in a vast number of works (e.g. Heppner and Maynard, 1987; Rich and Hairston, 1994; Ri-dley et al., 1998). On a micro scale (meaning here a scale of a few km, approximately corresponding to the thickness of an auroral arc), the relation between the CRB and auro-ral forms, as well as the relation to the ionospheric electron density structure has been analysed (Nielsen and Greenwald, 1979; Berry et al., 2000). In the present work, we anal-yse the mesoscale (50–1000 km) ionospheric electrodynam-ics of a shear flow region, using observations of the Cluster II satellites and the MIRACLE ground-based network during a spacecraft passage over northern Scandinavia and Finland. Since both the ground-based and the four-satellite Cluster II data cover an extended spatial area, it is possible to monitor and to divide up temporal and spatial changes in the shear flow region. Advanced data analysis methods are used to compute ionospheric currents, conductances, and FAC from the data. The resulting electrodynamical parameters from ground-based and space-based observations are compared, and put into the context of the particle precipitation regions observed by Cluster II. Section 2 gives an overview of the data sources and analysis methods used. Section 3 describes the observations and presents the analysis results. In Sect. 4, the results are discussed with respect to earlier findings, and summarised in Sect. 5.
2 Instrumentation and analysis techniques
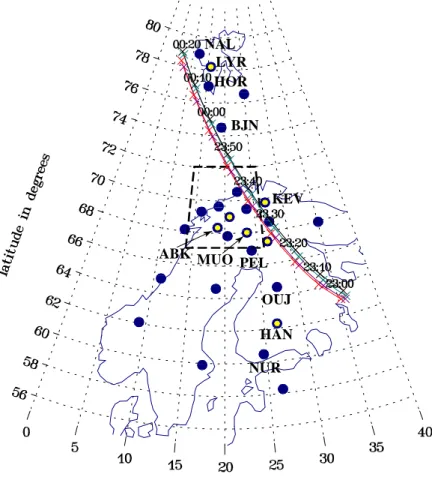
Figure 1 shows the multi-instrument array for ionosphere-magnetosphere coupling studies (MIRACLE) in Fennoscan-dia, and the magnetic footprints of the four Cluster II satel-lites on 6 February 2001, between 23:00 and 00:20 UT, as mapped to the ionospheric level with the Tsyganenko 89 model (Kp = 3). The MIRACLE network (Syrj¨asuo et
NUR HAN OUJ PEL MUO KEV BJN HOR LYR NAL ABK
Fig. 1. The MIRACLE network in Scandinavia and Svalbard, and the mag-netic footprints of the Cluster II satel-lites during from 6 February 2001, 23:00–00:20 UT. Blue dots: IMAGE magnetometer stations; blue dots with yellow inner dots: IMAGE magnetome-ter station and all-sky camera station: dashed rectangle: field of view of the STARE coherent scatter radar; colours of the Cluster II footprint paths: black: spacecraft 1; red: spacecraft 2; green: spacecraft 3; cyan: spacecraft 4.
(shown by blue dots in Fig. 1), the STARE coherent scat-ter radar which observes the ionospheric electric field in the area marked by the black rectangle with a spatial resolution of ∼20 km, and of eight all-sky cameras (blue dots with yel-low inner dots mark stations with both a magnetometer and an all-sky camera). We also use data of the CUTLASS radar pair which belongs to the SuperDARN network of HF radars (Greenwald et al., 1995). The radar measures the ionospheric electric field with a spatial resolution of ∼50 km, and its field of view covers the area north of the Scandinavian mainland and the vicinity of Svalbard in Fig. 1.
The following instruments on board the four Cluster II satellites were used: the Fluxgate Magnetometer (FGM; Balogh et al., 1997); the Electric Field and Wave (EFW) experiment which consists of two pairs of spherical probes deployed in the spin plane to measure the electric field (Gustafsson et al., 1997). The component of the electric field along the spin axis is not measured; the Cluster Ion Spec-trometry (CIS; R`eme et al., 2001) experiment consists of two distinct instruments measuring complete 3-D ion distri-butions: (a) the CIS-1/CODIF spectrometer which separates the major ion species (H+, He++, He+and O+), with ener-gies up to 40 keV/e, (b) the CIS-2/HIA analyser which gives the ion distributions (without mass resolution) from ∼5 eV/e to ∼32 keV/e (R`eme et al., 2001). For the interval of in-terest only the CIS2 data (SC1 and SC3) are available; and
the Plasma Electron and Current (PEACE; Johnstone et al., 1997) experiments. As shown in Fig. 1, on 6 February 2001, the magnetic footprints of the satellites enter the densest area of the IMAGE magnetometer network at about 23:30 UT, and follow the main meridional magnetometer chain almost par-allel until they pass by the northernmost station on Svalbard at about 00:20 UT. At each single timestep, the footpoints are almost meridionally aligned (see the crosses in Fig. 1), with a spacing between the northernmost and southernmost foot-print of ∼0.5–1◦. The satellites were at perigee shortly be-fore the passage over MIRACLE, and are located in the early morning sector inner magnetosphere at radii of 4.25–4.31 RE
at 23:30 UT, moving subsequently toward the northern pole. In many cases, ionospheric electrodynamic situations can be described to a good level of approximation as one-dimensional (1-D), in the sense that the derivative of the electrodynamic parameters vanishes along circles of constant latitude. Such situations are common for convection elec-trojets (e.g. Untiedt and Baumjohann, 1993), but also for shear flow situations consisting of two zonal, in opposite di-rection flowing current systems at different latitudes. With the extended MIRACLE network, we can check the valid-ity of the 1-D assumption (see Sect. 3). The applicabilvalid-ity of this assumption makes it possible to use analysis meth-ods for ionospheric electrodynamics which are specifically designed for the 1-D case, and which are less strict in their
Fig. 2. X (geographic northward) and Z (vertical downward)
com-ponent magnetograms for a selected meridional chain of IMAGE stations on 6 February 2001, 18:00–00:00 UT, in nT.
input data requirements and easier to use than the full two-dimensional (2-D) solutions. In this paper, we use the 1-D upward continuation method of the ground magnetic field to the ionospheric level (assumed at 100 km altitude), to cal-culate ionospheric equivalent currents there (Mersmann et al., 1979). These results can then be combined with data of the ionospheric electric field by means of the 1-D method of characteristics (Inhester et al., 1992), to derive ionospheric conductances, true currents, and FAC, using an estimate of the Hall to Pedersen conductance ratio. This ratio can much more reliably be estimated from the ground magnetic field disturbance level (Lester et al., 1996) or from the average en-ergy of precipitating electrons (Robinson et al., 1987) than the conductances themselves. The Hall conductance is then calculated as 6H(η) = 2 µ0Bion,η(η) + K Vη(η) ,
where η denotes the coordinate perpendicular to which the derivative of the electrodynamical parameters is assumed to be vanishing (here pointing to geographic north), Bion,η(η)
is poleward component the magnetic field at the ionospheric level, Vη =Eη+α−1Eφ, with E denoting the ionospheric
electric field, α the Hall to Pedersen conductance ratio, and φ the component toward geographic east. The constant K 6= F (η)reflects the influence of distant true currents to the magnetic field on the ionospheric level, or equivalently, the ionospheric equivalent currents. Since for a shear flow situation, at some latitude η1a point with Vη(η1) = 0 is
en-countered, from the requirement that the conductance stays finite this constant can be calculated as
K = − 2 µ0
Bion,η(η1).
Due to the string-type configuration of the Cluster II satellites during our event, an estimation of the FAC from the satellite magnetometer data via an estimate of the curl of the magnetic field is not applicable. In accordance with the 1-D assump-tion outlined above, we calculate the FAC for each satellite separately, assuming that it crosses zonally flowing, infinite current sheets.
3 Data and analysis
As an overview of the geomagnetic situation in the evening and night of 6 February 2001, Fig. 2 shows magnetograms of selected IMAGE magnetometers stations along a meridional line (NUR to NAL; the location of these stations are marked in Fig. 1). After a period of moderate magnetic activity, a substorm onset was observed on the Scandinavian main-land at ∼21:00 UT, followed by a poleward expansion that reached NAL at ∼21:25 UT. The recovery phase of this sub-storm lasted until ∼22:30 UT. After that, a moderate west-ward convection electrojet developed over the Scandinavian mainland with negative ground magnetic disturbances in the X(geographically northward) component of 100–200 nT. In the time interval of our interest (23:00–00:00 UT), the cen-ter of this electrojet is located between the stations PEL and MUO, as can be seen by the sign change in the Z (verti-cally downward) component. At the same time, a weak east-ward current is observed in the poleeast-ward part of the IMAGE network. The sign change of the X component occurs be-tween the stations KEV and BJN. Except for some intermit-tent smaller intensifications, this configuration remains stable until 00:00 UT.
The interplanetary magnetic field (IMF) seen by the WIND satellite (data not shown) indicates that our event takes place under mainly positive IMF Bz conditions, with
an excursion to slightly negative values between ∼23:45– 00:00 UT. A reliable mapping of the IMF conditions is, how-ever, not possible with the data available, since WIND was located at YGSM∼145 REand ZGSM∼70 RE, i.e. far away
from the XGSM =0 axis. Also, the ACE satellite data (not
shown) indicate a period of stable, positive IMF Bz, followed
by an intermediate excursion toward IMF Bz≈0. If mapped
from the ACE position toward the Earth using the solar wind speed as measured by WIND (no respective data were
avail-Fig. 3. Left panel: results of the 1-D upward continuation of the north component of the ground magnetic field towards the ionospheric level,
in nT. For each time step, a meridional profile is shown. Negative numbers indicate a westward (equivalent) electrojet, positive numbers eastward (equivalent) currents. The border between these currents defines the magnetic convection reversal boundary (MCRB; green line). The peak location of the westward electrojet is schmatically indicated by the yellow line. The magnetic footprints of the Cluster II satellites are indicated with lines of colours as in Fig. 1. Right panel: Keogram of all-sky camera data from the station Abisko (ABK); the panel is placed such that latitudes correspond approximately to the one of the right panel, but only exactly at the zenith of ABK.
able from ACE), this excursion would occur after our time interval of interest.
The left panel of Fig. 3 shows the results of the 1-D upward continuation of the ground magnetic field during the interval 23:00–00:00 UT. Data of the meridional chain of IMAGE stations from NUR-NAL (cf. Fig. 1) with 10 s of temporal resolution were used for this process. For each timestep, the latitudinal profile of Bion,ηis shown which is directly related
to the eastward component of the ionospheric equivalent cur-rents as
Jeq,ion,φ=
2 µ0
Bion,η.
Thus, blue colour marks the region of the westward elec-trojet, while red colour marks the area of eastward cur-rents at higher latitudes. The boundary between these two regions is marked by a green iso contour line, called the “magnetic convection reversal boundary” (MCRB). Figure 3 also shows the positions of the magnetic footprints of the four Cluster spacecraft. The center of the westward elec-trojet moves slowly equatorward from 68◦to 66.5◦latitude, between 23:00 UT and 23:35 UT. A poleward broadening of the electrojet’s width occurs at 23:37 UT, but its maxi-mum current density remains at the previous position. At
∼23:50 UT, the electrojet’s center jumps poleward to 68.5◦ latitude. While inside the westward electrojet, Bion,ηreaches
maximum absolute values of ∼250 nT (corresponding to |Jeq,ion,φ|∼400 mA/m), the eastward currents in the
pole-ward region are much weaker and only cause a maximum Bion,η of ∼35 nT (corresponding to Jeq,ion,φ ∼ 56 mA/m).
Although some intermediate intensifications are visible in both currents, the general structure of the current system in the main time interval of interest (23:30–00:00 UT) is rela-tively stable, and the MCRB shows only slight movements between ∼72.2◦ and 73.2◦ latitude. The four Cluster II
satellites pass this boundary between 23:48 and 23:53 UT. Between ∼23:16 and 23:34 UT the satellites are passing through the main body of the westward electrojet, and are subsequently skimming along its poleward boundary before reaching the MCRB.
In the right panel of Fig. 3, all-sky camera (ASC) data of the station Abisko (ABK; see Fig. 1) is shown in the form of a keogram. In this presentation, the central meridian of each ASC picture is displayed for a sequence of timesteps. The geographical locations of the aurora is inferred by as-suming an altitude of 110 km. A region of diffuse aurora is seen in the equatorward portion of the westward electrojet,
southward electric field in mV/m
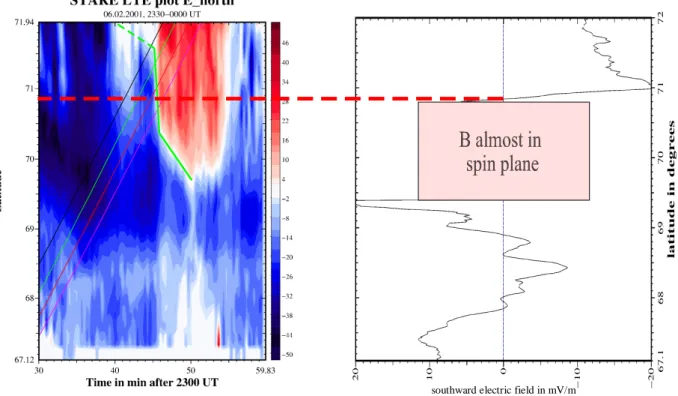
Fig. 4. Left panel: STARE northward electric field component data (in mV/m), along the central meridian of the radar’s field of view for
each time step. Cluster II magnetic footprints as in Fig. 3. Thicker green line: location of the convection reversal boundary (CRB; dashed: approximate location). Right panel: southward component of the electric field measured by the EFW instrument on Cluster II spacecraft 2 (in mV/m). Dashed red line: CRB as inferred from the EFW data.
following its equatorward motion between 23:00–23:35 UT. At ∼23:35 UT, following an intensification in the auroral dis-play in the main westward electrojet body, a discrete arc ex-pands poleward and reaches ∼68.5◦ latitude at 23:37 UT. This discrete arc structure gradually fades out during the fol-lowing minutes, but a region of diffuse aurora continues to persist approximately up to the latitude of the previous arc position.
Figure 4 (left panel) shows data of the STARE radar, dis-played in a similar manner as the other MIRACLE data: for each timestep (here with a 20 s resolution), the northward component of the electric field is shown along the central meridian of the radar’s field of view. Since for our event, only the STARE station located in Midtsantan, Norway (63.4◦N, 10.7◦E), but not the one in Hankasalmi, Finland (62.3◦N, 26.9◦E), was operative, we assume that the northward com-ponent of the electric field measured by the Norwegian radar equals the total northward electric field. For electrojet-type situations, the Norwegian radar is often looking close to the direction of the plasma flow, and measures the electric field perpendicular to it: as a result, this is a reasonable approxi-mation (e.g. Untiedt and Baumjohann, 1993). From 23:30– 23:40 UT, in the whole range of latitudes which STARE covers, southward electric fields (as expected in the west-ward electrojet region) are observed. Between 23:40 and ∼23:45 UT, a region of weak or partly missing STARE data (white areas) is observed. This can be indicative for the CRB approaching from the poleward side (cf., e.g. Nielsen and
Greenwald, 1979). A region covered by northward elec-tric fields (as expected in the area of eastward currents) in-trudes the STARE field of view after 23:45 UT. From 23:45– 23:50 UT, a first rapid, then slower equatorward movement of the CRB is seen, reaching its equatormost position with 69.7◦latitude at 23:50 UT, before the CRB recedes poleward after 23:54 UT. The location of the CRB is schematically marked by the thicker green line.
The right panel of Fig. 4 shows the EFW data of the south-ward electric field component from spacecraft 4 (magnetic footprint path marked by the red line in the left panel), as mapped to the ionosphere. The data have been averaged over a scale length of ∼20 km which corresponds to the spatial resolution of STARE. A natural coordinate system to study the electric field is the field-aligned coordinate (FAC) sys-tem, where two axes are located in the plane of the Earth’s magnetic field and the third axis is perpendicular to the plane. To convert the two measured electric field components in the spin plane to the FAC coordinate system, several steps must be taken: the third component of electric field is calculated by assuming that the electric field along B vanishes, the ν×B term is removed and finally, the electric field components are rotated to the FAC system. However, when B is located in the spin plane, actually only one component of the electric field perpendicular to B is measured, and the transforma-tion to the FAC system cannot be done. The results in the FAC system become more uncertain the closer the satellite is to this location. In the calculations made in this study, the
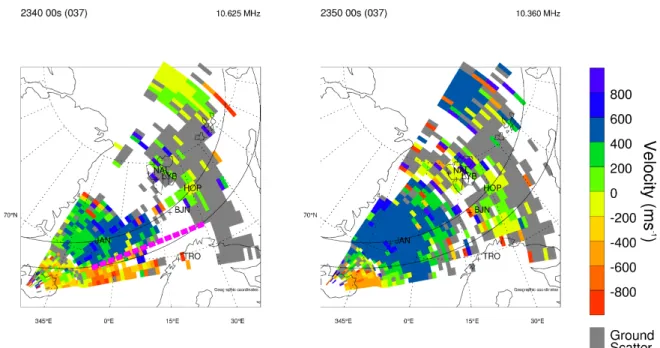
Fig. 5. Line-of-sight velocity (in m/s) from the CUTLASS Iceland East radar for 23:40 UT (left panel) and 23:50 UT (right panel). Positive
values correspond to velocities towards the radar, negative ones are away from the radar. The pink dashed line in the left panel marks the location of the CRB.
measured, not model B is used and we have extended the calculation of the north-south electric up to the point where B deviates 2◦from the spin plane, keeping the uncertainty in
mind. Generally, a very good agreement between the STARE and the Cluster EFW data can be seen. The CRB is observed by EFW at ∼70.85◦(see the dashed red line), while the mag-netic footprint in the left panel crosses the CRB observed by STARE about 0.1◦more poleward. For our mesoscale study, this small difference, which may point to a slight mapping error, is negligible. The good structural agreement also holds otherwise, except for in an area between ∼67.9–68.9◦ lati-tude, where northward electric fields are measured by EFW, and southward electric fields are measured by STARE. This might be a consequence of electric field structures related to the discrete auroral arc which evolves in this area (see Fig. 3), which can make a direct electric field mapping impossible.
To further validate and confirm the movement of the CRB as inferred from the STARE data, Fig. 5 shows the line-of-sight plasma velocity as measured by the CUTLASS Iceland East radar. In the region close to the northern coast of Scan-dinavia, this radar looks mainly in a zonal direction, and thus observes zonal plasma flows equivalent to meridional electric fields. The left panel shows the plasma velocities at 23:40 UT. In the near and middle ranges, a region of eastward flow inferred from the flow away from the radar (correspond-ing to southward electric field) is separated from a more pole-ward region of westpole-ward flow inferred from the flow topole-ward the radar (corresponding to northward electric field). The separatrix, i.e. the CRB (marked by a hatched pink line) is located at∼72◦latitude at the central STARE meridian (i.e. at 20◦longitude). This confirms that at 23:40 UT, the CRB
was located just polewards of the STARE field of view. At 23:50 UT (right panel), except for a small patch of eastward flow at very near ranges, the region of westward flow extends to the equatorward boundary of the Iceland East radar’s field of view. This is in accordance with the CRB location being at 69.7◦latitude, as inferred from STARE.
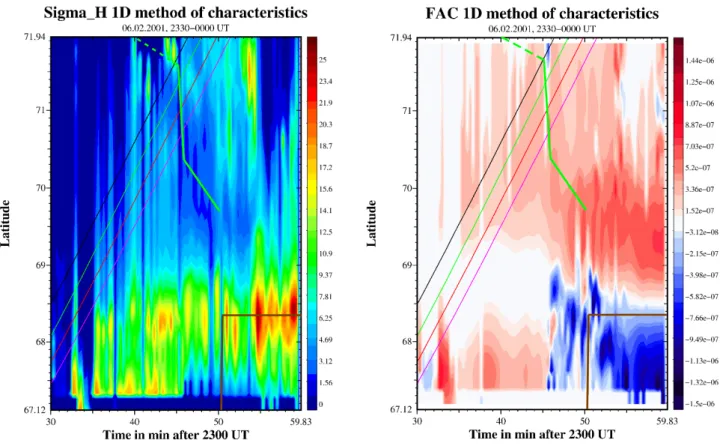
Figure 6 shows the results of the 1-D method of character-istics for the Hall conductance 6H (left panel) and the FAC
(right panel) for the interval 23:30–00:00 UT. For the cal-culation, we assume a Hall-to-Pedersen conductance ratio of 1. Again, the Cluster magnetic footprints and the position of the CRB from 23:40–23:50 UT are marked. From 23:30– 23:45 UT, the poleward portion of the westward electrojet is visible as an area of enhanced Hall conductances ranging from ∼10–20 S (note that areas in which the Hall conduc-tance is zero indicate missing STARE data, or that the data did not satify the 1-D condition). Also, the poleward ex-tension of the electrojet’s width after 23:35 UT can be seen. Poleward of ∼69◦latitude, only small 6H values up to ∼5 S
are observed, consistent with the lack of aurora observed by the ASC. A conductance minimum is inferred at the CRB, along most of which 6H ranges only around 2 S. The FAC
distribution during this time interval shows the downward currents at the poleward flank of the westward electrojet in the equatorward portion of the analysis area, with magni-tudes of ∼0.3–1 µA/m2. Poleward of a region of very small FACs, another area of downward FAC is visible. The am-plitude of this FAC region maximises in the vicinity of the CRB, with ∼0.3–0.5 µA/m2. Between 23:45 and 23:54 UT, in the westward electrojet region, STARE received either no electric field values, or only very small electric field values.
Fig. 6. Results of the 1-D method of characteristics for 6H(left panel, in S), and FAC (right panel, in µAm−2, positive values correspond to
downward FAC), in the same format as Fig. 4 (left panel). The peak location of the westward electrojet (when entering the analysis region, compare Fig. 3) is schematically indicated by the brown line.
Since these data may be unreliable, we are not discussing the results in this region in any detail, although reasonable val-ues for 6H and FAC values emerge from our analysis. In the
poleward portion of the analysis region between ∼69.5◦and 70.3◦ of latitude, i.e. around the CRB and around an area of a conductance minimum, a stronger sheet of downward FAC with amplitudes up to ∼1.4 µA/m2 is visible. After 23:54 UT, the poleward movement of the westward electro-jet’s body is seen in 6H , which reaches maximum values of
∼25 S. Now both the upward FAC on the equatorward flank and the downward FAC on its poleward flank appear inside the analysis region, with similar maximum absolute values of ∼1.5 µA/m2. Poleward of this FAC system, another region of downward FAC exists which is, however, in part contami-nated by missing STARE data.
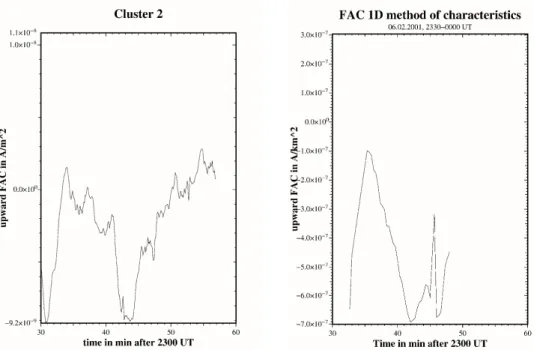
The FAC as inferred from the Cluster II spacecraft be-tween 23:00 and 00:00 UT is displayed in Fig. 7 (data of Cluster 3 is not shown since the magnetometer on this space-craft was not operational during the full time interval). Since our intention is to study the mesoscale FAC structure and to compare it to the FAC derived from the 1-D method of char-acteristics, we have applied a running average over 50 km to the original data. This removes small-scale structures which are not of interest for our study. Although the cur-rent sheets are slightly diffecur-rently developed along the three satellite paths, the basic structure of the observed mesoscale
FACs is the same for all spacecraft: it consists of one upward current sheet which the spacecraft pass between ∼23:10 and 23:27 UT (consistent with the region of auroras in Fig. 3), and two distinctly separated downward current sheets; the first one is passed between 23:27 and 23:35 UT, and the sec-ond one from ∼23:42–23:52 UT. The maximum absolute FAC values are with ∼9 nA/m2similar for all three sheets, but the upward one is the broadest.
In order to compare the mesoscale FAC results obtained from the ground and from the spacecraft, Fig. 8 shows in the left panel the Cluster II FAC as derived from spacecraft 2, and in the right panel the FAC obtained from the 1-D method of characteristics along the magnetic footprint path of that spacecraft, for the period 23:30–00:00 UT. As can be seen, the general shape of the curves corresponds very well in that two downward current regions separated by an area of small FACs are visible in both panels. If we map the FAC minimum of −9.2 nA/m2occurring at the spacecraft between ∼23:42 and 23:44 UT to the ionospheric level (again using the Tsy-ganenko 89 model with Kp =3), an ionospheric FAC
den-sity of −0.84 µA/m2results, slightly larger but still in good agreement with the FAC minimum of −0.7 µA/m2inferred from the ground-based data.
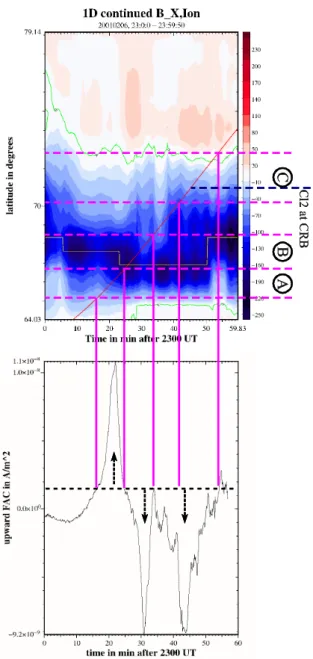
For the example of spacecraft 2, the relation between the FAC regions and the magnetic signatures as derived by the 1-D upward continuation method are shown in Fig. 9. The
-Fig. 7. FAC as calculated from the Cluster II spacecraft 1, 2 and 4, at the spacecraft altitude, using the assumption of infinite current sheets
(in Am−2, positive values correspond to upward FAC).
Fig. 8. Comparison of the FAC as calculated from Cluster spacecraft 2 (left panel), and the results of the 1-D method of characteristics along
the ionospheric magnetic footprints of the spacecraft (right panel); in Am−2, positive values correspond to upward FAC.
broad region of upward FAC between 64.7◦and 67.1◦ lati-tude (denoted as region “A”) corresponds to the equatorward flank of the westward electrojet, where southward flowing Pedersen currents are diverted to the magnetosphere. The first downward FAC area between 67.1◦ and 68.4◦latitude (region “B”) is located at the poleward flank of the westward electrojet, where the above mentioned Pedersen currents are fed. Between 68.4◦ and 70.2◦ latitude (region “B’”) an area of smaller FAC is observed while the spacecraft skims along the northern flank of the westward electrojet, before
it reaches the second downward FAC region ranging from 70.2◦to 72.5◦latitude (region “C”) which includes the CRB at ∼71◦ latitude. Note that during the spacecraft’s passage through regions B’ and C, the main body of the westward electrojet is still located at ∼67◦ latitude. A clear shift of ∼1.5◦latitude exists between the CRB and the MCRB (yel-low contour line in Fig. 9) which is located at the poleward flank of region C. This will be discussed in Sect. 4. Poleward of 72.5◦latitude, the satellite is crossing the region of weak eastward currents.
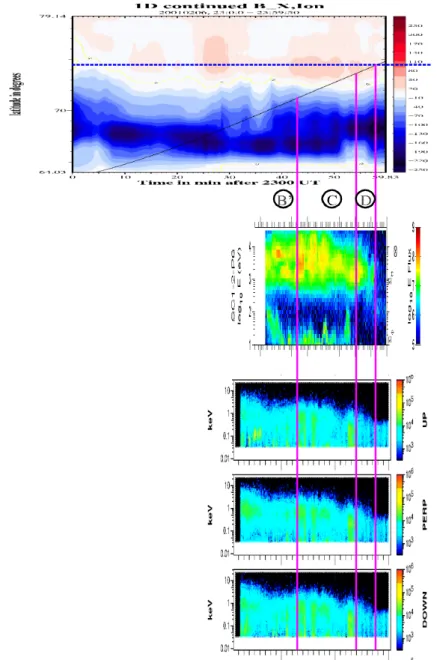
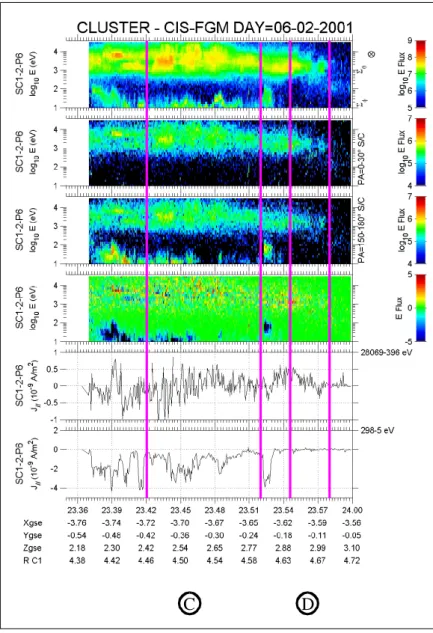
The ionospheric magnetic field/equivalent current regions are compared to the characteristics of the electron and ion energy spectra observed by Cluster in Fig. 10. As the CIS instrument on spacecraft 2 is not operative, for this compar-ison we use data of spacecraft 1. The upper panel shows the 1-D upward continuation results, which we again use for orientation, together with the Cluster II spacecraft 1 mag-netic footprint path. The PEACE instrument started oper-ating after the perigee encounter at ∼23:31 UT, and CIS at ∼23:37 UT. Thus, the instruments mainly record data inside regions B’ and C as defined above. The CIS energy spectrum, integrated over all azimuths and elevations (middle panel) shows two main ion populations: A high energy (∼300 eV– 10 keV) and a low energy (below 100 eV) one. While the low-energy population has a patchy appearance with some acceleration signatures, the high-energy one is more stable, although intermediate flux intensifications are visible. No principal difference can be seen between the signatures in re-gions B’ and C. The PEACE electron energy spectra (lower panel) are divided up into upward flowing (away from the Earth; upper graph), perpendicular to the ambient magnetic field (middle graph), and downward flowing electrons. The instrument’s basic pitch-angle resolution is 15◦ (see John-stone et al., 1997). Note that the units of the colour bar are raw counts. As can be seen, the spectra are almost isotropic, except for acceleration features in the upward going electrons between 23:34–23:36 UT. These features belong to the feed-ing region of the discrete auroral arc seen close to the zenith of ABK in Fig. 3, and are not discussed in detail here, since we are interested in mesoscale features. The electron pop-ulation consists of a background species which is quite uni-formly distributed over the energies up to 5 keV in region C, with a clear tendency of decreasing maximum energy toward the pole. Some intensifications, in part colocated with inten-sifications in the ion energies, are seen throughout regions B’ and C. Poleward of ∼73.7◦, these intensifications cease to ex-ist both in the low-energy ions and in the electrons, and the maximum energy of the background electron species drops to ∼0.5 keV. However, the high-energy ions are still present up to ∼74.4◦latitude, where a velocity-dispersed ion signa-ture is probably detected (Bosqued et al., 1993). We call the region between these boundaries “region D”, and expect the open-closed field line boundary to be located at the poleward edge of this region (cf., e.g. Sotirelis et al., 1998).
A more detailed analysis of the CIS data is presented in Fig. 11. In addition to the total ion spectrum (upper panel), the downgoing (pitch-angle range 0–30◦) and
upgo-ing (pitch-angle range 150–180◦) ions are shown in the
sec-ond and third panels, and the difference between these down-and upgoing spectra is in the fourth panel. The most obvious feature is that the low-energy ion population is only visible in the upgoing ion part, and thus fully consists of ions ac-celerated upward from the ionosphere. From panels two and three, it appears that the upgoing and downgoing fluxes of the high-energy population are almost balanced. However, the difference plot in panel four exhibits an almost continu-ous excess of downward flowing ions throughout this
popula-Fig. 9. Topology of the FAC regions as observed by Cluster
space-craft 2 (lower panel, as in Fig. 7) in terms of the magnetic field on the ionospheric level (upper panel, as in Fig. 3, left panel).
tion. In the fifth and sixth panels, the FAC that are carried by the high-energy population (∼400 eV–3 keV) and by the low-energy one (5 eV–∼300 eV) are calculated, where positive values mean a net downward FAC. The intermittent bursts of upgoing low-energy ionospheric ions carry FAC densities up to 4 nA/m2, significantly larger than the high-energy ions which mainly result in a net downward FAC, but only of up to ∼0.5 nA/m2. While in region C both populations coexist (and also electron bursts exist), in region D the high-energy ion part contributes solely to the FAC carried by ions.
Fig. 10. PEACE electron spectra for downgoing (lowest panel), perpendicular to the magnetic field (second panel from the bottom), and
upgoing (third panel from the bottom) electrons, from Cluster spacecraft 1; CIS ion spectrum from Cluster spacecraft 1, integrated over all elevations and azimuths (second panel from the top); for orientation, the magnetic field on the ionospheric level (upper panel, as in Fig. 3, left panel) is also plotted, together with the magnetic footprint path of spacecraft 1.
4 Discussion
The mesoscale ionospheric electrodynamic, auroral, and par-ticle situation observed at the early morning side shear flow region on 6 February 2001, using Cluster II and MIRA-CLE observations, is schematically sketched in Fig. 12. This sketch is an expanded version of the summary sketch of Amm et al. (2000), whose ground-based results are essen-tially confirmed by the data of the present event, but signif-icantly extended and fine tuned due to the availability of the Cluster II satellite data. Starting at low latitudes (left side of Fig. 12), we first encounter the upward FAC region of the westward electrojet (region A) inside which the
conduc-tances are increasing towards the center of the jet. Although no particle data from the satellites are available, from the presence of diffuse aurora (see Fig. 3) it is clear that the up-ward FAC in this region are mainly carried by precipitating electrons. As the divergence of the electric field is small in that region, the FAC are mainly related to the positive pole-ward conductance gradient of the Pedersen conductance. In region B which extends poleward from the center of the west-ward electrojet, a negative Pedersen conductance gradient to-ward the pole is associated with a downto-ward FAC region. In this region, as well as in region B’, no mesoscale auroral fea-tures are present. However, on smaller scales, auroral arcs and adjacent auroral cavities can exist, like after ∼23:35 UT
D
C
Fig. 11. Detailed analysis of CIS data from Cluster spacecraft 1. Upper four panels, from the top: ion spectra, integrated over all elevations and az-imuths; downward flowing ions (pitch-angle range 0–30◦); upward flowing ions (pitch-angle range 150–180◦); dif-ference between downward and upward flowing ions; Lower two panels, from the bottom: FAC as calculated from the low-energy ions (5–298 eV), and from the high-energy ions (396–28 069 eV); in nAm−2, positive values correspond to downward FAC.
in our event. Also in this region, no particle data are available from Cluster, but the small-scale arcs and adjacent cavities are well known to be associated with downward and upward flowing electrons, respectively (e.g. Marklund et al., 1997; Karlsson and Marklund, 1998; McFadden et al., 1999; Jan-hunen et al., 2001).
Poleward of a region with small FAC and low conduc-tances (region B’), region C consists of a second downward FAC region in the vicinity of the CRB. As the conductance gradients (and the conductances themselves) are small here (Fig. 6), most of the downward FAC are caused by the posi-tive divergence of the electric field around the CRB (Fig. 4). From the particle point of view, this region is characterised by medium to high-energy ion population that contributes to the downward FAC, as well as by upward low-energy ion and electron beams. The electron background population is almost isotropic and uniform below ∼5 keV. As our analy-sis shows, the precipitating ions contribute to a net FAC of only ∼0.5 nA/m2(Fig. 11), while the maximum FAC density
inferred by the magnetometers in this region is ∼9 nA/m2 (Fig. 7). Thus, the major part of the downward FAC has to be carried by upward flowing electrons. While such electron are seen in the PEACE data, a substantial part of the downward FAC is expected to be carried by electrons at energies below the spacecraft potential, and thus cannot be unambigously detected by PEACE.
The mesoscale double structure of downward FAC at the morning-side shear region, which was the result in this study and in the one of Amm et al. (2000), is not present in the global-scale results on the FAC structure, like the classical one of Iijima and Potemra (1978), or the AMIE results by Ridley et al. (1998). This is understandable since the sep-aration of the two FAC sheets which varies between ∼0.5 and 2◦is smaller than the typical resolution of these studies. Like in some of the events shown by Amm et al. (2000), or in our event between 23:45 and 23:53 UT, the two sheets can overlap each other. Their separation is likely to be controlled by the IMF parameters; however, due to the uncertainties in
open/closed fieldline boundary
A
B
B’
C
D
Fig. 12. Summary sketch of the observations and analysis results for the ionospheric electrodynamic, auroral, and particle signatures along
the early morning side shear flow region.
mapping IMF data available for our event to the magneto-sphere, this cannot be analysed in detail in the present work. Except for their separation, the most important difference be-tween the two sheets is their different role in terms of the ionospheric electrodynamics, as described above.
The MCRB is located at the poleward edge of region C, ∼0.5◦–1.5◦poleward of the CRB (varying with time). Such a shift between the electric field and the magnetic field sig-natures is to be caused by the magnetic field effect of distant currents, in this case mainly by FAC. Analysing a Harang dis-continuity event on the evening side, i.e. a similar shear flow region but with reversed sign of the ionospheric current flows and FAC, Amm (1998) concluded that the poleward shift of the CRB with respect to the MCRB which was found on the evening side (compare also Untiedt and Baumjohann, 1993) was caused by a positive zonal gradient in the absolute value of the upward FAC along the shear zone toward midnight. Although our results cannot be used to check zonal FAC gra-dients (note that the FAC result in Fig. 8 is a temporal, not a spatial one), a similar positive gradient of FAC toward mid-night on the early morning side would cause the observed poleward shift of the MCRB with respect to the CRB here.
In region D, except for a background electron population with a maximum of ∼500 eV energy, only the high-energy ion population remains, and contributes to the downward FAC of up to 0.5 nA/m2. Such a difference of the poleward
drop-off between the ions and electrons has also been noted by Newell et al. (1996). We estimate the open-closed field line boundary to be located at the poleward edge of this re-gion where the high-energy ions also disappear. Thus, this boundary is located ∼3–4◦ poleward of the CRB for our
event. We conclude that, at least for mesoscale and smaller scale studies, the common practice to use the CRB as a proxy for the open-closed field line boundary can lead to consider-able errors.
Using the classical topological definition of nightside par-ticle precipitation by Winningham et al. (1975), the area from the equatorward edge of particle data availabilty (which is in-side region B’, according to our FAC-based topology) to the poleward edge of region D belongs to the boundary plasma sheet (BPS), while the remaining poleward portion is located inside the polar cap. In the more refined classification of Newell et al. (1996), the equatorward boundary of region D corresponds to their boundary b5e, while the poleward boundary of region D is identical with their boundary b5i. In both classification schemes, no obvious particle boundaries correspond to the borders of regions B’ and C which were determined by the FAC structure. This supports the state-ment of Ohtani et al. (1995a) that it is probably not practical to classify FAC systems in terms of particle precipitation.
5 Summary
The main results of our analysis of an early morning sector shear flow region on 6 February 2001, between 23:00 and 00:00 UT, using data of the Cluster II satellites, the ground-based MIRACLE network, and the CUTLASS radar can be summarised as follows:
1. The FAC structure along the shear flow region con-sists, from the westward electrojet on polewards, of three sheets: an upward and downward FAC sheet at the equatorward and poleward flank of the westward electrojet, mainly caused by meridional gradients of the ionospheric conductances, and another downward FAC sheet in the vicinity of the CRB, located 0.5◦–2◦ pole-ward of the previous one. This latter FAC sheet is mainly associated with the positive divergence of the electric field. The FAC regions are named regions A–C, respectively, from the equatorward to the poleward side; 2. Both with respect to the FAC structure and to the loca-tion of the CRB, an excellent agreement exists between the satellite and ground-based results, when the satellite data is averaged to the mesoscale resolution which the ground-based instruments observe;
3. The ionospheric conductances in the westward electro-jet region reach values up to ∼25 S (regions A and B), but poleward of region B, only small Hall conductance values of ∼5 S are observed. The CRB is associated with a conductance minimum. A band of diffuse aurora is observed in region A, while in region B, either no au-rora or discrete, smaller scale arc systems are present; 4. In the downward FAC regions, where Cluster II
parti-cle data are available, no parti-clear partiparti-cle boundaries were found to be associated with the FAC regions. Calcu-lation of the FAC associated with downward flowing ions show that they contribute at most 0.5 nA/m2to the downward FAC at Cluster’s altitude, while the total FAC reaches up to ∼9 nA/m2. Thus, the major part of the downward FAC in regions B and C has to be carried by upward accelerated electrons. While such electrons are seen in the PEACE data, a substantial part of the downward FAC is expected to be carried by electrons at energies below the spacecraft potential, and thus cannot be unambigously detected by PEACE;
5. The magnetic convection reversal boundary (MCRB) is located 0.5◦–1.5◦poleward of the CRB, opposite to what is observed in the evening sector, where the CRB is located more poleward. This behaviour can be ex-plained by a positive gradient of the absolute value of the FAC in regions B and C toward midnight;
6. Poleward of the MCRB, a region exists where, except for an almost isotropic background electron population with energies up to 500 eV, only a high-energy ion pop-ulation with energies of ∼500 eV–4 keV exists. The
open-closed field line boundary is located at the pole-ward flank of this region, ∼3◦–4◦poleward of the CRB.
Thus, using the CRB as a proxy for the open-closed field line boundary can lead to large errors.
Acknowledgements. The authors are grateful to the Principal
In-vestigators, Henri R`eme (CIS), Andr´e Balogh (FGM), and G. Gustaffson (EFW), for providing Cluster data. We like to thank R. Lepping (NASA/GSFC) and N. Ness (Bartol Research Institute) for data of the WIND and ACE satellites retrieved via CDAWeb. O.A. likes to thank the Academy of Finland for financial support. The MIRACLE network is operated within an international cooper-ation. Operations for the CUTLASS radar are funded by the Particle Physics and Astronomy Research Council (PPARC) and the Finnish Meteorological Institute. Research at CETP and CESR is supported by CNES (French Space Agency).
The Editor in Chief thanks R. Nakamura for her help in evalu-ating this paper.
References
Amm, O., Janhunen, P. , Opgenoorth, H. J., Pulkkinen, T. I., and Viljanen, A.: Ionospheric shear flow situations observed by the MIRACLE network, and the concept of Harang Discontinuity, AGU monograph on magnetospheric current systems, Geophys-ical Monograph 118, 227, 2000.
Amm, O.: Method of characteristics in spherical geometry applied to a Harang discontinuity situation, Ann. Geophysicae, 16, 413, 1998.
Balogh, A., Dunlop, M. W., Cowley, S. W. H., Southwood, D. J., Thomlinson, J. G., Glassmeier, K. H., Musmann, G., Luhr, H., Buchert, S., Acuna, M. H., Fairfield, D. H., Slavin, J. A., Riedler, W., Schwingenschuh, K., and Kivelson, M. G.: The Cluster Mag-netic Field Investigation, Space Science Rev., 79, 65, 1997. Berry, S. T., Kersley, L., Moen, J., and Denig, W. F.: Ionospheric
signatures of magnetospheric boundaries in the post-noon sector, Ann. Geophysicae, 18, 74, 2000.
Bosqued, J. M., Ashour-Abdalla, M., El Alaoui, M., Peroomian, V., Zelenyi, L. M., and Escoubet, C. P.: Dispersed ion structures at the poleward edge of the auroral oval: low-altitude observations and numerical modeling, J. Geophys. Res., 98, 19 181, 1993. Erickson, G. M.: The physics of the Harang Discontinuity, J.
Geo-phys. Res., 96, 1633, 1991.
Greenwald, R. A., Baker, K. B., Dudeney, J. R., Pinnock, M., Jones, T. B., Thomas, E. C., Villain, J.-P., Cerisier, J.-C., Senior, C., Hanuise, C., Hunsucker, R. D., Sofko, G., Koehler, J., Nielsen, E., Pellinen, R., Walker, A. D. M., Sato, N., and Yamagishi, H.: DARN/ SuperDARN: A global view of the dynamics of high-latitude convection, Space Sci. Rev., 71, 761, 1995.
Gustafsson, G., Bostr¨om, R., Holback, B., Holmgren, G., Lundgren, A., Stasiewicz, K, ˚Ahl´en, L., Mozer, F. S., Pankow, D., Harvey, P., Berg, P., Ulrich, R., Pedersen, A., Schmidt, R., Butler, A., Fransen, A. W. C., Klinge, D., Thomsen, M., F¨althammar, C.-G., Lindqvist, P.-A., Christenson, S., Holtet, J., Lybekk, B., Sten, T. A., Tanskanen, P., Lappalainen, K., and Wygant, J.: The elec-tric field and wave experiment for the Cluster mission, Space Sci. Rev., 79, 137, 1997.
Heppner, J. P. and Maynard, N. C.: Empirical high-latitude electric field models, J. Geophys. Res., 92, 4467, 1987.
Inhester, B., Untiedt, J., Segatz, M., and Krschner, M.: Direct deter-mination of the local ionospheric Hall conductance distribution from two-dimensional electric and magnetic field data, J. Geo-phys. Res., 97, 4073, 1992.
Janhunen, P., Olsson, A., Peterson, W. K., Laakso, H., Pickett, J. S., Pulkkinen, T. I., and Russell, C. T.: A study of inverted-V au-roral acceleration mechanisms using Polar/Fast auau-roral snapshot conjunctions, J. Geophys. Res., 106, 18 995, 2001.
Johnstone, A. D., Alsop, C., Burge, S., Carter, P. J., Coates, A. J., Coker, A. J., Fazakerley, A. N., Grande, M., Gowen, R. A., Gur-giolo, C., Handcock, B. K., Narheim, B., Preece, A., Sheather, P. H., Winningham, J. D., and Woddliffe, R. D: PEACE: a Plasma electron and current experiment, Space Sci. Rev., 79, 351, 1997. Kamide, Y. and Baumjohann, W.: Magnetosphere-Ionosphere
Cou-pling, Springer-Verlag, Berlin/ Heidelberg, 1993.
Karlsson, T. and Marklund, G.: Simulation of effects of small-scale auroral current closure in the return current region, Phys. of Space Plasmas, 15, 401, 1998.
Kauristie, K., Syrj¨asuo, M. T., Amm, O., Viljanen, A., Pulkkinen, T. I., and Opgenoorth, H. J.: A statistical study of evening sector auroral arcs and electrojets, Adv. Space Res., 28, 11, 1605, 2001. Lester, M., Davies, J. A., and Virdi, T. S.: High-latitude Hall and Pedersen conductances during substorm activity in the SUNDIAL-ATLAS campaign, J. Geophys. Res., 101, 26 719, 1996.
Marklund, G., Karlsson, T., and Clemmons, J.: On low-altitude par-ticle acceleration and intense electric fields and their relationship to black aurora, J. Geophys. Res., 102, 17 509, 1997.
Maynard, N. C.: Electric field measurements across the Harang Dis-continuity, J. Geophys. Res., 79, 4620, 1974.
McFadden, J. P., Carlson, C. W., and Ergun, R. E.: Microstructure of the auroral acceleration region as observed by FAST, J. Geo-phys. Res., 104, 14 453, 1999.
Mersmann, U., Baumjohann, W., K¨uppers, F., and Lange, K.: Anal-ysis of an eastward electrojet by means of upward continuation of ground-based magnetometer data, J. Geophys., 45, 281, 1979. Newell, P. T., Burke, W. J., S´anchez, E. R., Meng, C.-I., Greenspan, M. E., and Clauer, C. R.: The low-latitude boundary layer and the boundary plasma sheet at low altitude: Prenoon precipitation regions and the convection reversal boundary, J. Geophys. Res., 96, 21 013, 1991.
Newell, P. T., Feldstein, Y. I., Galperin, Y. I., and Meng, C.-I.: Mor-phology of nightside precipitation, J. Geophys. Res., 101, 10 737, 1996.
Nielsen, E. and Greenwald, R. A.: Electron flow and visual aurora at the Harang Discontinuity, J. Geophys. Res., 84, 4189, 1979. Ohtani, S., Potemra, T. A., Newell, P. T., Zanetti, L. J., Iijima,
T., Watanabe, M., Yamauchi, M., Elphinstone, R. D., de la Beaujardi `Ere, O., and Blomberg, L. G., Simultaneous prenoon and postnoon observations of field-aligned current systems from Viking and DMSP-F7, J. Geophys. Res., 100, 119, 1995a. Ohtani, S., Potemra, T. A., Newell, P. T., Zanetti, L. J., Iijima, T.,
Watanabe, M., Blomberg, L. G., Elphinstone, R. D., Murphree, J. S., Yamauchi, M., and Woch, J. G.: Four large-scale field-aligned current systems in the dayside high-latitude region, J. Geophys. Res., 100, 137, 1995b.
R`eme, H., Aoustin, C., Bosqued, J. M., Dandouras, I., Lavraud, B., Sauvaud, J. A., Barthe, A., Bouyssou, J., Camus, Th.,
Coeur-Kistler, L. M., Crocker, K., Granoff, M., Mouikis, C., Popecki, M., Vosbury, M., Klecker, B., Hovestadt, D., Kucharek, H., Kuenneth, E., Paschmann, G., Scholer, M., Sckopke, N., Sei-denschwang, E., Carlson, C. W., Curtis, D. W., Ingraham, C., Lin, R. P., McFadden, J. P., Parks, G. K., Phan, T., Formisano, V., Amata, E., Bavassano-Cattaneo, M. B., Baldetti, P., Bruno, R., Chionchio, G., Di Lellis, A., Marcucci, M. F., Pallocchia, G., Korth, A., Daly, P. W., Graeve, B., Rosenbauer, H., Va-syliunas, V., McCarthy, M., Wilber, M., Eliasson, L., Lundin, R., Olsen, S., Shelley, E. G., Fuselier, S., Ghielmetti, A. G., Lennartsson, W., Escoubet, C. P., Balsiger, H., Friedel, R., Cao, J-B., Kovrazhkin, R. A., Papamastorakis, I., Pellat, R., Scudder, J., and Sonnerup, B.: First multispacecraft ion measurements in and near the Earth’s magnetosphere with the identical Cluster ion spectrometry (CIS) experiment, Ann. Geophysicae, 19, 1303, 2001.
Rich, F. J. and Hairston, M.: Large-scale convection patterns ob-served by DMSP, J. Geophys. Res., 99, 3827, 1994.
Ridley, A. J. and Clauer, C. R.: Characterization of the dynamic variations of the dayside high-latitude ionospheric convection re-versal boundary and relationship to interplanetary magnetic field orientation, J. Geophys. Res., 101, 10 919, 1996.
Ridley, A. J., Gang Lu, Clauer, C. R., and Papitashvili, V. O.: A statistical study of the ionospheric convection response to chang-ing interplanetary magnetic field conditions uschang-ing the assimila-tive mapping of ionospheric electrodynamics technique, J. Geo-phys. Res., 103, 4023, 1998.
Robinson, R. M., Vondrak, R. R., Miller, K., Dabbs, T., and Hardy, D.: On calculating ionospheric conductances from the flux and energy of precipitating electrons, J. Geophys. Res., 92, 2565, 1987.
Senior, C., Delcourt, D., Cerisier, C., Hanuise, C., Villain, J.-P., Greenwald, R. G., Newell, P. T., and Rich, F. J.: Correlated observations of the boundary between polar cap and nightside auroral zone by HF radars and the DMSP satellite, Geophys. Res. Lett., 21, 221, 1994.
Sotirelis, T., Newell, P. T., and Meng, C.-I.: Shape of he open-closed boundary of the polar cap as determined from observa-tions of precipitating particles by up to four DMSP satellites, J. Geophys. Res., 103, 399, 1998.
Syrj¨asuo, M., Pulkkinen, T. I., Pellinen, R. J., Janhunen, P., Kau-ristie, K., Viljanen, A., Opgenoorth, H. J., Karlsson, P., Wallman, S., Eglitis, P., Amm, O., Nielsen, E., and Thomas, C.: Obser-vations of substorm electrodynamics using the MIRACLE net-work, Proc. Fourth International Conference on Substorms (ICS-4), Lake Hamana, Japan, March 9-13, 1998.
Trochichev, O. A., Shiskina, E. M., Lu, G., and Richmond, A. D.: Relationship of the ionospheric convection reversal to the hard auroral precipitation boundary, J. Geophys. Res., 101, 15 423, 1996.
Untiedt, J. and Baumjohann, W.: Studies of polar current systems using the IMS Scandinavian magnetometer array, Space Sci. Rev., 63, 245, 1993.
Winningham, J. D., Yasuhara, F., Akasofu, S.-I., and Heikkila, W. J.: The latitudinal morphology of 10-eV to 10-keV elec-tron fluxed during magnetically quiet and disturbed times in the 21:00–03:00 MLT sector, J. Geophys. Res., 80, 3148, 1975.