Complementary feeding practices and nutritional
status of children 6-23 months in Kitui County, Kenya
Kimiywe J. and Chege P. MProf. Judith Kimiywe- Principal investigator
Kenyatta University, Associate Professor Department of Food, Nutrition and Dietetics, P.O Box 43844-00100, Nairobi, Kenya. Tel: +254 722 915 459. Email: [email protected]
Dr. Peter M. Chege – Co- Investigator
Kenyatta University, Lecturer Department of Food, Nutrition and Dietetics, P.O Box 43844-00100, Nairobi, Kenya. Tel: +254 722 642 356, Email [email protected]
Original submitted in on 14th October 2014. Published online at www.m.elewa.org on 30th January 2015 http://dx.doi.org/10.4314/jab.v85i1.10
ABSTRACT
Objectives: Inappropriate complementary feeding practices among children aged 6-23 months is major cause of under nutrition. There is scarce information on the relationship between complementary feeding practices and nutritional status. This study aimed to determine the factors contributing to the complementary feeding practices and the nutritional status of children aged 6 -23 months.
Methodology and Results: A randomly selected sample of 201 children aged 6-23 months was investigated using a cross sectional analytical design in four randomly selected sub-counties in Kitui County. Data were analyzed using ENA for SMART for nutrition status, Nutri-survey for dietary intake and SPSS. Results showed that most caregivers (70.6%) had attained primary level education. Majority of respondents (69.2%) had low levels of income. The average number of meals consumed per day was 4.1 ± 0.01. The main foods consumed were carbohydrates with little consumption of fruits and vegetables. The levels of wasting, stunting and underweight were 7.0%, 22.9% and 10.9%, respectively.
Conclusions and application of findings: The complementary feeding practices were inadequate to meet the macronutrient and micronutrients needs of the children. The foods lacked variety, children took fewer meals per day and key foods were consumed less frequently than expected. The low food production in the semi- arid area coupled with low income could be associated with the food insecurity and consequently to the quality, quantity and diversity of the foods consumed by the children. The levels of malnutrition were relatively high for these children aged 6-23 months and this could be attributed to food insecurity indicated by low dietary diversity. The study noted a significant relationship between complementary feeding practices and nutritional status. The study recommends use of locally available, affordable and variety of foods to improve nutrient content of complementary foods. The study recommends agricultural interventions to enhance the nutritional content of complementary foods. Nutrition education on appropriate Infant and Young Child Feeding among mothers is essential.
Key words: Complementary feeding practices, Nutritional status, children under 6-23 months
Journal of Applied Biosciences 85:7881– 7890
INTRODUCTION
Children aged 6-23 months are at a very critical period (Butte et al., 2004; Ceatan et al., 2010). During this period, the nutritional status of the child can be corrected as it gives an excellent opportunity to affect this child’s nutritional status (WHO, 2010). However, after this period, little may be done to change the aftermath of the nutritional status. Currently in Kenya, the trend in nutritional status of children under five years is worsening thus posing a challenge to the achievement of millennium development goals. Nationally, 35% of the children under five years are stunted while 16.5% of the children within the age group are underweight and 7% wasted (KDHS, 2008-09). A nutrition assessment carried out in eastern region of Kenya showed that among the children under five years, 32.2% were stunted, 21.2% were underweight while 4.2% were wasted (KDHS, 2008-09). A lot of effort has been put to promote the maternal, newborn infant and young child nutritional status. This include the High Impact Nutrition Interventions (HINI) which aims at taking advantage of the window of opportunity before the child reaches 23 months to reverse their nutritional status to ensure that it is adequate (Ramji, 2009). This study aimed at generating information on the factors that determine the complementary feeding practices and the nutritional status of children 6-23 months in Kitui County. The recommended complementary feeding practices are diversified diet with frequent intake of foods from all food groups for at least four food groups per day, at
least four meals in a day and with continued breast-feeding (WHO, 2008). Inappropriate complementary feeding practices such as untimely introduction of complementary foods, improper frequency for feeding, low diet diversity of complementary feeds have been shown to increase the risk of under nutrition among children under-five years (Ceaton et al., 2010; Arimond et al., 2008; Chelimo, 2008; Nyangweso et al., 2007). Thus, it is important to relate complementary feeding practices and nutrition status of children. Whereas a lot has been put in place to promote, support and increase the rates of breast-feeding, there are some gaps on the relationship between complementary feeding practices and the nutritional status of under five children (Dewey, 2005). The purpose of the study was to determine the complementary feeding practices and the nutritional status of children 6-23 months of age in Kitui County. This was guided by the following specific objectives, to establish the factors that contribute to the complementary feeding practices among children 6-23 months by mothers/caregivers and to assess the nutritional status of the children. The study is important as it generated information on the gaps that exist between the foods that the children are eating and the recommended nutrients intakes. The study has recommended on how the gaps identified could be filled by using locally available foods or other interventions such as home fortification using multiple micronutrient powders where needed.
MATERIALS AND METHODS
This study adopted a cross-sectional analytical design. This was used to assess the complementary feeding practices and nutritional status among children 6 – 23 months in Kitui County. The study was carried out in Kitui County, which is one of the 6 Counties in Eastern region, Kenya. The County is located about 170 kilometres east of Nairobi and is one of the Arid and semi- arid (ASAL) regions. The County, which occupies an area of 20,450.7 km2, has a total population of 627,761 persons. It is located in the southern part of Kenya and borders Machakos and Makueni Counties to the west, Mwingi to the north, Tana River to the east and Taita Taveta to the south. The County is located between Longitudes 37º45´ and 39º0´ east and Latitudes 0º3.7´ and 3º0´ south. The
County covers an area of approximately 20, 402km² including 6, 90.3² occupied by the Tsavo National Park. The County, which is predominantly occupied by the Akamba community, is faced with challenges of water for domestic and agricultural production, low soil fertility and has a limited road network. The study targeted households with children aged 6-23 months who are residents of Kitui. The respondents were mothers/caregivers of these children. Two hundred and one (201) households were randomly selected to constitute a sample. Children were recruited from four age categories namely: 6-8 months; 9-12 months; 13-18 months and 19-23 months from the 3 districts. Kitui County is divided into 10 districts from which 4 divisions
were randomly selected to represent diversity in ecological, agronomical and cultural zones. The total target number of children and households in the County was 201 such that in each selected division, about 50 households were randomly selected and visited. Stratified sampling was used to ensure that all the age categories named 6-8, 9-12, 13-18 and 19-23 were included to ensure equal representation of the children between 6-23 months old. The households were selected using the systematic random sampling method based on the Kenya National Bureau of Statistics (KNBS) sampling framework (KNBS and ICF Macro, 2010). Ten research assistants with a minimum of a graduate degree level, some experience in dietary data collection and a good command of both written and spoken English and Swahili, were recruited to assist in dietary data collection. Majority were nutritionists and therefore they were familiar with the anthropometric and dietary measurements and assessment techniques. The group underwent a two days training on the study objectives and the methodology followed with a one-day field trial. Structured questionnaires were used to collect data on the feeding practices, patterns and nutritional status of the children. Trained research assistants to mothers/caregivers of children 6-23 months old administered the study modules. Extra effort was taken to ensure that the recorded data on foods consumed was accurately done by using actual cooked foods and household measures, which were weighed by the researchers to get actual amounts, as opposed to just asking mothers to recall or report on what was consumed and estimate amounts given. Working very closely with the nutritionist and the community health
workers was also an added advantage to getting quality and reliable data, apart from facilitating the mobilization of the subjects to ensure a representative sample. Using the homesteads to prepare the foods also allowed for observations on ingredients used and the methods of food preparation as well as amounts cooked. It also allowed for observations of home environment including sanitation and hygiene. Researchers were also able to observe the family dynamics that go into provision of foods, who prepares the foods and who feeds the child, and whether the foods were home grown or purchased. Prior to the survey, the study modules were pretested by administering the protocols to 16 caregivers in one of the study areas. The aim of the pre-test was to establish level of understanding of questions/wording by respondents, ease of understanding the language used, the ease with which the modules were administered, adequacy of instructions for the interviewer, adequacy of recording space and length of time required to administer each set of modules. After testing, the modules were discussed and adjusted accordingly. Nutritional status data were analyzed using the ENA for SMART software. Data from the 24-hour recall on amount of each ingredient consumed was analysed using Nutri-survey software to determine the amount of each nutrient consumed. These were compared with RDAs to assess for adequacy in consumption. Data from the 24-hour recall on the foods, ingredients, cooking method and amount of each ingredient consumed was computed for analysis. Quantitative data were entered into Excel worksheets, exported to SPSS software and analysed as appropriate.
RESULTS AND DISCUSSION
Child feeding practices - Almost all (98%) the children consumed other foods other than breast milk and only 4 (2%) aged 6 months were on breast-feeding only. Dietary diversity was determined based on 24-hour recall. Dietary diversity was then computed based on 7 food groups as recommended by WHO (2008) for this age group, which comprise of grains; roots and tubers; legumes and nuts dairy products; flesh foods (meat, fish, poultry and organ
meats); eggs; vitamin-A rich fruits and vegetables; other fruits and vegetables. Consumption of any amount of food from each food group was sufficient to count except if a food item was only used as a condiment. To determine minimum dietary diversity, a cut-off of at least 4 out of the above listed 7 groups was selected (FANTA & FAO, 2007).
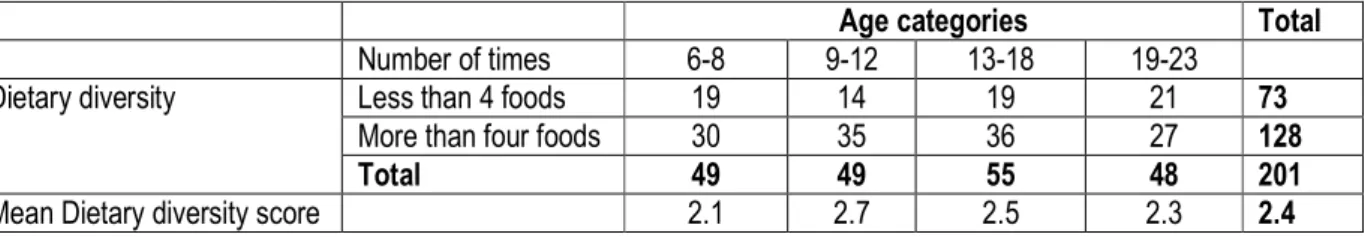
Table 1: Dietary diversity scores
Age categories Total Number of times 6-8 9-12 13-18 19-23
Dietary diversity Less than 4 foods 19 14 19 21 73 More than four foods 30 35 36 27 128 Total 49 49 55 48 201 Mean Dietary diversity score 2.1 2.7 2.5 2.3 2.4
Consumption of foods from at least 4 food groups on the previous day would mean that the children have a high likelihood of consuming at least one animal-source food and at least one fruit or vegetable that day, in addition to a staple food (grain, root or tuber) (WHO, 2008). Nearly all the children aged 6-23 months (94.4%) consumed foods made from grains, roots and tubers. Over half of the children consumed grains, roots and tubers. Vitamin-A rich fruits and vegetables were consumed by 47.8%, dairy products by 32.1%, other fruits and vegetables by 31.2% and finally legumes and nuts by 18.2% of the children aged 6-23 months old. Consumption of animal source foods was low, barely 4.6% of the children consumed eggs while consumption of dairy products and flesh foods was at 32.1 and 13.0% respectively. The mean DDS was 2.4 ± 0.25. As reported by the caregivers, the most common protein foods consumed by the children were milk, beans, eggs, chicken, goat and green grams with 87.6%, 72.1%, 63.2%, 42.8%, 39.3% and 37.8% consumption respectively while the least consumed protein food were mutton, dove, pork and lentils. The children however seemed to consume more of the cereals as compared to proteins. The cereal that was
mostly consumed by children is maize flour at 96.5%; others include rice at (65.2%), bread (60.7%), Irish potatoes (56.2%) and sorghum (52.2%) while the rest the consumption was less than 50%. More households 71.6% compared to cooking oil 33.3% used cooking fat. This could be attributed to the cost of purchasing the cooking fat as cooking oil is more expensive compared to cooking fat. The least consumed were animal fat and ghee given that their consumption was less than 5% of the children. Avocado was mostly consumed by the children with 70.1% others included ripe bananas (64.7%), pawpaw (48.3%) and oranges (38.8%). The least consumed fruits were jackfruits, squash, tangerine, loquats and custard apple (these are season dependent). The most common vegetables consumed among the children where kales (64.7%), cabbages (68.7%), tomatoes (91.5%) and onions (76.1%). The least consumed vegetables were brinjas, fresh peas, managu, sweet potatoes leaves, cucumber, okra, French beans and butternuts while the least consumed tuber was arrowroot,. When asked which foods the children consumed in the previous week, milk was consumed by the majority (72.6%) of the children, followed by beans and eggs..
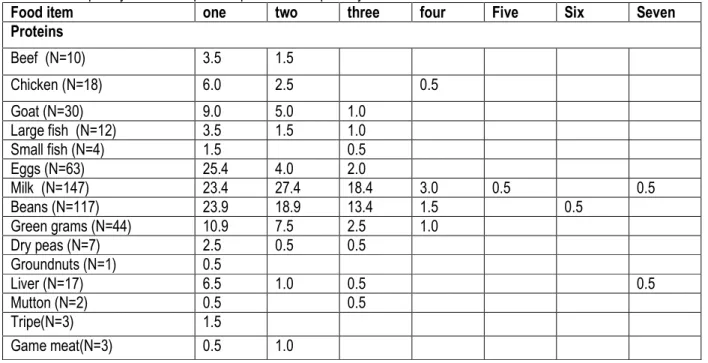
Table 2: Frequency of Consumption of protein foods per day
Food item one two three four Five Six Seven Proteins Beef (N=10) 3.5 1.5 Chicken (N=18) 6.0 2.5 0.5 Goat (N=30) 9.0 5.0 1.0 Large fish (N=12) 3.5 1.5 1.0 Small fish (N=4) 1.5 0.5 Eggs (N=63) 25.4 4.0 2.0 Milk (N=147) 23.4 27.4 18.4 3.0 0.5 0.5 Beans (N=117) 23.9 18.9 13.4 1.5 0.5 Green grams (N=44) 10.9 7.5 2.5 1.0 Dry peas (N=7) 2.5 0.5 0.5 Groundnuts (N=1) 0.5 Liver (N=17) 6.5 1.0 0.5 0.5 Mutton (N=2) 0.5 0.5 Tripe(N=3) 1.5 Game meat(N=3) 0.5 1.0 The least consumed proteins were, beef, chicken, game meat, small fish, dry peas, lentils, mutton, goat meat and liver. The most consumed cereal in the week before the survey day was maize flour and rice while the least consumed cereals were yams, pasta, tiger nuts and
maize on cob. Almost all households used cooking fat. The most consumed fruit was ripe bananas with 46.3% while least consumed fruits were; lemons, custard apple, white sapote, tangerine and jack fruit. The most consumed vegetables were; Tomatoes, onions, kales,
cabbages and spinach. The foods consumed were mostly those that were in season at the time of the study and some of the foods were purchased from the local market. Children were mostly fed on what was available at the household for the rest of the family members. Food consumption patterns of children were assessed for different food groups. The caregivers were asked the number of times the children fed on different foods in a day when the particular food is consumed. The consumption pattern showed that most of the protein foods were consumed once or twice on a day. For example, Eggs was consumed once a day by 25.4% of children, milk by 23.4% and beans by 23.9% of the children. The only protein foods that were consumed by
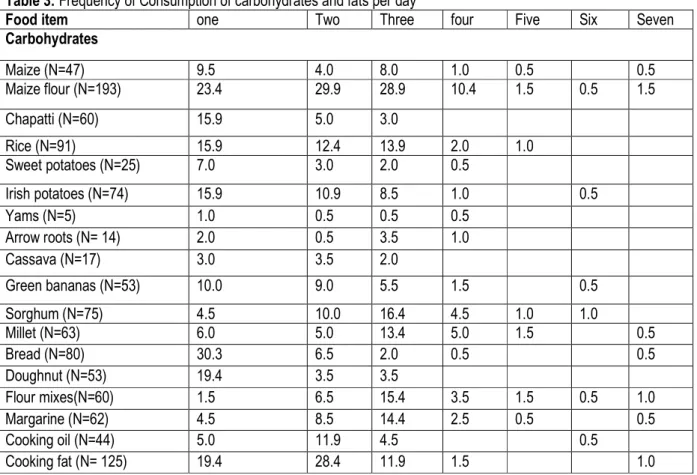
children more than six times a week were eggs milk (0.5%), and liver (0.5%) as shown in Table 2. The consumption pattern for carbohydrate showed that most of the children fed on carbohydrate foods more times on one particular day. Maize flour served mostly as porridge or maize meal was consumed up to seven times a day by 1.5% of the children. Similarly, maize (0.5%), millet (0.5%), bread (0.5%), sorghum (1%) and mix flours (1%) were also consumed up to seven times a day. Fats and oils were consumed many times a day mostly because many children were given fried or stewed foods. Table 3 presents the consumption pattern for carbohydrates and fats by children per day.
Table 3: Frequency of Consumption of carbohydrates and fats per day
Food item one Two Three four Five Six Seven Carbohydrates Maize (N=47) 9.5 4.0 8.0 1.0 0.5 0.5 Maize flour (N=193) 23.4 29.9 28.9 10.4 1.5 0.5 1.5 Chapatti (N=60) 15.9 5.0 3.0 Rice (N=91) 15.9 12.4 13.9 2.0 1.0 Sweet potatoes (N=25) 7.0 3.0 2.0 0.5 Irish potatoes (N=74) 15.9 10.9 8.5 1.0 0.5 Yams (N=5) 1.0 0.5 0.5 0.5 Arrow roots (N= 14) 2.0 0.5 3.5 1.0 Cassava (N=17) 3.0 3.5 2.0 Green bananas (N=53) 10.0 9.0 5.5 1.5 0.5 Sorghum (N=75) 4.5 10.0 16.4 4.5 1.0 1.0 Millet (N=63) 6.0 5.0 13.4 5.0 1.5 0.5 Bread (N=80) 30.3 6.5 2.0 0.5 0.5 Doughnut (N=53) 19.4 3.5 3.5 Flour mixes(N=60) 1.5 6.5 15.4 3.5 1.5 0.5 1.0 Margarine (N=62) 4.5 8.5 14.4 2.5 0.5 0.5 Cooking oil (N=44) 5.0 11.9 4.5 0.5 Cooking fat (N= 125) 19.4 28.4 11.9 1.5 1.0 Only a few of the children could be given fruits daily. The
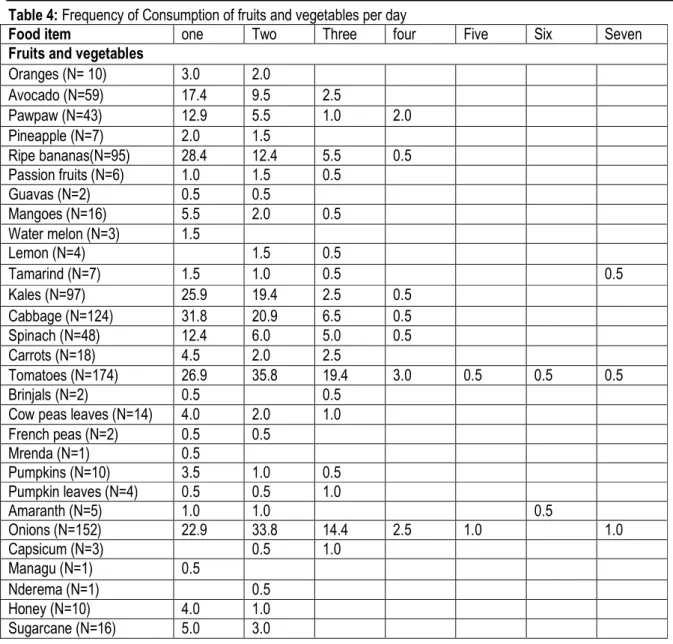
most common fruits given to the children were avocado, pawpaw and ripe banana. Fruits were not common in this study area because of drought. These fruits were not in
season were not available and are therefore expensive to purchase. For most of the children, consumption of cabbage, spinach and onion was common as shown in Table 4.
Table 4: Frequency of Consumption of fruits and vegetables per day
Food item one Two Three four Five Six Seven Fruits and vegetables
Oranges (N= 10) 3.0 2.0 Avocado (N=59) 17.4 9.5 2.5 Pawpaw (N=43) 12.9 5.5 1.0 2.0 Pineapple (N=7) 2.0 1.5 Ripe bananas(N=95) 28.4 12.4 5.5 0.5 Passion fruits (N=6) 1.0 1.5 0.5 Guavas (N=2) 0.5 0.5 Mangoes (N=16) 5.5 2.0 0.5 Water melon (N=3) 1.5 Lemon (N=4) 1.5 0.5 Tamarind (N=7) 1.5 1.0 0.5 0.5 Kales (N=97) 25.9 19.4 2.5 0.5 Cabbage (N=124) 31.8 20.9 6.5 0.5 Spinach (N=48) 12.4 6.0 5.0 0.5 Carrots (N=18) 4.5 2.0 2.5 Tomatoes (N=174) 26.9 35.8 19.4 3.0 0.5 0.5 0.5 Brinjals (N=2) 0.5 0.5
Cow peas leaves (N=14) 4.0 2.0 1.0 French peas (N=2) 0.5 0.5 Mrenda (N=1) 0.5 Pumpkins (N=10) 3.5 1.0 0.5 Pumpkin leaves (N=4) 0.5 0.5 1.0 Amaranth (N=5) 1.0 1.0 0.5 Onions (N=152) 22.9 33.8 14.4 2.5 1.0 1.0 Capsicum (N=3) 0.5 1.0 Managu (N=1) 0.5 Nderema (N=1) 0.5 Honey (N=10) 4.0 1.0 Sugarcane (N=16) 5.0 3.0
An assessment of weekly consumption of various foods by the children shows that most of the children fed on various protein foods up to three times a week. The
protein foods given to the children daily were eggs (0.5%), milk (34.3%), green grams (0.5%) and beans (8.5%) (Table 5).
Table 5: Frequency of the Weekly consumption of protein foods
Food item one Two Three four five Six Seven Proteins Beef (N=9) 2.0 2.0 0.5 Chicken (N=16) 6.5 1.5 Large fish (N=10) 3.0 1.0 0.5 0.5 Small fish (N=2) 0.5 0.5 Eggs (N=66) 18.9 9.5 3.0 0.5 0.5 0.5 Milk (N=143) 10.9 12.9 10.0 2.0 1.0 34.3 Beans (N=120) 17.4 17.4 13.4 2.5 0.5 8.5
Green grams (N=45) 12.4 6.0 3.5 0.5 Dry peas (N=6) 2.0 0.5 0.5 Groundnuts (N=2) 0.5 0.5 Lentils (N=2) 0.5 0.5 Liver (N=15) 5.5 1.5 0.5 Mutton (N=2) 0.5 0.5 Goat (N=30) 10.0 3.5 1.0 0.5 Most of the children consumed one or more types of
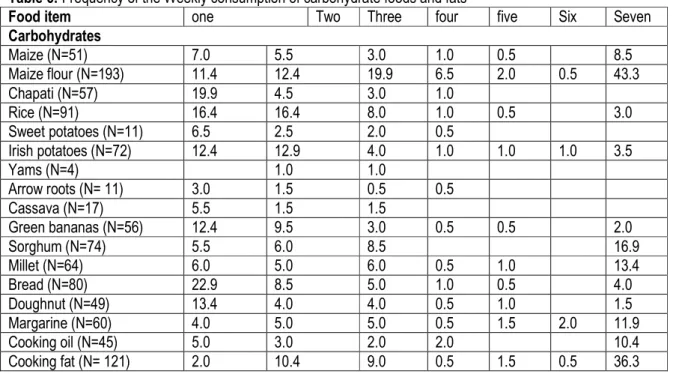
carbohydrate daily. Some of the carbohydrate foods that were consumed daily by a large percentage of children included; maize flour, which was consumed daily by 43.3% of the children, rice (3%), sorghum (16.9%), millet
(13.4%), maize (17.4%), bread (4%) and flour mixes (14.4%) of the children. Cooking fat was consumed seven days a week by 36.3% of children as presented in Table 6.
Table 6: Frequency of the Weekly consumption of carbohydrate foods and fats
Food item one Two Three four five Six Seven Carbohydrates Maize (N=51) 7.0 5.5 3.0 1.0 0.5 8.5 Maize flour (N=193) 11.4 12.4 19.9 6.5 2.0 0.5 43.3 Chapati (N=57) 19.9 4.5 3.0 1.0 Rice (N=91) 16.4 16.4 8.0 1.0 0.5 3.0 Sweet potatoes (N=11) 6.5 2.5 2.0 0.5 Irish potatoes (N=72) 12.4 12.9 4.0 1.0 1.0 1.0 3.5 Yams (N=4) 1.0 1.0 Arrow roots (N= 11) 3.0 1.5 0.5 0.5 Cassava (N=17) 5.5 1.5 1.5 Green bananas (N=56) 12.4 9.5 3.0 0.5 0.5 2.0 Sorghum (N=74) 5.5 6.0 8.5 16.9 Millet (N=64) 6.0 5.0 6.0 0.5 1.0 13.4 Bread (N=80) 22.9 8.5 5.0 1.0 0.5 4.0 Doughnut (N=49) 13.4 4.0 4.0 0.5 1.0 1.5 Margarine (N=60) 4.0 5.0 5.0 0.5 1.5 2.0 11.9 Cooking oil (N=45) 5.0 3.0 2.0 2.0 10.4 Cooking fat (N= 121) 2.0 10.4 9.0 0.5 1.5 0.5 36.3 Most of the children were not able to feed on the different
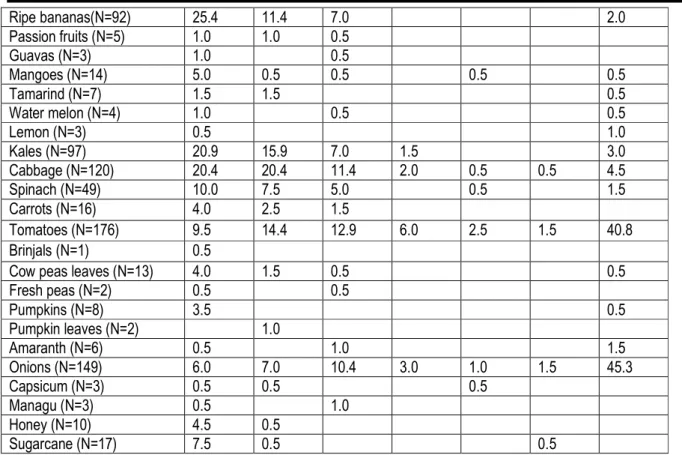
types of fruits. However, a small percentage of children ate a fruit or fruits every day of the week. Oranges (0.5%), avocado (1.5%), pawpaw (1.0%), ripe banana (2.0%), mangoes (0.5%), watermelon (0.5%), lemon (1.0%) and tamarind (0.5%) were the most common fruits
eaten daily owing to their availability. Majority of the children consumed vegetables up to three times a week. The vegetables fed to children on a daily basis included tomatoes (40.8%) and onions (45.3%). The weekly consumption pattern of fruits and vegetables is presented in Table 7.
Table 7: Frequency of the Weekly consumption of fruits and vegetables
Food item one Two Three four five Six Seven Fruits and vegetables
Oranges (N= 11) 2.5 2.5 0.5
Avocado (N=59) 17.4 6.5 3.5 0.5 1.5 Pawpaw (N=41) 7.5 5.0 1.0 4.5 1.0 0.5 1.5 Pineapple (N=7) 2.5 1.0
Ripe bananas(N=92) 25.4 11.4 7.0 2.0 Passion fruits (N=5) 1.0 1.0 0.5 Guavas (N=3) 1.0 0.5 Mangoes (N=14) 5.0 0.5 0.5 0.5 0.5 Tamarind (N=7) 1.5 1.5 0.5 Water melon (N=4) 1.0 0.5 0.5 Lemon (N=3) 0.5 1.0 Kales (N=97) 20.9 15.9 7.0 1.5 3.0 Cabbage (N=120) 20.4 20.4 11.4 2.0 0.5 0.5 4.5 Spinach (N=49) 10.0 7.5 5.0 0.5 1.5 Carrots (N=16) 4.0 2.5 1.5 Tomatoes (N=176) 9.5 14.4 12.9 6.0 2.5 1.5 40.8 Brinjals (N=1) 0.5
Cow peas leaves (N=13) 4.0 1.5 0.5 0.5 Fresh peas (N=2) 0.5 0.5 Pumpkins (N=8) 3.5 0.5 Pumpkin leaves (N=2) 1.0 Amaranth (N=6) 0.5 1.0 1.5 Onions (N=149) 6.0 7.0 10.4 3.0 1.0 1.5 45.3 Capsicum (N=3) 0.5 0.5 0.5 Managu (N=3) 0.5 1.0 Honey (N=10) 4.5 0.5 Sugarcane (N=17) 7.5 0.5 0.5 Nutritional status of children: Overall, in Kitui County
the levels of acute malnutrition for wasting were relatively
high (3.98%), the levels of acute stunting were 28.36% and those of underweight were at 11.44%.
Table 8: Classification of Nutritional status of children Indicators Severe (<-3 z-score) n % Moderate (>= -3 and <-2 z-score) n % Normal (> = -2 z-score) n % Wasting (N=201) 3 1.5 5 2.5 193 96.0 Stunting (N=201) 13 6.5 44 21.9 144 71.6 Underweight (N=201) 5 2.5 18 9.0 178 88.6 *WHO cut off points for wasting using Z scores (<-2 Z
scores in populations: <5% acceptable; 5-9% poor; 10-14% serious; >15% critical). When the prevalence of malnutrition was analysed as per age category, more
children were found to be malnourished in ages 13-23 than in ages 6-12. The prevalence of malnutrition as per age category is shown in (Table 10).
Table 9: Prevalence of malnutrition as per age category
Age categories Total 6-8 9-12 13-18 19-23 Wasting Severe 0 1 1 1 3 Moderate 1 1 2 1 5 Normal 48 47 52 46 193 Total 49 49 55 48 201 Stunting Severe 2 1 4 4 13
Moderate 4 4 15 18 14 Normal 41 44 30 20 144 Total 49 49 55 48 201 Underweight Severe 1 21 2 1 5 Moderate 4 5 6 2 18 Normal 44 43 47 45 178 Total 49 49 55 48 201 Relationship between complementary feeding
practices and nutrition status: The study noted that the education level and income correlated significantly (P<0.05) with the dietary practices adopted among the
children. The DDS, number of meals taken per day and frequency of food consumption, correlated significantly (P<0.05) with nutritional status of the children.
CONCLUSION
Almost all the children were introduced to complementary foods after six months. As reported by the caregivers, the most common foods consumed by the children were maize porridge, milk, rice and beans. The children consumed more of the cereals as compared to proteins, due to affordability. The children’s diets were low in fruits and vegetables. The dietary diversity score of 2.4 shows lack of a diversified diet. The nutritional status indicators in Kitui County show that the levels of acute malnutrition are relatively high for this age group this could be attributed to food insecurity indicated by low diversity leading to low intake of both macro and micro nutrients by most children. Overall, nutritional status was poor according to the findings on anthropometric measurements due to long periods of drought. It is also an indicator of the negative influence of the inappropriate
infant and young child feeding practices on nutritional status. The low food production in the semi-arid area coupled with low income could be associated with the food insecurity and consequently to the quality, quantity and diversity of the foods consumed by the children. The complementary feeding practices were poor as indicated poor nutrition status. This study recommends the enhancement of the nutritional content of complementary foods through targeted agricultural interventions with the assistance of the ministry of agriculture officers. Nutrition education and counselling for mothers on appropriate Infant and Young Child Feeding by the nutritionists and other health care providers is key towards improving the feeding practices through use of the available food resources.
ACKNOWLEDGEMENTS
This study acknowledges the contribution of the following; Global alliance for improved nutrition for research funding and Kenyatta University for support in equipments
REFERENCES
Arimond M., Daelmans, B. and Dewey, K.G. (2008). Indicators for Feeding Practices in Children. Lancet, 371:541-542.
Butte N, Cobb K., Dwyer, J., Graney, L., Heird, W. and Rickard, (2004). The Start Healthy Feeding Guideline for Infants and Toddlers. Journal of American Dietetics Association, 104(3): 442-454 Ceatan M.C., Dasilva, S.G., DE Souza, F.I. and Sarni, R.O. (2010). Complementary Feeding: Inappropriate Practices in Infants. Journal of Pediatrics (Rio Jenerio), 86:196- 201. Chelimo F. L. (2008). Assessment of Complementary
Feeding Practices and Nutritional Status among Children in Athi-River, Machakos district Kenya.
Dewey K. G. (2005). Approaches for Improving Complementary Feeding of Infants and Young Children. Geneva: World Health Organisation, in Press
FANTA and FAO (2007). Guideline for Measuring Household and Individual Dietary Diversity (Version 3). Rome Italy.
KDHS. (2008-2009) Kenya Demographic and Health Survey. National Council for Population and Development, Central Bureau of Statistics and Ministry of Planning and National Development, Nairobi. Kenya
Kenya National Bureau of Statistics (KNBS), ICF Macro. (2010). Kenya Demographic and Health Survey
2008-09. KNBS and ICF Macro, Calverton, Maryland.
Nyangweso P .M. Odhiambo M. O. Ondunga P., Korir, M.K, Kipsat, M. J and Seren A. K, (2007). Household Food Security in Kitui District. Determinants of Dietary Diversity, Africa Crop Science Conference Proceeding Egypt. Vol. 8 pp 1383-1389.
Ramji, S. (2009). Impact of Infant and Young Child Feeding and Caring Practices on 23 months of
age in nutrition and child health programmes: Report of proceedings, Geneva
WHO (2010). Indicators of Accessing Infant and Young Child Feeding Practices. Part 2 measurement. Geneva; WHO.
WHO. (2008). Strengthening action to improve feeding of infants and young children 6-23 months of age in nutrition and child health programmes. Report of proceedings, Geneva.