AVIS
Ce document a été numérisé par la Division de la gestion des documents et des archives de l’Université de Montréal.
L’auteur a autorisé l’Université de Montréal à reproduire et diffuser, en totalité ou en partie, par quelque moyen que ce soit et sur quelque support que ce soit, et exclusivement à des fins non lucratives d’enseignement et de recherche, des copies de ce mémoire ou de cette thèse.
L’auteur et les coauteurs le cas échéant conservent la propriété du droit d’auteur et des droits moraux qui protègent ce document. Ni la thèse ou le mémoire, ni des extraits substantiels de ce document, ne doivent être imprimés ou autrement reproduits sans l’autorisation de l’auteur.
Afin de se conformer à la Loi canadienne sur la protection des renseignements personnels, quelques formulaires secondaires, coordonnées ou signatures intégrées au texte ont pu être enlevés de ce document. Bien que cela ait pu affecter la pagination, il n’y a aucun contenu manquant.
NOTICE
This document was digitized by the Records Management & Archives Division of Université de Montréal.
The author of this thesis or dissertation has granted a nonexclusive license allowing Université de Montréal to reproduce and publish the document, in part or in whole, and in any format, solely for noncommercial educational and research purposes.
The author and co-authors if applicable retain copyright ownership and moral rights in this document. Neither the whole thesis or dissertation, nor substantial extracts from it, may be printed or otherwise reproduced without the author’s permission.
In compliance with the Canadian Privacy Act some supporting forms, contact information or signatures may have been removed from the document. While this may affect the document page count, it does not represent any loss of content from the document.
Study ofNAD(P)H fluorescence in living cardiomyocytes by
spectrally resolved time-correlated single photon counting
par Cheng Ying
Programme de Sciences Biomédicales Faculté de Médecine
Thèse présentée à la Faculté des études supérieures en vue de l'obtention du grade de Maître ès Sciences (M.Sc.)
en Sciences Biomédicales
Décembre 2007
© Cheng Ying, 2007
Cette thèse intitulée:
Study of NAD(P)H fluorescence in living cardiomyocytes by
spectrally resolved time-correlated single photon counting
présentée par : Cheng Ying
a été évaluée par un jury composé des personnes suivantes:
Jèan-Yves Lapointe, président-rapporteur A1zbeta Chorvatova, directeur de recherche
RÉSUMÉ
Dans les cellules cardiaques, la fonction première des mitochondries est la production d'énergie, processus crucial pour la contraction et le bon fonctionnement du cœur. Dans des conditions physiopathologiques telles que l'ischémie et/ou le rejet des cœurs transplantés, l'analyse de l'état métabolique mitochondrial chez les patients ainsi que dans les modèles animaux permettrait donc de déceler les signes précoces de dysfonctions mitochondriales par conséquent de dysfonction cardiaque. Dans cette étude, nous examinons dans les myocytes cardiaques, la fluorescence endogène ou auto fluorescence (AF) du nicotinamide adénine dinuc1éotide (phosphate), ou NAD(P)H, le principal donneur
~
d'électrons dans la respiration mitochondriale, responsable de la production d'ATP. Le NAD(P)H est étudié comme un marqueur non invasif pour sonder la fonction mitochondriale et ainsi leur état métabolique. Notre objectif est d'étudier l'état du métabolisme oxydatif des mitochondries dans les myocytes cardiaques isolés de rats adultes ou de patients pédiatriques ayant subi une transplantation cardiaque. Pour réaliser cette étude, nous utiliserons une nouvelle méthode de spectroscopie avec résolution temporelle, afin d'établir les spectres d'émission et les caractéristiques dynamiques du temps de vie des molécules NAD(P)H. La fluorescence de NAD(P)H a été enregistrée dans les myocytes suite à l'excitation par un laser UV pulsatile et les spectres ainsi que les durées de vie de fluorescence ont été enregistrés de manière simultanée. Nous avons évalué l'AF en fonction de la modulation de la production de NADH et/ou de la respiration mitochondriale. Nous avons comparé les conditions physiopathologiques, telles que l'ischémie et/ou les stades différents de rejet des cœurs transplantés dans le but de trouver de nouveaux outils permettant d'établir le diagnostic précoce de ces conditions et ainsi d'améliorer le pronostic de ces patients.
Nos résultats montrent qu'un modèle de décomposition triexponentielle de durée de vie de fluorescence, notamment 0.4-0.7ns, 1.2-1.9ns et 8.0-13.Ons, a été nécessaire pour décrire la fluorescence de NAD(P)H dans les myocytes cardiaques dans la gamme spectrale
de 42û-56ûnm. L'augmentation de la production mitochondriale de NADH par des corps cétoniques a renforcée l'intensité de l'AF, sans pour autant induire un changement significatif de sa durée de vie. La roténone, l'inhibiteur du Complexe 1 de la chaîne respiratoire mitochondriale, a augmenté l'intensité de l'AF, tout en raccourcissant sa durée de vie moyenne. Le dinitrophénol (DNP), un agent découplant la phosphorylation oxydative des mitochondries a provoqué une diminution de l'intensité de l'AF et une augmentation de sa durée de vie moyenne. Ces effets, comparables à ceux induits par l'augmentation de la concentration de NADH et/ou de ses taux de déshydrogénation in
vitro, ont été également examinés dans des conditions qui imitent l'ischémie.
Cette étude est aussi la première à montrer les caractéristiques dynamiques de la fluorescence de NAD(P)H dans les cellules cardiaques humaines isoJées d'une biopsie endomyocardique des patients pédiatriques qui ont subi une transplantation cardiaque. La fluorescence endogène de NAD(P)H a été retrouvée significativement plus faible dans les cœurs humains par rapport à ceux des rats isolés dans les mêmes conditions. La roténone a augmenté l'intensité de fluorescence dans les cellules cardiaques humaines, les rendant ainsi comparables aux modèles expérimentaux chez le rat. Nous avons aussi observé une corrélation entre les changements de l'intensité de la fluorescence avec le stade de rejet des
)
cœurs transplantés. En effet, l'intensité de fluorescence a augmentée de manière significative en cas de rejet léger (RI), par comparaison au stade sans rejet (Rû). Ces résultats suggèrent que les cellules cardiaques humaines sont métaboliquement plus actives que celles des rats dans les mêmes conditions, alors que cette activité (par conséquent la production de l'ATP) semble baisser au cours de processus de rejet.
La méthode spectrométrique avec la résolution temporelle représente un outil prometteur pour analyser le NAD(P)H mitochondrial des cardiomyocytes. Cette approche permettra d'améliorer les connaissances sur le métabolisme oxydatif et/ou son dysfonctionnement au niveau cellulaire. Il pourrait éventuellement constituer un nouvel outil diagnostique pour évaluer les changements métaboliques associés au rejet des cœurs transplantés. Dans le futur, cette approche pourrait se révéler utile pour la détection précoce
des cas bénins ou de rejet, notamment dans le cadre de résultats histologiques douteux, et donc dans la prise de décision pour débuter le traitement adéquat. Ainsi, ce travail pourrait donc avoir un impact direct sur la prise en charge des enfants avec des cœurs transplantés et qui risquent le rejet.
Mots-clés: NAD(P)H, auto fluorescence (AF), spectroscopie avec résolution temporelle, mitochondrie, myocytes cardiaques, rejet des cœurs transplantés
ABSTRACT
The primary function of cardiac mitochondria is the production of ATP to support rhythmic contraction of the heart. Examination of the mitochondrial redox state in patients and experimental animaIs is therefore crucially important to sensitively detect early signs of mitochondrial function in pathophysiological conditions, such as ischemia and/or the allograft rejection of heart transplantations, a major cause of death of transplanted patients. ln this study, we monitor cellular fluorescence of nicotinamide adenine dinuc1eotide (phosphate), or NAD(P)H, the principal electron donor in mitochondrial respiration responsible for vital ATP supply of cardiomyocytes. Here, NAD(P)H is studied as a marker for non-invasive fluorescent probing of the mitochondrial function. Our objects are to study fmgerprinting of mitochondrial metabolic oxidative state in living cardiomyocytes by spectrally-resolved time-correlated single photon counting (TCSPC) to report dynamic characteristics of NAD(P)H fluorescence decay in living rat cardiomyocytes, as well as in human cardiac cells from pediatric patients with transplanted hearts. NAD(P)H fluorescence is recorded in living cardiomyocytes following excitation by UV -pulsed laser diode and detection by spectrally-resolved TCSPC, based on the simultaneous measurement of the fluorescence spectra and fluorescence lifetimes. Modulation ofNADH production and/or mitochondrial respiration is tested and pathophysiological conditions are compared to search for new diagnostic tools for early detection ofrejection oftransplanted hearts and therefore to improve the prognosis in this population ofpatients.
Our results show that at least a 3-exponential decay model, with 0.4-0.7ns, 1.2-1.9ns and 8.0-13.Ons lifetime pools is necessaryto describe cardiomyocyte autofluorescence (AF) within 420-56Onm spectral range. Increased mitochondrial NADH production by ketone bodies enhanced the fluorescence intensity, without significant change in fluorescent lifetimes. Rotenone, the inhibitor of Complex 1 of the mitochondrial respiratory chain, increased AF intensity and shortened the average fluorescence lifetime. Dinitrophenol (DNP), an uncoupling agent of the mitochondrial oxidative phosphorylation, lowered AF
intensity, broadened the spectral shoulder at 520 nm and increased the average fluorescence lifetime. These effects, comparable to the changes in the concentration and in the rate of dehydrogenation of NADHin vitro, were also examined under ischemia-mimetic conditions.
Furthermore, we report for the fust time dynamic characteristics of NAD(P)H fluorescence decays in living human cardiac cells, isolated from one endomyocardial biopsies (EMB) of pediatric heart transplanted patients with different rejection grades. NAD(P)H fluorescence in human hearts was found significantly lower in comparison to rat . ones in same conditions. Rotenone increased the fluorescence intensity in human cardiac cells, making them more comparable to experimental rat model. We observed a correlation between changes in steady-state NAD(P)H fluorescence spectra and rejection grades, namely significantly increased fluorescence intensity in mild rejection (RI) vs. no rejection (RO). These results suggest that human cardiac cells are more metabolically active than the rat ones in the same conditions, while this activity (and thus ATP production) seems lowered during rejection pro cess.
Spectrally-resolved fluorescence Iifetime technique provides promising new tool for analysis of mitochondrial NAD(P)H fluorescence in living cardiomyocytes. This approach will enhance our knowledge about cardiomyocyte oxidative metabolism and
lor
its dysfunction at a cellular Ievel. It Can eventually become a new diagnostic tool for evaluation of oxidative metabolism changes in transplanted hearts. In the future; this approach can prove helpful in the detection of early or mild cases of rejection, particularly in the case of doubtful histological results and hence in the decision-making for rapid initiation of the necessary treatment. It may therefore have a direct impact on the care of children with transplanted hearts that are at risk of rejection.Keywords:
NAD(P)H, auto fluorescence (AF), spectrally-resolved fluorescence lifetimes, mitochondria, living cardiomyocyte, rejection ofheart transplantation.TABLE OF CONTENTS
, ,RESUME ... iii
ABSTRACT ... ···vi
LIST OF TABLES··· ... " ... ··· .. ·xi
LIST OF FIGURES··· ... ···xii
LIST OF ABBREVIATIONS AND SYMBOLS···xv
ACKNOWLEDGEMENTS ... ···xix
1. INTRODUCTION ... ~ ... ···1
1.1. Oxidative metabolism in cardiomyocyte mitochondria ··· ... · .. ··· .. · .. 1
1.1.1. ATP generation for heart functional activities .. ·· .. ··· .... ··· .. ··· .. ··l 1.1.2. Substrates for cardiomyocyte metabolism ... 3
1.1.3. Structure and function ofNAD(P)H molecule .... · .. ··· .. ··· .. · ... · .. ·· .. ·· .. ····7
1.1.4. Mitochondrial respiratory chain· .. ··· ... · ... · .. · .. · .. · .. ·· ... · .. ···9
1.1.5. Oxidative phosphorylation and ATP synthesis .. ··· .. ·· .. ··· .. ··· 14
1.1.6. Control ofmitochondrial respiration and ATP synthesis ... · ... ·16
1.1.7. Change in respiration and oxidative metabolism in pathophysiological conditions··· ... ·18
1.2. NAD(P)H fluorescence in cardiomyocytes ... ···21
1.2.1. Physics of fluorescence ... · .... · .. · .... ·21
1.2.2. Endogenous fluorescence ofliving cells · ... ··· .. · ... · .. ·· ... · .... · ... 23
1.2.3. Spectral characteristics ofNAD(P)H fluorescence .. ·· .. ··· .... · ... · .. · .. · .... ·· ... 25
1.2.4. NAD(P)H fluorescence lifetime pools in mitochondria .. ·· .. · ... ·· .... · ... 27
1.2.5. Latest experimental approaches for monitoring cellular auto fluorescence ... 29
2. MATERIAL AND METHODS···32
2.1. Material ... ~ ... 32
2.1.1. Isolation ofleft ventricular myocytes from rat hearts ···32
2.1.2. Isolation of cardiomyocytes from endomyocardial biopsies of pediatric heart transplanted patients··· ... 34
2.1.3. Solutions ... ···35
2.1.4. Reagents··· ... ···36
2.2. Methods ... ···37
2.2.1. Confocal microscopy···37
2.2.2. Spectrally-resolved time-correlated single photon counting ···37
2.2.3. Recording ofspectrally-resolved autofhlOrescencedata in living cardiac cells'40 2.2.4. Definitions ofterms and derived quantities···46
2.2.5. Data analysis ... ···48
3. RESUL TS ... ···49
3.1. Recording of NADH flurescence in vitro ... ···49
3.1.1. Kinetics offree NADH fluorescence decay ···49
3.1.2. Concentration-dependence ofNADH fluorescence decay kinetics ···49
3.1.3. pH-dependence ofNADH fluorescence decay kinetics ···50
3.1.4. Binding ofNADH to lipoamide dehydrogenase···50
3.2. Study of NAD(P)H fluorescence in living cardiomyocytes ···60
3.2.1. Distribution ofNAD(P)H fluorescence···60
3.2.2. Spectral and lifetime characteristics ofNAD(P)H fluorescence ···:···60
3.2.3. 'Inhibition of the mitochondrial respiratory chain ···61
3.2.4. Stimulation ofNADH dehydrogenation by uncoupling of ATP synthe sis ···63
3.2.5. Modulation ofNADH production in living cardiomyocytes···64
3.2.6. NAD(P)H fluorescence in cardiomyocytes under ischemia-mimicking conditions···,··· 74
3.3. Investigation of NAD(P)H fluorescence in 6ving cells from human
endomyocardial biopsies ...••••••••••••••••.•...•••••••••••••••••• ···79
3.3.1. Isolation ofliving cardiac cells from endomyocardial biopsies ··· .. ··· .. ···79
3.3.2. NAD(P)H fluorescence in human cells: comparison to rat .... · ... · ... · .. 80
3.3.3. Study ofNAD(P)H fluorescence in heart transplanted patients with different rejection grades··· .... ···· .. ·· .. ·· .. ·· .. ·· ... ··· .. ···· ... ··· .. ·· ... · .. ·· .. ·· ... ·· .. ··· ... 81
3.4. Perspectives ••••••...•••••.•..•...••••••••••••••••••••••••••••••••...••••.••••••••••..••••.•••••• ···87
3.4.1. Decay associated spectra ofNAD(P)H fluorescence ... · .... · .. ··· ... · ... ··87
3.4.2. Analysis oftime-resolved emission spectra ofNAD(P)H fluorescence ... 88
4. DISCUSSION,··· ... ···91
4.1. Fingerprinting of metabo6c oxidative state in 6ving cardiomyocytes .. • ... • .. ···92
4.2. Changes of metabo6c oxidative state in 6ving cardiomyocytes under pathophysiological conditions···100
5. CONCLUSIONS AND PERSPECTIVES ..••••...••••••••.••••.•..•... ···104
6. BIBLIOGRAPHY ...•...•...••••••... ···1 05 APPENDIX 1: ...•.•••••••••••••••••...•...•••..•.•.••••••••••••••••... ···1
LIST OF TABLES
Table 1: Inhibitors of oxidative phosphorylation ... 13 Table 2: Theoretical yields of ATP from fully oxidized glucose molecule ... ·· .. ·· ... 15 Table 3: Fluorescence parameters ofNADH in the absence and in the presence ofLipDH
in intracellular solutions (ÀexlÀem = 375 nm/450 nm) .. · .. · ... ·58
Table 4: Fluorescence parameters ofrat cardiomyocytes AF (ÀexlÀem
=
375 nm/450 nm)... ···72
Table 5: Fluorescence parameters of cardiomyocytes AF in ischemia-mimetic solutions
(Àemem = 375 nm/450 nm) ·· .. ·· .. ·· .... ··· ... ·· ... · ... · .. · .... ·78
Table 6: Fluorescence parameters ofhuman cardiomyocytes AF (Àemem
=
375 nm/450LIST OF FIGURES
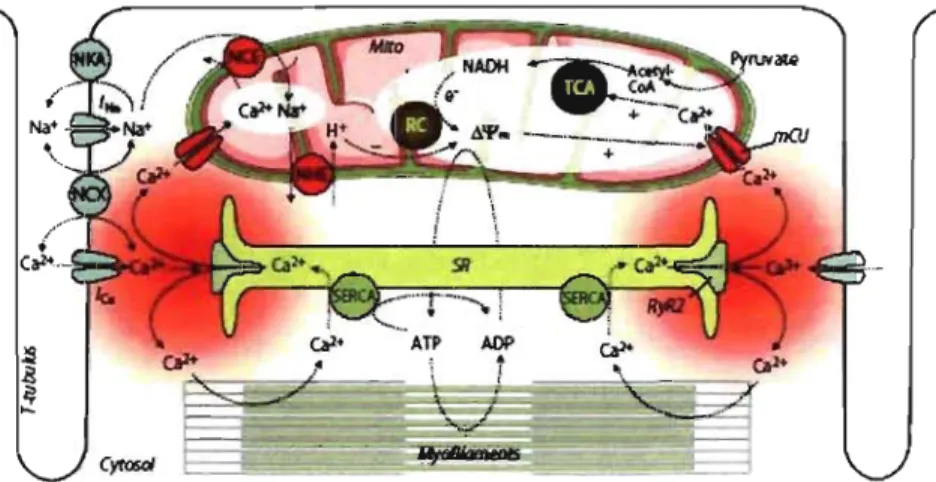
Figure 1: Processes of excitation-contraction coupling and mitochondrial energetics ···2
Figure 2: Pathways and regulatorypoints ofmyocardial substrate metabolism··· .. ·5
Figure 3: Structure of NAD (Pt and NAD(P)H molecules ··· .. ·8
Figure 4: Complex 1 of the mitochondrial respiratory chain ··· .. · .. ·10
Figure 5: Mitochondrial respiratory chain and its inhibition points···12
Figure 6: General scheme of the fluorescence process··· .. ···22
Figure 7: Transmission images of living cardiomyocytes ···33
Figure 8: Principle of classic TCSPC measurement .. ··· .. ··· ... 38
Figure 9: The spectrally-resolved TCSPC instrumentation ... · .... ··· .. ·· ... · .. · ... · .... 39
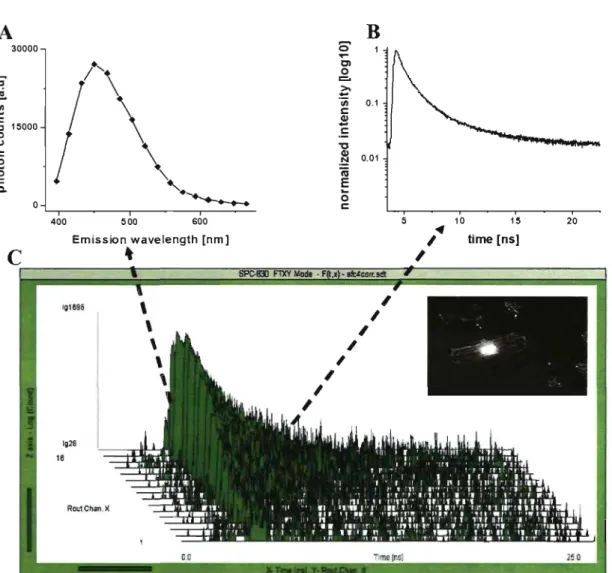
Figure 10: Original recording ofspectrally and time-resolved fluorescence decay· .... ··· .... 42
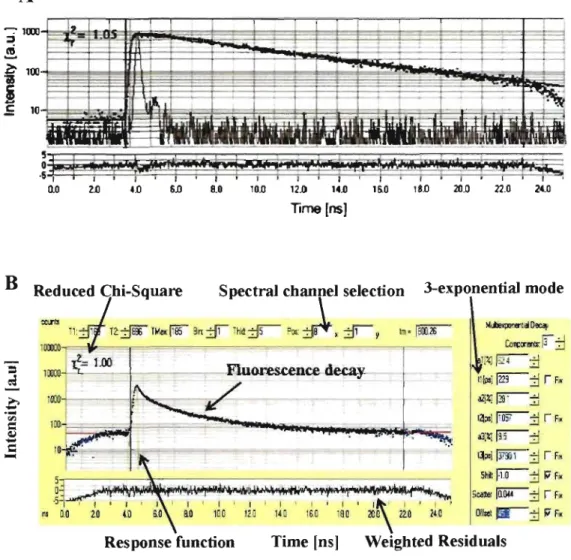
Figure 11: Original recording of AF decay· .. · .... · .. · ... · .. ·· .... ··· ... · ... · ... · .. ·· .. · .. ···44
Figure 12: Analysis of fluorescence decay ... · ... ·· .. ·· .. · .. · ... · ... ···45
Figure 13: NADH fluorescence spectra and lifetimes in vitro .. · ... ·· .. ·· .. · .. ··· ... · .. 52
Figure 14: Concentration-dependence ofNADH fluorescence lifetimes and their relative amplitudes in vitro··· ..
···53
Figure 15: pH-dependence ofNADH fluorescence decay kinetics in vitro ... 54
Figure 16: Spectral and fluorescence lifetime characteristics ofNADH after binding to LipDH in vitro· ... 55
Figure 17: Fluorescence lifetimes and their relative amplitudes after binding ofNADH to LipDH in vitro ... 56
Figure 18: pH-dependence ofNADH fluorescence decay kinetics after binding to LipDH
in vitro··· ... ···57
Figure 19: Confocal image ofNAD(P)H fluorescence in one cardiac cell ... · ... ·66
Figure 20: NAD(P)H fluorescence spectral characteristics in living cardiomyocytes ... 67
Figure 21: Steady-state NAD(P)H fluorescence in living cardiomyocytes following
application of the modulators ofrespiratory chain .. ··· .... ·· .. ·· ... · .... ··· ... 68
Figure 22: NAD(P)H fluorescence lifetimes and their relative amplitudes following
application ofRotenone and DNP ... ···69
Figure 23: Steady-state NADH fluorescence spectra in living cardiomyocytes following
application ofmetabolic substrates ... · .. ··· .... · .. ··· ... ·· ... · ... · .... · .. ··~· .. 70
Figure 24: NAD(P)H fluorescence lifetimes and their relative amplitudes following
application ofBHB/AcAc (2:1) and BHB/AcAc (20:1) .. · ... · ... · .. · .... 71
Figure 25: Steady-state NAD(P)H fluorescence spectra of cardiomyocytes under
ischemia-mimicking condition··· 76
Figure 26: NAD(P)H fluorescence lifetimes and their relative amplitudes in
ischemia-mimicking conditions··· ... 77
Figure 27: Steady-state NAD(P)H fluorescence ofhuman cardiomyocytes isolated from
EMB ofpediatric heart transplanted patients"""'''''''''''''''''''''''''''''''''''''''''''''''''' 83
Figure 29: Steady-state NAD(P)H fluorescence ofhuman cardiomyocytes with different grade ofrejection (ISHLT) ... ···85
Figure 30: Decay-associated spectra (DAS) ofNAD(P)H fluorescence in cardiomyocytes
... ···89
Figure 31: Time-resolved emission spectroscopy (TRES) ofNAD(P)H fluorescence in
LIST OF ABBREVIATIONS AND SYMBOLS
AcAc: Acetyl-CoA: a··••
ATP(ADP): AF: AP: BDM BHB: BSA:x
2 : CCCP: CICR: DCI: DNP: DPA: DAS: E: ECC: ETC: ETF: EMB: FAD: FCCP: FMN: FRET: FWHM: Acetoacetate Acetyl-coenzyme A Relative amplitudeAdenosine triphosphate (diphosphate) Auto fluorescence
Action potential
2,3-butanedione monoxime ~-hydroxybutyrate
Bovine serum albumin Chi-square values
Carbonyl cyanide m-chlorophenyl hydrazone Ca2+-induced Ca2+-release
1,1' -diethyl-2,2' -carbocyanine iodide Dinitropheno l
9, 1 O-diphenylanthracene Decay-associated spectra Energy
Excitation-contraction coupling Electron transport chain
Electron transport flavoprotein Endomyocardial biopsy Flavin adenine dinuc1eotides
Carbonylcyanide-p-trifluoromethoxy phenylhydrazone Flavin mononuc1eotide
Forster resonant energy transfer Full width in half-maximum
GCAD: GTP:
h:
ICa,L: IRF: ISHLT: Î.em: Î.ex LipDH: Ap.H: A'II: NAD(P)H: [NADH] os:v:
PCA: PDH: Pcr:P,·
,"
PML: ps: RO: R1: ROS: ApH: RyR2:So:
Graft coronary artery disease Guanosine trisphosphate Planck's constant
Na + -CUITent
L-type Ca2+ -current
Instrument response function
International Society for Heart and Lung Transplantation Emission wavelength
Excitation wavelength Lipoamide dehydrogenase Proton motive force
Mitochondrial membrane potential
Nicotinamide adenine dinuc1eotide (phosphate) NADH concentration
Nano-second Frequency oflight
Principal component analysis Pyruvate dehydrogenase Phosphocreatine
Inorganic phosphate Photomultiplier Pico-second
Rejection grade 0: no rejection Rejection grade 1: mild rejection Reactive oxygen species
Proton gradient
Ryanodine receptor type 2 Ground state of a fluorophore
SD: SEM: SERCA: SR: TAC: TCA: TCSPC: TRES: 2D/3D: UV:
Excited state of a fluorophore Standard deviation Standard error SR Ca2+ ATPase Sarcoplasmic reticulum Fluorescence lifetime Time-to-amplitude converter Tricarboxylic acid cycle
Time-correlated single photon counting Time-resolved emission spectra
Two/three dimension Ultraviolet
Confucius said: "Isn't it a pleasure to study and
practice what you have learned?"
ACKNOWLEDGEMENTS
First 1 would like to thank my supervisor, Dr. A1zbeta Chorvatova, for taking me into her research team and opened new horizons to me, while giving me an opportunity to study in a new field of scientific research. These 2 years of my M.Sc program have been a steep learning curve for me. 1 am grateful for the exceptional guidance and unconditional devotion that she has given me.
Special thanks in particular to Dr. D. Chorvat Jr. and his colleagues, from International Laser Centre, Bratislava, Slovak Republic, for helping compute our experimental data for DAS and TRES. Thanks Dr. N. Dahdah, DT, N. Poirier and Dr. J. Miro, for their kindly providing endomyocardial biopsies, and S. Michaud for kindly providing information about histological grade of cardiac allograft rejection, thank Dr. B. Comte for fruitful discussion. Thanks also to A. Mateasik for custom-written procedures for data correction and Q. WU for creation of database for data management. Acknowledgement extends to V. Bassien Capsa, F. Elzwiei, S. Aneba and aIl other colleagues in Dr. Chorvatova's laboratory for their friendship, assistance, and for making work in the laboratory so enjoyable.
ln my courses of M.Sc program, 1 aIso received friendly help from my teachers, Dr. J.
Noel, Dr. L. Parent, Dr. A. Calderone, Dr. J.M. Therrien, and Dr. J. Lambert. 1 have learned a lot of knowledge from them. Finally, the love, support, and patience of my wife, my daughter and the family are apprecüited more than words can say.
Based on aIl the help 1 have received, not only academically but also for my time here in Montreal. Therefore, 1 apologize if 1 have missed anyone out, it was done without intentions.
1.
INTRODUCTION
1.2. Oxidative metabolism in cardiomyocyte mitochondria
1.2.1. ATP generation for heart functional activities
Life critically depends on the heart functional activities. The most important function of the heart is to pump blood to supply the body with oxygen and substrates. The heart increases its output to adapt to constantly changing demand of blood and energy through three major mechanisms: (1) the force-frequency relationship \ (2) the Frank-Starling mechanism 2, (3) and the sympathetic activation 3. In order to support myocardial
contractile activity to adapt the varying workload, the heart requires a continuo us supply of energy, which tight coupling mechanisms are essential to maintain cellular pools of adenosine triphosphate (ATP), phosphocreatine (PCr) and' nicotinamide adenine dinuc1eotide (NADH). An energy-releasing process is the hydrolysis of ATP to adenosine diphosphate (ADP), when the ATP converts to ADP, it is usually immediately recycled in the mitochondria where it is recharged and cornes out again as ATP. Almost aIl (>95%) of ATP is produced in mitochondria, which take up ~30% of cellular volume and are located in close vicinity to the main sites of energy consumption, i.e., the myofilaments, the sarcoplasmic reticulum (SR) and t-tubules 4-7. Approximately 60-70% of ATP generation contribute to myocardial contractile, and remaining 30-40% is primarily used for the SR Ca2+-ATPase (SERCA) and other ion pumps 8,9.
Cardiac contraction and relaxation are based on the process of excitation-contraction (EC) coupling 6, 10 which consumes vast amounts of energy (Fig. 1). Briefly, when a cardiomyocyte is depolarized during an action potential (AP), voltage-gated Na+-channels are activated and the inward Na+-current (INa) induces a rapid depolarization of the cell membrane, facilitating voltage-dependent opening ofL-type Ca2+-channels (Ica,L). The Ca2+ influx triggers the opening ofthe ryanodine receptor (RyR2 subtype), inducing the release
Figure 1: Processes of excitation-contraction coupling and mitochondrial energetics.
SR, sarcoplasmic reticulum; SERCA, SR Ca2+ AIPase; Mito, mitochondria; ICA,
tricarboxylic acid cycle; RC, respiratory chain; Ô \If m, mitochondrial membrane potential;
NCE, mitochondrial Na+/Ca2+-exchanger; NHE, mitochondrial Na+IH+-exchanger; NKA,
sarcolemmal Na+IK+-ATPase; NCX, sarcolemmal Na+/Ca2+-exchanger; RyR2, ryanodine
receptor type 2; mCU, mitochondrial Ca2+ -uniporter; INa and ICa, currents of voltage-gated
of even greater amounts of Ca2+ from the SR, a process termed Ca2+ -induced Ca2+ -release (CICR). The increasing cytosolic Ca2+ binds to the myofilaments such as troponin C, and induces the contraction of the cardiomyocyte. Binding of Ca2+ to the troponin C induces a conformational change of troponin C with exposes the binding site of the actin filaments for myosin head, that are able to bind to the myosin ATPase located on the myosin head. This binding results in ATP hydrolysisthat supplies energy for a conformational change to occur in the actin-mY0sin cross bridge formation. The result of these changes is a movement ("ratcheting") between the myosin heads and the actin filaments, such that the actin and myosin filaments slide past each other thereby shortening the sarcomere length. Relaxation is initiated by the diffusion of Ca2+ from the myofilaments back to the cytosol, then Ca2+ actively being removed from cytosol. The main mechanisms removing Ca2+ from the cytosol are the SR Ca2+-ATPase, the sarc0 lemmal Na+/Ca2+-exchanger and the plasmalemmal Ca2+-ATPase (Fig. 1). The myosin ATPase of the contractile filaments, the SR Ca2+-ATPase, and the plasmalemmal Na+/K+-ATPase are the main cellular energy consumers in the process of EC coupling 5. The processes of excitation-contraction
coupling and mitochondrial bioenergetics are highly interrelated, defects in EC coupling may directly translate into defects in mitochondrial bioenergetics in pathological situations, and may trigger altered supply ofthe respiratory chain with NADH.
1.1.2. Substrates for cardiomyocyte metabolism
In cardiomyocytes, to convert the potential energy in various metabolic substrates into ATP is the main function of mitochondria. These organelles are able to use a wide variety of circulating substrates, inc1uding fatty acids, glucose, lactate and ketone bodies. Under normal physiological conditions, fatty acids and glucose are main sources for intracellular ATP production, lactate and ketone bodies are used to a lesser extent Il, 12. The heart
utilizes these highly reduced metabolic substrates to produce energy from electrons by dehydrogenation reactions. However, electrons from the fuel molecules are not directly transported to the final electron acceptor oxygen; instead substrates are oxidized into reduced forms of NADH and flavin adenine dinucleotides (F ADH2) as electron carriers.
Bach of these molecules contains two electrons, and will release energy upon oxidation. Metabolic substrat es convey reducing equivalents (NADH and F ADH2) to the mitochondrial respiratory chain via three interconnected pathways, (1) the fatty acid ~ oxidation pathway, (2) the citric acid cycle (Krebs' cycle), which is also known as tricarboxylic acid cycle (TCA cycle), (3) and to a lesser extent from the pyruvate dehydrogenase reaction and glycolysis (Fig. 2) Il. Vnder physiological conditions, glucose
is transformed to pyruvate, which enters mitochondria and is converted to acetyl-coenzyme A (CoA) by pyruvate dehydrogenase (POH). Fatty acids are activated to fatty acyl-CoA in the cytosol and transported into mitochondria via the carnitine-acyltranslocase. Acetyl-CoA from both decarboxylation of pyruvate and fatty acid ~-oxidation enters the citric acid cycle, resulting in the formation ofNADH and FADH2. In the well-perfused heart, 060-90% of the acetyl-CoA cornes from ~-oxidation of fatty acids, white 10-40% cornes from the oxidation of pyruvate tOOt is derived in approximately equal amounts glycolysis and lactate oxidation Il, 13, 14. Acetyl-CoA metabolized through the citric acid cycle yields 3
NADH, 1 FADH2, and 1 guanosine triphosphate (GTP) 15. The reducing equivalents (NADH and F ADH2) that are either generated by the dehydrogenases of glycolysis, the oxidation of lactate, pyruvate and fatty acid ~-oxidation, or the citric acid cycle, deliver electrons to the mitochondrial respiratory chain, resulting in ATP formation by oxidative phosphorylation.
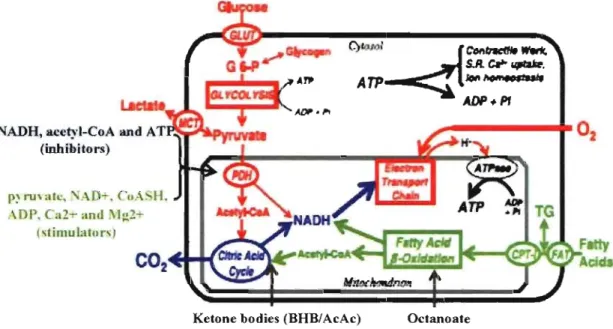
The regulation of the Krebs' cycle is largely determined by substrate availability, product inhibition and competitive feedback inhibition mechanisms. Fuel enters the Krebs' cycle primarily as acetyl-CoA. The generation of acetyl-CoA from fatty acid ~-oxidation and from pyruvate oxidation is, therefore, a major control-point of the Krebs' cycle. The rate of CoA production in the heart is strictly coordinated with the rate of acetyl-CoA utilization by Krebs' cycle. The reaction of the POH complex serves to interconnect the metabolic pathways of glycolysis, gluconeogenesis and fatty acid synthe sis to the Krebs' cycle. The POH activity is inhibited by NADH, acetyl-CoA and ATP, and activated bypyruvate, NAD+, non-acetylated CoA (CoASH), ADP, Ca2+ and Mg2+ 16-20. Regulation
NADH, acctyl-CoA and A T~,.,,~~~
(inbibitors)
ADP, ClIl-r and M:,:2+
C\timulator\)
Ketone bodies (BHB/AcAc) Octanoate
Figure 2: Pathways and regulatory points of myocardial substrate metabolism. The
reducing equivalents are produced primarily in the fatty acid ~-oxidation pathway, the citric acid cycle, and to a lesser extent from the pyruvate dehydrogenase reaction and glycolysis.
CPT -l, carnitine palmitoyltransferase-1; FAT, fatty acid transporter/CD36; G 6-P, glucose 6-phosphate; GLUT, glucose transporters; MCT, monocarboxylic acid transporters; PDH, pyruvate dehydrogenase; SR, sarcoplasmic reticulum; CoASH, non-acetylated CoA; BHB,
ofthe flux and activity ofPDH are therefore detennined by alteration ofthe NADHlNAD+, acetyl-CoAiCoASH and ATP/ADP ratio. NADH ~d FADH2 produced from the
acetyl-CoA are strongly dependent on appropriate balance of fatty acids, carbohydrates and ketone bodies utilization. Pyruvate is one important metabolite. Under anaerobic conditions, pyruyate is fermented into lactate or alcohol to regenerate NAD+. Under aerobic conditions pyruvate is converted into acetyl-CoA by pyruvate dehydrogenase. Zhou et al. 21 studied
myocardial substrate metabolism and showed that an elevation in arterial lactate concentration greatly increased the cytosolic NADH/NAD+ ratio but had a lesser effect on the mitochondrial NADH/NAD+ ratio. On the other hand, stimulation of diabetic conditions reduced pyruvate oxidation and the cytosolic NADH/NAD+ ratio but did not effect mitochondrial NADH/NAD+ ratio. The ratio of NADH/NAD+ in the mitochondria is comparatively stable. Octanoate is another crucial substrate. This medium chain fatty acid is not regulated by the camitylpalmitoyl transport system in cardiomyocytes 22-24, but is
completely oxidized through the mitochondrial ~~oxidation and respiration pathways 25,26.
It induces both, the NADH generation by the Krebs' cycle following dehydrogenation of octanoyl-CoA 27 and an uncoupling effect 28. Ketone bodies consist of the molecules ~
hydroxybutyrate (BHB), acetoacetate (AcAc) and acetone, which are produced from fatty acids, the heart extracts and oxidizes ketone bodies in a concentration-dependent manner. The concentration ofketone bodies in the arterial plasma is normally very low, and a minor contribution of substrates for the myocardial metabolism. However, during starvation or poorly controlled diabetes, plasma ketone body concentrations are elevated, and become a major substrate for the myocardial metabolismll, 17. BHB is oxidized into AcAc and NADH
is produced dependently on the BHB/AcAc ratio 29. Oxidation of glucose and lactate are
inhibited by elevated plasma ketone bodies 17, 30, e1evated rates of BHB and AcAC
oxidation could inhibit fatty acids ~-oxidation by increasing the intramitochondrial NADH/NAD+ ratio 26,31.
"
.
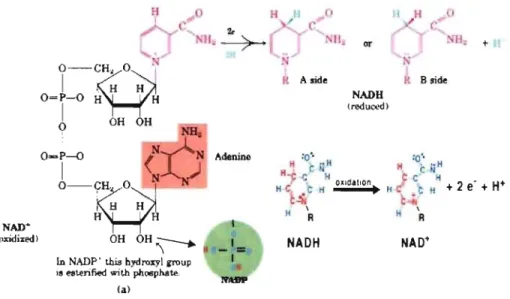
" ..1.1.3. Structure and function of NAD(P)H molecule 1
Nicotinamide adenine dinucleotide phosphate (NADPH) and NADH (Fig. 3) are two
,,'
of the most important coenzymes in the cardiac cell. Both molecules are synthesized,from riic.ot~namide. NADH consists of two nucleotides joined by a pair of bridging phosphate groups, white NADPH is NADH with a third phosphate group attached to the hy'droxyl 'group( -OH) on the position of 2' carbon in the ribose sugars. Because of the positive charge on the nitrog~n atom in the nicotinamide ring (upper right), the oxidized forms of these redox reagents are often depicted as NAD+ and NADP+ respectively. The contribution of °NADH and NADPH intrinsic fluorescence signal response to UV excitatioùare,much:i~ss clearly identified in living cell 32 (see also Appendix -1)33 when both c.oenzyineS are
, . '
discussed, they are therefore referred to collectively as NAD(P)H. Each molecule ofNAD+ (or NADP+) can acquire two electrons to be reduced (equation
1);
ho~€!vér,,:only one proton accompanies the reduction. The other proton produced as two hydrôgen: ~toms'afe removed . from the molecule which being oxidized and is liberated mto-thesurr(jlm4i~g.in~dium.
Thel:",
reaction is thus:
NAD+ + 2H +2e-+-+ NADH +
W
(1)',- "
Both coenzymes play crucial roles in most bioenergetic and biosynthetic processes as irltracellular carriers of reducing equivalents and participànts in both metabolic redox reaction, as weil as in cell signaling 34-36. NADH ana NADPH are distinct in their
biochemical roles: NADH is employed to generate proton motive force that can drive the
'-:.
synthesis of ATP. NADPH is not used for ATP synthesis but its electrons provide the energy for certain biosynthesis reactions. Furthermore, NADPH is an important co-factor for several enzymes, sorne involved in antioxidant processes put in place to counteract the generation of reactive oxygen species (ROS) by oxidative respiration and/or oxidative stress 37. NADH is the predominant reduced pyridine nucleotide, and it has been found that,
in isolated heart mitochondria, the concentration of NADH is greater than that of NADPH
H 0 H 11 l e ' C ~ '11_+ Nil O-C~H. 0 '1 1 f H H O=P-O H H
~
OH OH 1 ~O~P-û
(N~~
1NY
O-~H 1 •. o H H H OH OH~ln NADP' this hydroxyl voup
;8 es~rified with phOliphate.
(a) Ade.nine _ 1. 1 Et A .ide NADH OT NADU (roduœd) H
/
-'
N 1 k B 9ide :0" !J. + H t ijH C C· li H ~ C H + 2 e' + W ~.
H \ RFigure 3: Structure of NAD (Pt and NAD(P)H molecules. Left, Oxidized form ofNAD+
(Ieft), reduced form of NADH (upper right), NAD PH is NADH with a third phosphate
group attached at the bottom (lower left). Oxidation of NADH to NAD+ removes two
is called NAD(P)HlNAD(Pt ratio, which can be regarded as an indicator of cellular redox status. The NADP+ INADPH ratio is - 200 times lower than the NAD+ INADH ratio 42,43, these different ratios reflect the different metabolic roi es ofNADH and NAD PH.
1.1.4. Mitochondrial respiratory chain
As mentioned in previous section (1.1.2), energy sources such as glucose and fatty acids are initially metabolized in the cytoplasm, converted to acetyl-CoA in TCA cycle and the products of NADH and F ADH2 are then imported into rnitochondria. Electrons from these donors are passed through a series of redox reactions protein complexes called the electron transport chain (ETC) 4, 7, located in the rnitochondrial inner membrane, and are delivered to oxygen, forrning water. By definition, O2 consumption at the electron transport system is known as respiration; the protein complex that carry it out are known as the respiratory chain. Electrons from NADH and F ADH2 are transported via the respiratory chain as follows:
NADH ---+ Complex 1 ---+ Q ---+ Complex III ---+ cytochrome C ---+ Complex IV ---+ 02
i
Complex II
Complexes l, III and IV are proton pumps, while Q and cytochrome C are mobile electron carriers. Complex II is not a prot~n pump, it serves to funnel additional electrons into the qui none pool (Q) by removing electrons from succinate and transferring them (via F ADH2) to Q. The electron acceptor is molecular oxygen. The redox reactions catalyzed by Complex 1 and Complex III exist roughly at equilibrium. This means that these reactions are readily reversible, simply by increasing the concentration of the products relative to the concentration of the reactants (for example, by increasing the proton gradient). ATP synthase is also readily reversible. Thus ATP can be used to make a proton gradient, which in turn can be used to make NADH.
intermembrane space
2 H+
matrix
NADH + H·
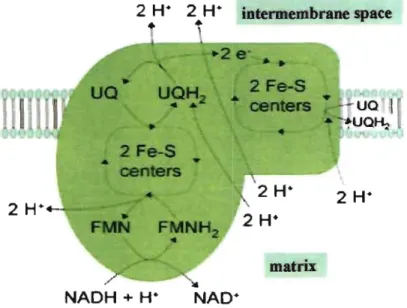
Figure 4: Complex 1 of the mitochondrial respiratory chain. Electrons and protons from
NADH oxidation on their way from FMNH2 to UQH2 are translocated across the inner
mitochondrial membrane, from the matrix to the intermembrane space in the Complex 1 of
chain is the NADH, which accounts for 95% of ATP generation via dehydrogenation of NADH to NAD+ by Complex 1 of the mitochondrial respiratory chain 45,46. Binding of
NADH to Complex 1 results in oxidation of NADH to NAD+, electrons and hydrogen atoms are removed from NADH, reducing flavin mononuc1eotide (FMN) to FMNH2 in one two-electron step (equations 2). The next electron carrier is a Fe-S cluster which can only accept one electron at a time to reduce the ferric ion into a ferrous ion. The electron then travels from the Fe-S c1uster to the oxidized a coenzyme Q (UQ) to give the free-radical (semiquinone) form ofUQH2 (equation 4), eventually the electrons flow through aH three on their way from FMNH2 to UQH2, involving the uptake of two protons as UQ is reduced to UQH2 due to the transferring of 2 electrons from the aforementioned iron-sulphur c1uster (Fig. 4). The equations of the reaction at Complex 1 as foHows:
NADH
+
H++
FMN=>
NAD++
FMNH2 (2)FMNH2
=>
FMN + 2e- + 2W UQ+
2e-+
2W=>
UQH2(3)
(4)
NADH feeds electrons into the respiratory chain at Complex l, and succinate enters via F ADH2 at Complex II (Figure 5). As the electrons are shuttled through the inner membrane to generate the flow of electrons (L\p) consisting of membrane potential (L\\jI) (negative inside), four protons (H+) are concomitantly translocated from the matrix to the intermembrane space located between the inner and outer mitochondrial membranes, establishing a proton gradient (L\pH) (alkaline inside), eventually constituting the proton motive force (L\/lH). The electrons that travel down the respiratory chain by sequential redox reactions at complexes I-IV are eventually transferred to 02 (Fig. 5), molecular oxygen is thereby reduced to water, and a large amount of stored energy is liberated for ATP synthesis when
W
gradient reduced across the mitochondrial inner membrane17•Protons return down their gradient either via a proton leak (as is the case during uncoupling effect) or via the ATP synthase. At complex V(the F]Fo-ATPase) of the respiratory chain, proton motive force provides the free energy for the generation of ATP from ADP via oxidative phosphorylation 11,47.
Matrix Cbemical pot.eDtial âpH (iDside a1kaline) Antimycin + + ATP syntbesia driven by proton-motive force ElectricaJ poteDtial 4'; (iDside negative) Intermembrane DNP + space { + . . - ' CCCP , ~ FCCP
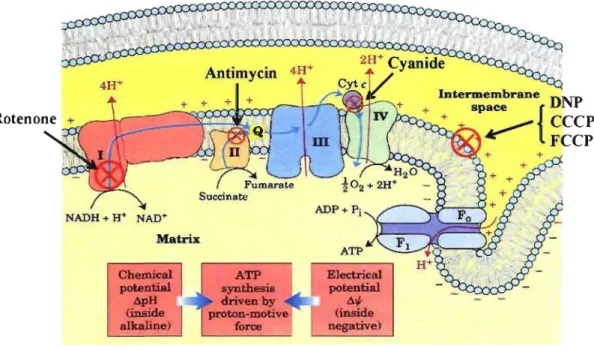
Figure 5: Mitochondrial respiratory chain and its inhibition points. Rotenone,
inhibition of NADH-CoQ reductase at Complex 1; Antimycin, inhibition of electron transfer from cytochrome b to cytochrome cl at Complex III; Cyanide, inhibition of cytochrome oxidase at Complex IV; Dinitrophenol (DNP) , Carbonyl cyanide
m-chlorophenyl hydrazone (CCCP) and Carbonylcyanide-p-trifluoromethoxy phenyl hydrazone (FCCP), both are uncoupling agents, uncoupling oxidative phosphorylation by carrying protons across the mitochondrial membrane, leading to a rapid consumption of energy without generation of ATP, hence stimulating NADH dehydrogenation. (Adapted from Biochemistry) 15.
Rotenone AntimycinA Cyanide FCCP(CCCP) Dinitrophenol (DNP) Oligomycin Function Respiration inhibitor Respiration inhibitor Respiration inhibitor Uncoupling agent Uncoupling agent Phosphorylation inhibitor
Site of action Effects on oxidative phosphorylation
NADH-CoQ reductase at Inhibition of NADH oxidation. NADH becomes reduced; substrates ComplexI such as succinate that enter via FADHz is still oxidized and make 2
ATPs/mol.
electron transfer from Ali intermediates before and in cluding cytochrome a will be in the cytochrome b to cytochrome reduced state; ail intermediates after and including cytochrome cl will
cl at Complex III Cytochrome oxidase at ComplexIV. transmembrane
Ir
carrier at complexIV transmembraneIr
carrier at complexIV ADP phosphorylation at complex Vbe in the oxidized state. It therefore prevents the oxidation of both NADH and succinate.
Blocks transfer of electrons to Oz, prevents both coupled and uncoupled respiration with aU substrates, including NADH and succinate.
Disrupt the proton gradient by carrying protons across the membrane. This uncouples proton pumping from ATP synthesis.
It uncouples oxidative phosphorylation by carrying protons across the mitochondrial membrane, leading to a rapid consumption of energy without generation of ATP.
Inhibition of ADP phosphorylation. Does not inhibit uncoupled oxidations.
The described pathway of electron flow through the ETC, together with the unique properties of the proton motive force, have been determined using a number of drugs and toxins, which inhibit oxidative phosphorylation (Fig. 5 and Table 1) 48-51. Sorne of these agents are inhibitors of electron transport at specific sites in the ETC, while others stimulate electron transport by discharging the proton gradient. For example, Rotenone inhibits the transfer of electrons from Fe-S c1uster to UQ at the Complex 1. The oxidation of substrates that generate NADH pathway is, therefore, blocked. However, substrates thatare oxidized to generate FADH2 (such as succinate or a-glycerol phosphate) can still be oxidized and generate ATP. Furthermore, cyanide inhibit cytochrome oxidase at Complx IV, blocks both site ofNADH and FADH2 oxidation 49. On the other hand, 2,4-Dinitrophenol (DNP), an uncoupling agent, which can deplete the proton gradient and collapse the proton motive force leading to less efficient ATP synthe sis, thus stimulating NADH dehydrogenation by drive oxidative phosphorylation 50.
1.1.5. Oxidative phosphorylation and ATP synthesis
Oxidative phosphorylation is defmed as complex and multi-step pro cesses in which ATP is produced by an electron transport chain, using oxygen as the fmal electron acceptor (Fig. 5). As mentioned in section 1.1.4., cardiomyocyte mitochondria produce an electrical chemical gradient by accumulating hydrogen ions in the intermembrane space. This generates an electrochemical gradient, composed of membrane electrical potential and pH difference across the mitochondrial inner membrane, while creating a proton motive force, which will be used by the F1Fo-ATPase complex to make ATP via oxidative phosphorylation. The ETC and oxidative phosphorylation are coupled by a proton gradient across the inner mitochondrial membrane, as Dr. Peter D. Mitchell (Nobel Prize in Chemistry winner, 1978) described in his chemiosmotic coupling hypothesis 52-54.
The F1Fo-ATPase located in the inner mitochondrial membrane uses the free energy charge provided by proton motive force to synthesize ATP from ADP and inorganic phosphate (Pi) in the matrix space. The Fo component of ATP synthase acts as an ion
Step Glycolysis preparatory phase Glycolysis pay-off phase Oxidative decarboxylation Krebs cycle Total yield coenzyme yield 2NADH 2NADH 6NADH 2 FADH2 ATPyield -2 4 4 (6) 6 2 18 4 36 (38) ATP Source of A TP
Phosphorylation of glucose and fructose 6-phosphate uses two ATP from the cytoplasm.
Substrate-level phosphorylation Oxidative phosphorylation. Only 2 ATP per NADH since the coenzyme must feed into the electron transport chain from the cytoplasm rather than the mitochondrial matrix. If the malate shuttle is used to move NADH into the mitochondria this might count as 3 ATP per NADH. Oxidative phosphorylation
Substrate-level phosphorylation Oxidative phosphorylation Oxidative phosphorylation
From the complete oxidation of 'one glucose molecule to carbon dioxide and oxidation of aU the reduced coenzymes.
channel for return of protons back to mitochondrial matrix. As their return, the free energy produced during the generation of the oxidized fonns ofNAD+ and FAD is released. This energy is used to drive ATP synthesis, catalyzed by the FI component of the complex 55.
The Pi for phosphorylation is imported into the mitochondria by the phosphate translocator, and ATP is subsequently exported to the cytosol in exchange for ADP by the adenine nucleotide translocator. ATP synthase catalyses the following reaction:
(5)
Components of this remarkable enzyme rotate as a part of its catalytic mechanism. It acts as revolving doors, resembling a molecular water wheel that harnesses the flow of hydrogen ions in order to build ATP molecules 56. Each NADH molecule contributes to
proton motive force to generate 2.5-3.0 ATP, while each F ADH2 molecule is worth 1.5-2.0
ATP. Alltogether, when glucose is completely oxidized to C02 and H20 during cellular respiration, produced 10 NADH and 2 F ADH2 molecules theoretical yield of 36-38 ATP molecules (Table 2). However, such conditions are generally not achieved due to losses such as proton leakage across the membrane, cost of ATP for moving pyruvate, phosphate, and/or ADP into the mitochondria, resulting in reduced efficiency of the whole process with the maximum yields c10ser to 28-30 ATP molecules 15,57.
1.1.6. Control of mitochondrial respiration and ATP syn~hesis
Control of mitochondrial respiration and ATP synthesis allows the cell to adjust its energy metabolism to demands of cellular ATP-utilizing reactions that can fluctuate rapidly. Such demands inc1ude not only ATP production, but also various biosynthetic activities of mitochondria, regulation of cellular calcium levels, etc. The demand for ATP by various tissues is dependent on the specific task of each organ. Nevertheless, the stimulation of mitochondrial function is common in all tissues in the body. The heart can almost instantaneously modulate its rate of ATP production and oxygen consumption over at least a 5-fold range in response to different workloads with only relatively minor changes in the concentration of the various intermediates involved in the oxidative pathway 17,58.
remain controversial. There are no simple answers to question: ''what controls the pro cess of oxidative phosphorylation?" For decades biochemists have investigated enzymes with the view to determine binding constants for substrates, products and inhibitors, turnover rates, feed-back control, allosteric mechanisms and the relevant ligands, regulation of activity by protein modifications, etc. Ideas such as rate-limiting enzymes4 evolved, for example,. from assumption that NADH and 02 are present in abundance, through high levels of NADH in mitochondria are present in limiting amounts, to its activity being subject to feed-back mechanisms. Feedback inhibition of PDH and a-ketoglutarate dehydrogenase activity can shut down the Krebs' cycle, thus reducing NADH production.
The cellular regulation of oxidative phosphorylation is a very complex pro cess control network, with numerous potential rate-limiting steps affected by a variety of signaling molecules, including ADP, Pi, PCr, Ca2+ and Mg2+ 59-63. Many studies observed that the level of energy-rich adenine intermediates can be remarkably constant as the metabolic rate changes 58, 59, 64. Several hypotheses have been put forward to explain the control of oxidative phosphorylation. The classical respiratory control hypothesis of Chance and Williams 65 implies that the rate of respiration is regulated by the availability of ADP to the FIFo-ATPase. The study has shown that the activation ofmitochondria by increased ADP is coupled with oxidation of NADH, resulting in decreased NADH levels in isolated mitochondria. Bose et al.63 have shown that oxidative phosphorylation is activated by Pi at three levels: (1) the generation of NADH, (2) the distribution of free energy throughout the cytochrome chain, (3) and as a substrate for ADP phosphorylation at the FIFo-ATPase. As a result, Pi is capable of increasing the ATP generation. However, a series of experiments in isolated rat hearts or instrumented dogs by Katz et al. 66 67 have shown enhanced cardiac
workload that increased oxygen consumption, but without change in ADP, ATP, Pi or PCr. They concluded that respiration is regulated up-stream by the availability of electrons to the respiratory chain, i.e., the redox state ofNADHlNAD+, rather than ADP.
Consequently, mitochondrial respiration and ATP synthesis are controlled by the mitochondrial NADH/NAD+ ratio, the phosphorylation potential, and the effectors of
cytochrome oxidase, such as pH or oxygen. ADP or Pi -dependent, as well as Ca2+_ dependent regulatory mechanisms are activation in parallel, adjusting ATP production from resting conditions to increased cardiac workload 5,21,58,60,63,64,68,69. Such parallel
activation of the respiratory chain and mitochondrial dehydrogenases by either Ca2+ or Pi, together with very rapid response in the NADH production and oxidation process virtually eliminate transients in metabolite levels during changes in work 63, 69. ADP and Ca2+ are
two principal regulatory factors. Since NADH production is activated by Ca2+ stimulation of the Krebs' cycle dehydrogenases (PDH, isocitrate- and a-ketoglutarate dehydrogenase), Ca2+ also activates the FIFo-ATPase 70,71. Changes in ATP/ ADP in the cytoplasmic and
mitochondrial compartments mediate rapid changes in the mitochondrial NADHlNAD+ ratio to regulate oxidative phosphorylation, primarily reflecting the effects of Ca2+ on the rate of NADH production by Krebs' cycle. As a result Ca2+ rather than ADP regulate cellular respiration and ATP production. But any mechanism that increases the rate of NADH oxidation concomitantly activation ofNADH production.
1.1. 7. Change in respiration and oxidative metabolism in pathophysiological conditions
It is well known that cardiac mitochondrial dysfunction following mitochondrial respiration and/or oxidative metabolism disorder is involved in many pathophysiological conditions, such as ischemia, hypoxia, stroke, hypertension, diabetes, cardiomyopathy, heart failure, and in the myocardial apoptotic process 4,7, II, 13,31,34,36,37,72. Ischemia is
described as an inadequate flow of blood and oxygen delivery to an organ, caused by constriction or blockage of the blood vessels supplying it. Insufficient blood supply causes tissue to become hypoxic, or anoxic (if no oxygen is supplied at all). This can cause tissue necrosis (i.e. cell death). In very aerobic tissues such as heart, over 90% of ATP fonnation cornes from oxidative phosphorylation, with remaining 10% being derived from glycolysis and GTP fonnation in nonnoxic conditions II. Hypoxia or ischemia are induced following
in cardiac cells. After seconds to minutes of ischemia, lack of oxygen delivery to the respiratory chain blocks the Krebs' cycle. As aerobic ATP formation from oxidative phosphorylation are insufficient to support the energy demand for heart functional activities, the cell immediately switches to anaerobic metabolism, with the productiop. of anaerobic ATP and lactic acid by glycolysis, to maintain ATP levels. This leads to a lesser use of NADH by oxidative phosphorylation, hence accumulation of cytoplasmic NADH, and is accompanied by accumulation oflactate and
W
in the cell 72-74.Cell functions are gready disrupted by the decrease in pH and ATP. ATP-linked ion transport pumps fail, causing the cell depolarization, poor ion homeostasis, and Ca2+
accumulation in the cell. Resulting excess of calcium entry overexcites cells and leads to generation of harmful chemicals, such as free radicals, reactive oxygen species (ROS) and stimulation of ca1cium-dependent enzyme, resulting in mitochondrial damage, myocardial apoptosis and necrosis 13,72. Many researchers have identified Complex 1 as a major site of
damage to the respiratory chain in ischemia 75,76. They observed a reduction in oxidation
rate for NADH-linked substrates by up to 60%, however, oxidation rates with succinate were unchanged, suggesting that damage was restricted ta Complex 1. Simultaneously, NADPH is involved in antioxidant pro cess put in place to counteract the generation of ROS by oxidative respiration and/or oxidative stress 37.
Paradoxically, however, the major damage to ischemic cells cornes from the re-introduction of oxygen (reperfusion). During reperfusion, the cells typically undergo further contraction (hypercontracture) and membrane damage, followed by cell death 77,78.
It is widely acknowledged that ischemia and reperfusion lead to mitochondrial, as well as cellular damage in cardiac cells 79-81. Because of the high oxidative metabolism, cardiac
cells have a high oxidative cap acity, demonstrated by their ultrastructure: 25-35% of total cardiomyocyte volume is occupied by mitochondria 82. Cardiomyocyte apoptosis has been
identified as an early event during ischemia-reperfusion injury 83 84. NADH fluorescence
has long been considéred as a tool to study cardiac ischemia 46,85 and NADH changes were
such as superoxide, by Complex l of mitochondrial respiratory chain is a major cause of cellular oxidative stress and contribute to ischemia reperfusion injury 87-92. The NADHlNAD+ ratio determine the rate of superoxide formation 87,90,91.
Based on what we know, the changes in mitochondrial respiration and oxidative metabolic state can also contribute to deterioration of the heart in specific cardiac pathologies, inc1uding the process ofrejection oftransplanted hearts. The allograft rejection is the most important cause of death of heart transplanted patients. Search for new diagnostic tools is therefore crucial· to insure its early detection and hence efficient prevention. Rejection ofheart transplantation inc1udes hyperacute rejection, acute rejection and chronic rejection. The risk ofrejection, highest in the frrst three post-operative months, decreases six month following transplantation mainly thanks to routine rejection surveillance and adequacy of immunosuppressive therapy. Acute rejection is defmed as lymphatic inflarnmatory infiltration with associated damage and/or necrosis of cardiaé ceUs 93. Alteration of coronary vascular regulation during acute rejection may induce graft dysfunction and promo te the occurrence of coronary atherosc1erosis in transplant recipients 94. Moreover, ischemia-reperfusion injury was also proposed to be an important alloantigen-independent factor 95 observed during cardiac rejection and leading to hypoxia
of cardiomyocytes. After six months of transplantation, the main problems of the heart transplant recipients inc1udes acute allograft rejection, cardiac allograft vasculopathy and infections, which can occur at anytime in several years after the operation 93,96. In these conditions, the coronary arteries develop progressive and diffuse focal (scattered and spread out) narrowing throughout their entire length. Such type ofnarrowing is different from the fatty or caIcified plaque that typicalIy causes atherosc1erotic coronary artery disease, but can, as welI, result in nutrient and oxygen deprivation of the heart and lead to the failure of normal function of cardiac ceUs. For these reasons, in the presence of rejection, cardiac ceUs can be in a state of hypoxia or ischemia, and celI death with impaired rnitochondrial respiration and oxidative metabolic state.
1.2. NAD(P)H fluorescence in cardiomyocyte
1.2.1. Physics of fluorescence
In physics, fluorescence is an optical phenomenon describing the fact that absorption of a photon by certain molecules triggers the emission of another photon with a longer wavelength
O.')'
Such molecule is called fluorophore. The energy difference between the absorbed and emitted photons ends up as molecular vibrations or heat. As the emitted photon has always less energy than the excited one (Eem < Eex), in regard to the equation 6, the emitted wavelength is always longer than the eXcited wavelengthO"em
>Àex). Usually, when the absorbed photon is in the ultraviolet (UV) range, the emitted light is in the visible1
range. Fluorescence occurs when a fluorophore molecule relaxes to its ground state (So) after being electronically excited (equation 7). When a fluorophore molecule absorbs a photon, it goes into its fust excited state (S1') from electronic ground state (So) (process 1 at Fig. 6), vibrational energy is lost thermally after excitation within pico seconds and the molecule drop to the ground vibrational state (S1) of the excited electronic state, the molecule then returns back to the level of So (equation 8) accompanied by the emission of the photon (process 3 at Fig. 6) and by converting the absorbed energy intemally (process 2 at Fig. 6), or by transferring the energy to the environment after a short period ofthe order of nanoseconds (ns) (Fig. 6) 97. The process of fluorescence can be described following
equations: - c Photon energy: E
=
h v=
h-Â Excitation: So+
h v ~ S~ Emission: SI ~ So+
h v (6) (7) (8)where hv is a generic term for photon energy where: h
=
Planck's constant and v=
~,
isÂ
frequency of light, c is speed of light. State So is called the ground state of the fluorophore and S1' is an excited vitrarational state of the [Ifst (electronically) excited state (Fig. 6).
~
e'
CD
c:
W
S/
---..,...--
""
...---.---
S1
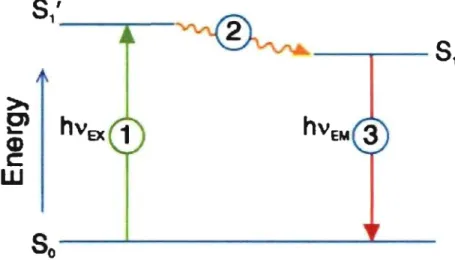
Figure 6: General scheme of the fluorescence process. Fluorophore absorbs a photon, which go es into an excited state (SI) from a ground state (Sa) (process 1). It can then return to the ground state either by the emission of the photon (process 3), by internai conversion (process 2), or by transferring the energy to the environment. hVEx, energy of the absorbed photon; hVEM, energy of the emitted photon. (Adapted from Subcellular Biochemistry) 97
When an ensemble of fluorophores are excited by a pulsed laser, their fluorescence returns to So state with a characteristic kinetics that can be defmed as an exponential decay (equation 9) and described by parameter of fluorescence lifetime, which therefore reflect the characteristic time that molecules spend in the excited state before emission of photon, which is specific for different molecular conformations.
Fluorescence typically follows fust-order kinetics as:
(9)
where [Sd is· the concentration of excited molecules at time t, [Sl]O is the initial concentration and "'t" is the decay rate or the inverse ofthe fluorescence lifetime.
1.2.2. Endogenous fluorescence of living cells
Endogenous fluorescence means that the cells contain intrinsic fluorescent molecules, namely reduced NAD(P)H and/or oxidized flavins, which naturally emit fluorescence when excited by UV, or visible light. This intrinsic property of the cells is also called auto fluorescence (AF) to be distinguished from fluorescent signaIs obtained by adding exogenous probe. Bulk of endogenous fluorescence emitted after excitation with UV or visible light in living cardiomyocytes originates from NAD(P)H and/or flavins, about 80% of AF measured after UV light excitation that originates from NADH 98-103. Fluorescence
spectroscopy has been proven to be a powerful tool with high sensitivity to study the distribution and function of biological endogenous fluorophores. Changes occurring in the cells and tissues during physiological and/or pathological processes result in modifications of the mitochondrial state, in combination with the amount and distribution of endogenous fluorophores and chemico-physical properties of their microenvironment. Therefore, analytical techniques based on AF monitoring can be applied in order to obtain information about physiological metabolic state of cells and tissues. Moreover, AF analysis can be performed in real-time because it does not require any treatment, fixing or staining of the specimens. As a results, in the past few years, numerous spectroscopic and imaging
techniques have been developed for different applications in both basic research and diagnostics 104.
AF is not only characterized byemission spectrum, but also by characteristic lifetime, as discussed in the previous section 1.2.1 and equation 9. Fluorescent lifetime is particularly useful to distinguish fluorescence components of endogenous fluorophore mixture in cells, or to monitor changes of the same fluorophore in different environments. lndeed, distinct fluorescence components have often poorly distinguishable spectra but c1early distinguishable lifetimes 105 106. Besides, natural fluorophores have often several decay components in different molecular states and variable local environments may therefore change the lifetime of these states in a specific way. As a result, there can be several fluorophore components in the same part of a ceIl, a single component being quenched with non-uniform efficiency, or there can be quenched and unquenched molecules in the same part of the cell 107. Thus, in multi-compartment, complex systems (such as cells) the observed fluorescence is often described by multi-exponential decays, even if in in vitro conditions, the studied molecule is expected to have single-exponential characteristics. As a result, time-resolved fluorescence spectra give unique precise insight into the real behavior of fluorescing molecules. Moreover, the fluorescence lifetimes can also be a direct indicator of the energy transfer rate from the excited molecules to the local environment or to other fluorophores. An efficient energy transfer process is Forster resonant energy transfer (FRET). FRET occurs if' two different fluorophores are present with the emission band of one fluorophore overlapping the absorption band of the other; the donor fluorophore is able to transfer its excited-state energy to the acceptor fluorophorelOS
-\12. When the energy is transferred, the actual fluorescence lifetime is less than in the natural state. Taking in consideration that in cell, endogenous fluorescence reflects their metabolic states, multi-parametric AF assays could, therefore, pro vide rapid and non· invasive measurement ofthe metabolic state directly in living cells.