YOUTH IN TWO ANGLOPHONE HIGH SCHOOLS IN THE MONTREAL AREA Survey on Language Practices
Diane Gérin-Lajoie, Principal Investigator Olesya Falenchuk, Research Assistant Christine Lenouvel, Research Assistant
Kirk Perris, Research Assistant
OISE, University of Toronto 252 Bloor Street West Toronto, Ontario M5S 1V6
TABLE OF CONTENTS
CHAPTER I : The Study p. 3
1. Description of the study p. 3
2. The Participating schools p. 5
3. Methodology p. 5
CHAPTER II: Results p. 7
1. Description of the sample p. 7
2. Students’ identity p. 10
3. Family background p. 13
4. Resources available in English outside of school p. 17 5. Participation in English-language groups and
associations outside of school p. 18
6. Languages spoken in the home p. 19
7. Resources in English in the home p. 27
8. Languages spoken at school p. 33
9. Concluding Remarks p. 43
CHAPTER 1 : The Study
This report examines the results of a survey administered to students in two Anglophone high schools in metropolitan Montreal, in Quebec. The purpose of this survey was to gather information on the language practices of these students; in particular, the way in which they used English, French, and other languages in their daily lives.
1. The description of the study
The study, entitled “Rapport to Identity among Youth in Anglophone Schools in Quebec” is part of a three-year research project funded by the Social Sciences and Humanities Research Council of Canada between 2005 and 2008.
For the majority of young people who belong to linguistic minorities in Canada such as young Francophones living outside Quebec and young Anglophones living in Quebec, it is not always possible to live in the minority language and culture. This situation often requires of them to constantly cross borders between minority and majority languages and cultures. What impact does this have on their identity? What relationship to identity do they develop? How do these young people see themselves? Do they think of themselves as Francophones, Anglophones, bilingual or other? Ultimately, to which group(s) do these young people identify?
This research project focused on one group of young people, i.e., Anglophones in Quebec. The objective was to examine the rapport to identity of a group of adolescents whose relationship to identity, language and culture is not well known or understood.
The study was conducted in an Anglophone secondary school environment, i.e., with students enrolled in Secondary 3 at the start of the project. Working from the principle that, rather than being innate, identity is socially constructed, the objective of the research was 1) to understand how young
people who attend English-language schools in Quebec define themselves as individuals who belong to a particular linguistic group and 2) to determine what led them to make this/these identity
choice(s). The starting point for the analysis was that an individual’s sense of belonging to a particular ethnic group is shaped by social relations and that these relationships are largely established through language practices. Thus, language plays an essential role in the construction of an individual’s identity. Students were observed and surveyed in this study based on their social relationships at home, school, and with peer group environments in which an increasing number of young people are claiming a bilingual identity for themselves. In this study, the process of identity construction is examined within these three spheres, which are powerful agents for the transmission of minority languages and cultures.
The notion of a bilingual identity is at the very centre of the study. The research was designed to deconstruct this notion in order to 1) more clearly understand its significance for this particular group of young people and 2) to pursue the exploration of whether this new identity state can exist by itself, as a stable phenomenon, or whether it is a transitory phenomenon leading to assimilation into the Quebec majority. The analysis of the question under study is important to two fields of research in particular. The first field is ethnic relations and minorities, in particular Anglophones in Quebec. This project set itself the objective of arriving at a better understanding of the identity construction process. Very little research has been done in this area in the context of official language minorities in Canada, in particular in regards to the Anglophone minority in Quebec. The second field is linguisic minority education, in particular, in the context of the role of the linguistic minority school as an agent of linguistic, cultural and social reproduction. An analysis of the identity construction process in high school students can only lead to a better understanding of young Anglophones in Quebec. On a social level, such a study can make a significant contribution to better understand youth’s perception of belonging to a particular group. Drawing on our previous studies on Francophones living outside
Quebec, the present study makes it possible to develop a foundation on which to compare Canada’s official language minorities and to shed new light not only on the reality of Anglophones in Quebec, but also on the reality of Francophones outside Quebec through a comparative analysis.
2. The Participating schools
The study was conducted in two high schools from two different Anglophone school boards in the Montreal area. The first school, named School A, is located on the Montreal southshore. At the beginning of the study, School A had an enrolment of about 545 students. Some came from the school surroundings, but the majority came from further away. The school had 30 full-time teachers. The second school, School B, is on the Montreal island and had 713 students the first year of the study. Students came from all around Montreal. The majority of students were from an Italian background. The school counted 38 full-time teachers.
3. The methodology
A mixed methods approach was used in the study. First, a brief survey questionnaire on adolescents’ linguistic practices was administered in order to 1) gather demographic and linguistic information from a total of 106 participants and 2), select 10 participants for the ethnographic study, which consisted of doing observations in the school context; semi-structured interviews with the selected participants, members of their family, friends, teachers, and an analysis of pertinent school documents. By privileging the ethnographic approach, it was possible to capture some of the everyday experiences of the research participants as members of a minority language group, as well as the meaning they placed on these experiences. In the context of the present report, only the survey results will be discussed.
The survey questionnaire included 35 questions (they were for the most part closed) on linguistic practices and was administered to Secondary 3 students from two high schools in the Montreal area (Schools A and B). The results were analyzed with SPSS (Statistical Package for the
Social Sciences). The questions were divided into the following sections: Student Profile, Family Profile, Community Profile, Language Profile – Family, Language Profile – School, Language Profile – Leisure Activities and Language Profile – Employment and Volunteer Work.
CHAPTER 2: Results 1. Description of the sample
The sample consisted of 106 students, 30 of whom were from School A and 76 of whom were from School B. All students were enrolled in Secondary 3 at the start of the study. Approximately three-quarters (72.6%) of the students were 14 years old; 27.4% of the students were 15 years old (Table 1). As illustrated in Table 2, the sample contained slightly more girls than boys (55.7% compared to 44.3%).
Table 1 Age Distribution by School
School A School B Total
Age 14 Count 21 56 77 % 70.0% 73.7% 72.6% 15 Count 9 20 29 % 30.0% 26.3% 27.4% Total Count 30 76 106 % 100.0% 100.0% 100.0%
Table 2 Age Distribution by Gender
Female Male Total
Age 14 Count 45 32 77 % 76.3% 68.1% 72.6% 15 Count 14 15 29 % 23.7% 31.9% 27.4% Total Count 59 47 106 % 100.0% 100.0% 100.0% Grouped % 55.7% 44.3% --
Of the students in the sample, over 95% (101) were born in Canada, and of this group only one was born outside of Quebec. Of the 100 students born in Quebec, 86.9% were born in Montreal. The remaining five students in the sample were born either in France, Germany, Romania or China.
Table 3 Students’Place of Birth
School A School B Total Place of birth Quebec Count 28 72 100 % 93.3% 94.7% 94.3% Elsewhere in Canada Count 0 1 1 % 0% 1.3% 0.9% Elsewhere in the world Count 2 3 5 % 6.7% 3.9% 4.7% Total Count 30 76 106 % 100.0% 100.0% 100.0%
As shown in Table 4, most of the students (82.2% of the sample) have lived for more than 11 years in the same residence.
Table 4 Years lived in the same residence
School A School B Total
Number of Years 1-2 years Count 2 1 3 % 7.4% 1.4% 3.0% 3-5 years Count 5 2 7 % 18.5% 2.7% 6.9% 6-10 years Count 3 5 8 % 11.1% 6.8% 7.9% 11 years + Count 17 66 83 % 63.0% 89.2% 82.2% Total Count 27 74 101 % 100.0% 100.0% 100.0%
The demographic characteristics of the students at each school were analyzed separately. The analyses revealed that the samples from the two schools were not significantly different in terms of age, gender distribution or place of birth. Table 5 indicates that a higher percentage of students from School B attended elementary schools where the language of instruction was English (47.4%), compared to students from School A (27.6%). A small portion of students from School A attended elementary school in French (6.9%), compared to 0% in School B. Near the majority of students attended French
immersion programs in elementary school (51.7% in School A and 46.1% in School B). Of the students who were enrolled in elementary schools where the language of instruction was neither English or French, 13.8% were students from School A, compared to 6.6% at School B.
Table 5. Elementary school - language of Instruction Distribution by School School name Total School A School B Elementary school language of instruction English Count 8 36 44 % 27.6% 47.4% 41.9% French Count 2 0 2 % 6.9% 0% 1.9% Imm. (Fr) Count 15 35 50 % 51.7% 46.1% 47.6% Other Count 4 5 9 % 13.8% 6.6% 8.6% Total Count 29 76 105 % 100.0% 100.0% 100.0%
In combining the data of the two schools together it was found that the largest number of students in the sample attended French immersion classes at the elementary school level (50 students; 47.6% of the sample). For the second largest number of students (44), English was the language of instruction at the elementary level (41.5%). Only two students attended elementary schools in which French was the language of instruction. Nine students reported different combinations of the three possibilities for the language of instruction at the elementary level (immersion, French, and English). The distribution of student responses to this question did not differ significantly from one school to the other.
2. Students’ identity
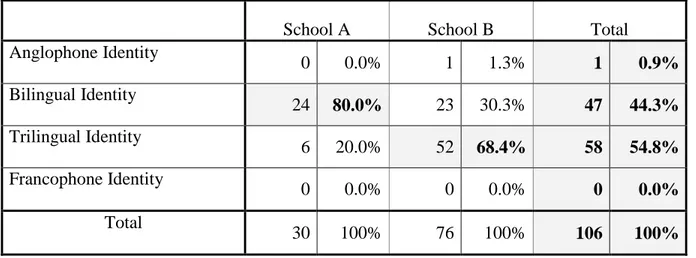
In Table 6, over half of the students in the sample (58) claimed a trilingual identity (54.8%). Forty-seven students identified a bilingual identity (44.3%). Only one student (0.9%) identified himself as an Anglophone. None of the students identified themselves as Francophones. The distribution of students in the two schools according to identity was significantly different, 2(2) = 21.61, p < .001. As can be seen from this table, the majority of students from School A (80%) claimed a bilingual identity, whereas the majority of students from School B (68.4%) claimed a trilingual identity.
Table 6 Students’ perceived identity at the two schools
School A School B Total
Anglophone Identity 0 0.0% 1 1.3% 1 0.9% Bilingual Identity 24 80.0% 23 30.3% 47 44.3% Trilingual Identity 6 20.0% 52 68.4% 58 54.8% Francophone Identity 0 0.0% 0 0.0% 0 0.0% Total 30 100% 76 100% 106 100%
All 47 students who reported having a bilingual identity specified their first and second
languages. The results are shown in Figure 1. Forty-three bilingual identity students (91.5%) reported that English and French were their two languages. English was reported as a first language by 74.5% of the bilingual identity students (35 students) and as a second language by 25.5% of the bilingual identity students (12 students). French was reported as a first language by 23.4% of the bilingual identity students and as a second language by 68.1% of these students. Four students who claimed a bilingual identity spoke English and one other language (i.e., Chinese, Portuguese or Tamil).
0 5 10 15 20 25 30 35 40
English French Other
N um be r of S tud e nt s First Language Second Language
Figure 1. First and second languages of students claiming a bilingual identity The responses of the students claiming a bilingual identity with respect to their first language were significantly different from school to school, 2(2) = 14.30, p < .001. About 96% of these students at School B reported English as their first language. An almost equal number of students reported English or French as their first language at School A. All 24 students claiming a bilingual identity at School A reported either English or French as their second language.
Table 7 First language of students claiming a bilingual identity
School A School B Total
English 13 54.2% 22 95.7% 35 74.5% French 11 45.8% 0 0.0% 11 23.4% Chinese 0 0.0% 1 4.3% 1 2.1% Total 24 100% 23 100% 47 100%
Only six of the 58 students claiming a trilingual identity were from School A. This number was too small to enable us to look at this school separately. Consequently, the results for these students are presented for the entire sample. All 58 students reported their first, second, and third languages. The results are presented in Figure 2. One hundred per cent of the students reported English and French as two of their three languages. 65.5% of students (38 students) reported English as their first language; 31.1% of the students claiming a trilingual identity (18 students) reported it as their second language, and 3.4% of students (2 students) reported English as their third language. French was reported as a first language by 5.2% of the trilingual students, as a second language by 53.4% of the trilingual students, and as a third language by 41.4% of the trilingual students. The most common third language was Italian (48.4%). Italian was reported as a first language by 15.5% of the students and as a second language by 10.3% of the students. Four students reported that Spanish was either their first, second or third language. Other languages spoken were Chinese, Punjabi, Romanian, Tamil, Polish, and Bengali. Fifteen students reported one of these languages as either their first, second or third language.
0 5 10 15 20 25 30 35 40
English French Italian Spanish Other
N umbe r of S tud en ts First Language Second Language Third Language
Figure 2. First, second, and third languages of students claiming a trilingual identity 3. Family Background
Figure 3 shows the mother’s place of birth for the 106 students in the study. As can be seen, 68% of mothers were born in Canada, and 87.5% of those born in Canada were born in Quebec. The mothers of the remaining students were born in the United States (1%), Europe (15%), South-East Asia (12%) or South America (4%).
South America 4% Argentina Brasil Gayana Chili South-East Asia 12% Bangladesh China Hong Kong India Vietnam Sri Lanka USA 1% Quebec 60% Elsewhere in Canada 8% Europe 15% Belgium Italy Spain Poland Portugal Romania
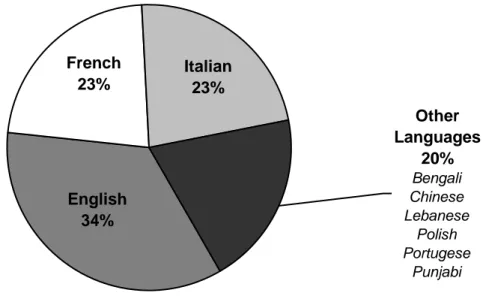
The distribution of the mother’s first language is presented in Figure 4. Here the mothers of the majority of the students in the sample spoke English, French or Italian as their first language. English was reported as the mother’s first language by 34% of students; French and Italian were both reported as the mother’s first language by 24% of students. Twenty per cent of students reported other
languages as their mother’s first language.
English 34% French 23% Italian 23% Other Languages 20% Bengali Chinese Lebanese Polish Portugese Punjabi
Figure 4. Mother’s first language
One hundred and two students reported the language that their mother spoke at work. The largest percentage of students reported their mothers spoke both English and French at work (45%). English was reported as the only language that their mother spoke at work by 31% of students. French was reported as the only language of communication used by their mother at work by 13% of
students. Six percent of students reported that their mothers were bilingual, speaking English and some other language (other than French) and 4% reported that their mothers were trilingual being able to speak English, French, and some other language in the workplace.
French 13% English 31% English and some other language 6% Italian Tamil Bengali Tamil Other 1% Sri Lankan English, French and some other language 4% Italian Spanish English and French 45%
Figure 5. Languages spoken at work by mother
One hundred and four students reported their father’s place of birth (Figure 6). As can be seen from this figure, 67% of the fathers were born in Canada, and 90% of those born in Canada were born in Quebec. The fathers of the remaining students were born in the United States (2%), Europe (14%), South-East Asia (13%), South America (4%) or the Middle East (1%).
South America 3% Brazil Gayana Mexico South-East Asia 13% Bangladesh China Hong Kong India Sri Lank a M iddle East 1% Lebanon USA 2% European Countries 14% Italy Spain Portugal Poland Romania Elsewhere in Canada 7% Quebec 60%
The distribution of first languages spoken by fathers is given in Figure 7. As can be seen from this figure, the fathers of the majority of the students in the sample spoke English, French or Italian as their first language. English was reported as the father’s first language by 34% of students. Italian was reported as the father’s first language by 26% of students. French was reported as the father’s first language by 22% of the students. Eighteen percent of students reported another language as their father’s first language.
Other 18% Armenian Bengali Chinese Polish Portugese Punjabi Romanian Italian 26% French 22% English 34%
Figure 7. Father’s first language
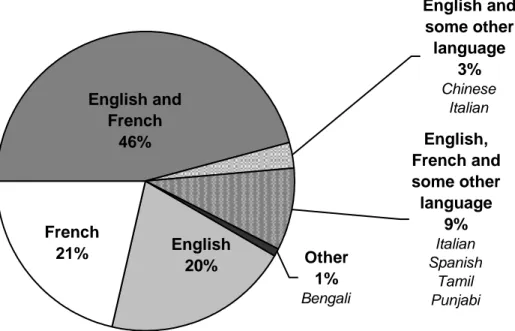
One hundred and three students responded to the question concerning the language spoken in the workplace by their father. The largest percentage of students reported that their father spoke both English and French at work (46%). English was reported as the only language that their father spoke at work by 20% of the students. French was reported as the only language that their father spoke at work by 21% of students. Three percent of students reported their father spoke English and some other language (other than French) and 9% reported their father spoke English, French and some other language in the workplace.
Other 1% Bengali English, French and some other language 9% Italian Spanish Tamil Punjabi English and some other language 3% Chinese Italian English 20% English and French 46% French 21%
Figure 8. Languages spoken at work by father
One hundred and five students answered the questions about the number of siblings in their family and their birth order. Ten of the students (9.5%) were only children. Of the 95 students who had siblings, 57 (60%) had one sibling, 28 (29.5%) had two siblings, and the remainder (10.6%) had more than two siblings. Of the students who had siblings, 44 (46%) were the oldest child, 38 (40%) were the youngest child, and 13 (14%) were the middle child in the family.
4. Resources available in English outside of school
The students were asked a number of questions about the English-language resources available to them outside of school. The results for these questions are summarized in Figure 9. More than 95% of the students reported that each of the resources listed in the questionnaire was available to them. The only exception was plays; a large percentage of students did not know whether plays were available to them or not.
Figure 9. English-language resources outside of school
5. Participation in English-language groups and associations outside of school
The students were asked whether they participated in any groups or associations using English as a language of communication. Forty-two and a half percent (45 students) responded yes to this item. The types of groups and associations mentioned by these students are presented in Figure 10. The majority of students (84%) indicated various athletic groups as their activities in English outside of school. A smaller number of students reported that they belonged to dance or cheerleading groups (16%) or youth associations (11%).
4% 7% 11% 16% 84% 0 10 20 30 40 50
Sports Dancing Youth Groups M usic Church Figure 10. Participation in groups/associations in English outside of school – 6. Languages spoken in the home
Of the students who reported speaking English at home, 57.1% always spoke English with their mother and 45.2% always spoke English with their father. Only 4.8% never spoke English at home with their mother and 9.6% never spoke English at home with their father. Of the 94 students who had siblings, 68.1% always spoke English with their brothers or sisters. None of the students reported that they never spoke English with their siblings.
Table 8 Students who reported speaking English at home
English
Mother Father Siblings
Frequency % Frequency % Frequency %
Never 5 4.8 10 9.6 Sometimes 13 12.4 22 21.2 10 10.6 Often 27 25.7 25 24.0 20 21.3 Always 60 57.1 47 45.2 64 68.1 Total 105 100.0 104 100.0 94 100.0 Not Applicable 11 Missing 1 2 1 Total 106 106 106
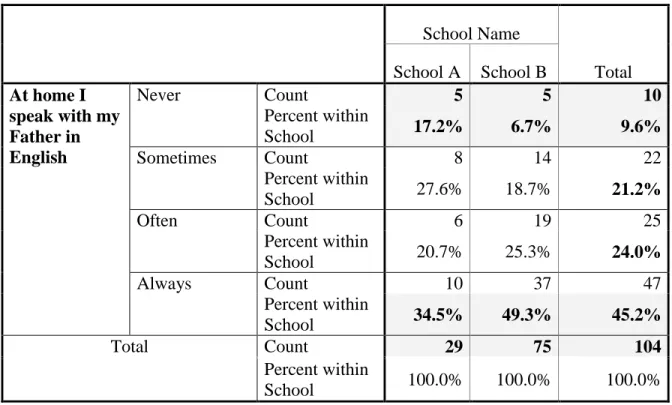
Tables nine and ten differentiate the groups based on their use of English with the mother and father. Students from School B indicated speaking English with their mother and father in a greater proportion than students from School A. Sixty-three percent of the students from School B spoke English always with their mother and 49.3% spoke English always with their father. This was noticeably lower at School A, where 41.4% of the students indicated English as the language always used with their mother and 34.5% with their father. As for students who never spoke English with their mother and father, we see that a greater proportion of these students are from School A. Nearly seven percent never used English with their mother and 17.2% never spoke English with their father. These proportions are less significant in School B where 3.9% claimed to never speak English with their mother and 6.7% to never speak English with their father. Results indicate that the use of English is more frequent with the students’ mother than with their father.
Table 9: Students who reported speaking English with Mother by School
School Name Total School A School B At home I speak with my Mother in English Never Count 2 3 5 Percent within School 6.9% 3.9% 4.8% Sometimes Count 5 8 13 Percent within School 17.2% 10.5% 12.4% Often Count 10 17 27 Percent within School 34.5% 22.4% 25.7% Always Count 12 48 60 Percent within School 41.4% 63.2% 57.1% Total Count 29 76 105 Percent within School 100.0% 100.0% 100.0%
Table 10: Students who reported speaking English with Father by School School Name Total School A School B At home I speak with my Father in English Never Count 5 5 10 Percent within School 17.2% 6.7% 9.6% Sometimes Count 8 14 22 Percent within School 27.6% 18.7% 21.2% Often Count 6 19 25 Percent within School 20.7% 25.3% 24.0% Always Count 10 37 47 Percent within School 34.5% 49.3% 45.2% Total Count 29 75 104 Percent within School 100.0% 100.0% 100.0%
In the case of the students’ siblings, participants who always used English with their siblings were in a greater proportion in School B (77.6%) than in School A (44.4%).
Table 11: Students who reported speaking English with Siblings by School School Name Total School A School B At home I speak with my Brothers and Sisters in English Sometimes Count 6 4 10 Percent within School 22.2% 6.0% 10.6% Often Count 9 11 20 Percent within School 33.3% 16.4% 21.3% Always Count 12 52 64 Percent within School 44.4% 77.6% 68.1% Total Count 27 67 94 Percent within School 100.0% 100.0% 100.0%
Indicated in Table 12 below, students speaking French at home with their mother and father did not apply to the five students who reported being Anglophones (1 student) or bilingual or who did not indicate French as one of the two languages they spoke (4 students). Of the students who reported speaking French at home, 11.1% always spoke French with their mother and 16.3% always spoke French with their father. More than 40% of the students never spoke French with their mother or father. Of the 89 students who have siblings and who are either bilingual or trilingual, with French being one of the languages they speak, only 9.0% always spoke French with their brothers or sisters, whereas 46.1% of the students reported that they never spoke French with their siblings.
Table 12: Students who reported speaking French at home
French
Mother Father Siblings
Frequency % Frequency % Frequency %
Never 42 42.4 44 44.9 41 46.1 Sometimes 32 32.3 25 25.5 29 32.6 Often 14 14.1 13 13.3 11 12.4 Always 11 11.1 16 16.3 8 9.0 Total 99 100.0 98 100.0 89 100.0 Not applicable 5 5 16 Missing 2 3 1 106 106 106
Tables 13 and 14 differentiate the groups based on their use of French with the mother and father. The use of French is more frequent for students from School A than for those attending School B. It is in the category always where the most important differences are found. Students in School A claimed to always speak French to their mother and father in the following percentages: 24.1% in the case of the mother and 31% in the case of the father. For School B, these proportions represent 5.7% (mother) and 10% (father). For those students who never speak to their mother in French, the percentages are
24.1% in School A compared to 50% in School B. In the case of the father, these percentages increase to 34.5% for students in School A and to 49.3% for students in School B.
Table 13: Students who reported speaking French with Mother by School School name Total School A School B At home I speak with my Mother in French Never Count 7 35 42 Percent within School 24.1% 50.0% 42.4% Sometimes Count 9 23 32 Percent within School 31.0% 32.9% 32.3% Often Count 6 8 14 Percent within School 20.7% 11.4% 14.1% Always Count 7 4 11 Percent within School 24.1% 5.7% 11.1% Total Count 29 70 99 Percent within School 100.0% 100.0% 100.0%
Table 14: Students who reported speaking French with Father by School School name Total School A School B At home I speak with my Father in French Never Count 10 34 44 Percent within School 34.5% 49.3% 44.9% Sometimes Count 6 19 25 Percent within School 20.7% 27.5% 25.5% Often Count 4 9 13 Percent within School 13.8% 13.0% 13.3% Always Count 9 7 16 Percent within School 31.0% 10.1% 16.3% Total Count 29 69 98 Percent within School 100.0% 100.0% 100.0%
Table 15 highlights the use of French among siblings. The proportion of students who never speak French is much greater in School B (56.5%) than it is in School A (22.2%). The same proportion of students in School A always speak French to their siblings (22.2%), compared to 3.2% in School B. When we add the categories of using French sometimes and often, the total is 55.5% for School A and 40.4% for School B. Linguistic practices are more influenced by the majority language in the south shore english-speaking school (School A) than in the one located in the City of Montreal (School B), where we find a greater concentration of anglophones.
Table 15: Students who reported speaking French with Siblings by School School name Total School A School B At home I speak with my Brothers and Sisters in French Never Count 6 35 41 Percent within School 22.2% 56.5% 46.1% Sometimes Count 9 20 29 Percent within School 33.3% 32.3% 32.6% Often Count 6 5 11 Percent within School 22.2% 8.1% 12.4% Always Count 6 2 8 Percent within School 22.2% 3.2% 9.0% Total Count 27 62 89 Percent within School 100.0% 100.0% 100.0%
As shown in Table 16, of the trilingual students and bilingual students who speak languages other than English or French, only 9.8% always speak other languages with their mother and 11.9% always speak other languages with their father. The majority of students only occasionally speak a language other than English or French with their mother (50.8%) or their father (45.8%). Almost fifteen percent of students reported that they never spoke other languages with their mother and 23.7% never spoke other languages with their father. Of the 50 students who speak other languages
and have siblings, 44% never speak other languages with their brothers and sisters, and only 6% always speak another language with their siblings.
Table 16: Students who reported speaking other languages at home
Other Language
Mother Father Siblings
Frequency % Frequency Frequency %
Never 9 14.8 14 23.7 22 44.0 Sometimes 31 50.8 27 45.8 18 36.0 Often 15 24.6 11 18.6 7 14.0 Always 6 9.8 7 11.9 3 6.0 Total 61 100.0 59 100.0 50 100.0 Not applicable 44 44 54 Missing 1 3 2 106 106 106
Despite a relatively low number of respondents, tables 17, 18 and 19 shed light on more interesting differences between the two schools in terms of speaking other languages with mother, father and siblings.
Table 17: Students who reported speaking other languages with Mother by School School name Total School A School B At home I speak with my Mother in Another language Never Count 0 9 9 Percent within School .0% 16.4% 14.8% Sometimes Count 2 29 31 Percent within School 33.3% 52.7% 50.8% Often Count 2 13 15 Percent within School 33.3% 23.6% 24.6% Always Count 2 4 6 Percent within School 33.3% 7.3% 9.8% Total Count 6 55 61 Percent within School 100.0% 100.0% 100.0%
Table 18: Students who reported speaking other languages with Father by School School name
School A School B Total At home I speak with my Father in Another language Never Count 1 14 15 Percent within School 16.7% 25.9% 25.0% Sometimes Count 1 26 27 Percent within School 16.7% 48.1% 45.0% Often Count 1 10 11 Percent within School 16.7% 18.5% 18.3% Always Count 3 4 7 Percent within School 50.0% 7.4% 11.7% Total Count 6 54 60 Percent within School 100.0% 100.0% 100.0%
Table 19: Students who reported speaking other languages with Siblings by School School name Total School A School B At home I speak with my Siblings in Another language Never Count 1 21 22 Percent within School 20.0% 46.7% 44.0% Sometimes Count 2 16 18 Percent within School 40.0% 35.6% 36.0% Often Count 1 6 7 Percent within School 20.0% 13.3% 14.0% Always Count 1 2 3 Percent within School 20.0% 4.4% 6.0% Total Count 5 45 50 Percent within School 100.0% 100.0% 100.0%
7. Resources in English in the home
Figure 11 summarizes student responses to the availability of English resources in the home. The resources listed in the questionnaire were available to 80% to 100% of the students. Newspapers were available to 81% of students. The books were the most available resource with all students indicating having English-language books in the home. The only resource reported as less available to the students was plays; a large percentage of students did not know whether plays were available to them or not.
Figure 11. Resources available in English in the home Reading activities
Students were asked about their reading activities in English, French and other languages with respect to books, magazines, and newspapers in the home context. The results for reading activities in English are reported in Table 20. A large percentage of students reported that they always read books, magazines and newspapers in English.
Table 20. Reading activities in English in the home
English
Books Magazines Newspapers
Frequency % Frequency % Frequency %
Never 6 5.7 11 10.4 20 18.9 Sometimes 24 22.6 19 17.9 25 23.6 Often 33 31.1 21 19.8 20 18.9 Always 43 40.6 51 48.1 35 33.0 Total 106 102 100 Missing 4 6 Total 106 106 106
According to the analysis by gender (Table not shown), a higher percentage of girls than boys reported reading magazines in English; 60.3% of girls reported they always read magazines in
English, while only 36.4% of boys reported to always read magazines in English.
The results for reading activities in French are reported in Table 21. As can be seen from this table, a large percentage of students reported that they never read magazines (53.5%) or newspapers (47%) in French, though only 17.9% of students indicated they never read books in French. Most students read books in French sometimes (68.9%) or often (10.4%).
Table 21. Reading activities in French in the home
French
Books Magazines Newspapers
Frequency % Frequency Frequency %
Never 19 17.9 54 53.5 47 47.0 Sometimes 73 68.9 35 34.7 35 35.0 Often 11 10.4 11 10.9 14 14.0 Always 3 2.8 1 1.0 4 4.0 Total 106 101 100 Missing 5 6 Total 106 106
Table 22 presents the results for reading activities in other languages. The majority of students in the sample never read books, magazines or newspapers in other languages. Between 14% and 22% sometimes read in languages other than English or French.
Table 22. Reading activities in other languages in the home
Other language
Books Magazines Newspapers
Frequency % Frequency % Frequency %
Never 76 74.5 80 80.8 78 80.4 Sometimes 22 21.6 14 14.1 15 15.5 Often 4 3.9 4 4.0 3 3.1 Always 0 0 1 1.0 1 1.0 Total 102 99 97 Missing 4 7 9 Total 106 106 106
Listening to radio and music
Table 23 summarizes the results of students who listened to the radio or to any music in
English, French or another language. A large percentage of students reported that they always listen to the radio (64.8%) or to music (87.7%) in English. Though a small percentage indicated not listening to the radio (2.9), none of the students reported that they never listen to English-language music.
Table 23. Listening to radio and music in English in the home
English Radio Music Frequency % Frequency % Never 3 2.9 0 0 Sometimes 11 10.5 2 1.9 Often 23 21.9 11 10.4 Always 68 64.8 93 87.7 Total 105 100.0 106 100.0 Missing 1 Total 106
Students who never listen to French-language radio made up 44.7% of the sample; 59.2% of students reported that they never listen to French-language music. The majority of students who listen to French-language radio and music do so only sometimes.
Table 24. Listening to radio and music in French in the home
French Radio Music Frequency % Frequency % Never 46 44.7 61 59.2 Sometimes 43 41.7 35 34.0 Often 10 9.7 4 3.9 Always 4 3.9 3 2.9 Total 103 100.0 103 100.0 Missing 3 3 Total 106 106
Students reported that they listen to the radio even less in other languages. Only 28.4% of students sometimes listen to the radio in other languages and 67.6% never listen to the radio in other languages. One interesting note is that in comparing Table 24 and Table 25, a larger percentage reported listening to music in other languages sometimes (30%), often (19%) and always (7%) than listening to music in French..
Table 25. Listening to radio and music in other languages in the home
Other language Radio Music Frequency % Frequency % Never 69 67.6 44 44.0 Sometimes 29 28.4 30 30.0 Often 3 2.9 19 19.0 Always 1 1.0 7 7.0 Total 102 100.0 100 100.0 Missing 4 6 Total 106 106
Audiovisual activities (TV, Video, Computer)
The students were asked whether they watch TV and DVDs, play video games or computer games in English, French or other languages. The results for English are presented in Table 26. The majority of the students always watch TV (84%) and play video games (73.9%) in English. None of the students reported that they never watch TV in English. None of the students reported that they always play games on the computer in English. Seventy-five percent of the students reported that they often play games on the computer in English.
Table 26. Audiovisual activities in English in the home
English
TV, DVD, Video Video Games Computer Games
Frequency % Frequency % Frequency %
Never 0 0 6 6.5 10 9.6 Sometimes 3 2.8 7 7.6 16 15.4 Often 14 13.2 11 12.0 78 75.0 Always 89 84.0 68 73.9 0 0 Total 106 92 104 Missing 14 2 Total 106 106
Table 27 indicates that students did not play any video games or computer games in French; 83.5% of students reported they never played video games in French and 63.7% indicated that they never played computer games in French. The percentage of students who reported that they never watched TV in French was much smaller, i.e., only 33.7%. A larger percentage of students watch TV and DVDs in French at least sometimes (49.0%).
Table 27. Audiovisual activities in French in the home
French
TV, DVD, Video Video Games Computer Games
Frequency % Frequency % Frequency %
Never 35 33.7 76 83.5 65 63.7 Sometimes 51 49.0 11 12.1 27 26.5 Often 14 13.5 4 4.4 10 9.8 Always 4 3.8 Total 104 91 102 System 2 15 4 Total 106 106 106
Similar patterns were observed for audiovisual activities in other languages. In Table 28, it is shown that the majority of students never watched TV (55.0%) or played video games (94.4%) or played computer games (94.0%) in other languages. A considerably larger percentage of students reported sometimes watching TV in other languages (33.0%) compared to the percentage of students who sometimes played video games (5.6%) or worked on the computer (5.0%) in other languages.
Table 28. Audiovisual activities in other languages in the home
Other language
TV, DVD, Video Video Games Computer Games
Frequency % Frequency % Frequency %
Never 55 55.0 84 94.4 94 94.0 Sometimes 33 33.0 5 5.6 5 5.0 Often 5 5.0 1 1.0 Always 7 7.0 Total 100 89 100 System 6 17 6 Total 106 106 106
8. Languages spoken at school
The students were asked what languages they spoke with their peers in the classroom. The results for this set of questions are provided in Table 29. As can be seen, the majority of students always used English to speak with their peers (70.8%). They sometimes spoke French (55.3%), but never other languages (81.8%). None of the students reported never speaking English or always speaking other languages with their peers.
Table 29. Languages spoken with other students in the classroom
English French Other Language
Frequency % Frequency % Frequency %
Never 0 0 16 15.5 81 81.8 Sometimes 5 4.7 57 55.3 17 17.2 Often 26 24.5 20 19.4 1 1.0 Always 75 70.8 10 9.7 0 0 Total 106 100.0 103 100.0 99 100.0 Missing 3 7 Total 106 106
There were significant differences between the schools in terms of responses to the question about the languages that students spoke with other students in the classroom (English: 2(2) = 17.07, p < .001; French: 2(3) = 29.53, p < .001). The distribution of responses about other languages was not significantly different between the two schools. A considerably larger percentage of students always spoke English with other students at School B, compared to School A (81.6% vs. 43.3%).
The opposite was true for French. The number of students who always or often speak French with their classmates was greater at School A than at School B (see Tables 30 and 31).
Table 30. Students reporting speaking English with other students by School
School Name Total School A School B Sometimes 4 13.4% 1 1.3% 5 4.7% Often 13 43.3% 13 17.1% 26 24.5% Always 13 43.3% 62 81.6% 75 70.8% Total 30 76 106
Table 31. Students reporting speaking French with other students by School
School Name Total School A School B Never 1 3.3% 15 20.5% 16 15.5% Sometimes 9 30.0% 48 65.8% 57 55.3% Often 13 43.3% 7 9.6% 20 19.4% Always 7 23.3% 3 4.1% 10 9.7% Total 30 73 103
In Table 32, the majority of students reported that they always spoke English (63.1%), sometimes spoke French (53.8%), and never spoke another language (93.9%) with their teachers in the classroom. About 30% of students reported they often spoke English and French with their teachers.
Table 32. Languages spoken with teachers
English French Other Language
Frequency % Frequency % Frequency %
Never 2 1.9 2 1.9 93 93.9 Sometimes 5 4.9 56 53.8 5 5.1 Often 31 30.1 35 33.7 0 0 Always 65 63.1 11 10.6 1 1.0 Total 103 100.0 104 100.0 99 100.0 Missing 3 2 7 Total 106 106 106
As reported in Table 33, most students always spoke English with other students outside the classroom (74.3%). The percentage of students who sometimes spoke French or another language with other students was similar (35.3% and 27.6% respectively). About 25% of the students reported they often or always spoke French to other students outside the classroom..
Table 33. Languages spoken with other students outside of the classroom
English French Other Language
Frequency % Frequency % Frequency %
Never 2 1.9 39 38.2 66 67.3 Sometimes 5 4.8 36 35.3 27 27.6 Often 20 19.0 14 13.7 4 4.1 Always 78 74.3 13 12.7 1 1.0 Total 105 100.0 102 100.0 98 100.0 Missing 1 4 8 Total 106 106 106
It was found that students who spoke French outside of the classroom was significantly different at the two schools ( 2(3) = 31.14, p < .001). As can be seen from Table 34, 50% of students in School B never spoke French with their peers outside of the classroom, while 60% of the students in School A always or often spoke French with their peers outside of the classroom.
Table 34. Students reporting speaking French with other students outside the classroom by School School Name Total School A School B Never 3 10.0% 36 50% 39 38.2% Sometimes 9 30.0% 27 37.5% 36 35.3% Often 7 23.3% 7 9.7% 14 13.7% Always 11 36.7% 2 2.8% 13 12.7% Total 30 72 102
Table 35 shows the results for the languages students speak with their peers during extra-curricular activities. Most students reported that they always spoke English during extra-extra-curricular activities (69.0%) and never spoke French (42.4%) or any other language (80.4%).
Table 35. Languages spoken with other students during extra-curricular activities
English French Other Language
Frequency % Frequency % Frequency %
Never 6 6.0 42 42.4 74 80.4 Sometimes 10 10.0 29 29.3 15 16.3 Often 15 15.0 15 15.2 3 3.3 Always 69 69.0 13 13.1 Total 100 100.0 99 100.0 92 100.0 Missing 6 7 14 Total 106 106 106
Findings also showed that students who spoke English and French with their peers during extra-curricular activities was statistically significant (English: 2(3) = 16.24, p = .001; French: 2(3) = 22.16, p < .001). Table 36 and Table 37 breakdown these findings in English and French by school. In Table 36 one can see that more than 80% of students at School B reported they always spoke English with other students during extra-curricular activities, while only 41.4% of students at School
A gave the same response. By contrast, more than 50% of students at School A reported that they always or often spoke French with their peers during extra-curricular activities (Table 37). Only about 16% of students at School B reported the same..
Table 36. Speaking English with other students during extra-curricular activities by School
School Name Total School A School B Never 3 10.4% 3 4.2% 6 6.0% Sometimes 7 24.1% 3 4.2% 10 10.0% Often 7 24.1% 8 11.3% 15 15.0% Always 12 41.4% 57 80.3% 69 69.0% Total 29 71 100
Table 37. Speaking French with other students during extra-curricular activities by School
School Name Total School A School B Never 4 13.8% 38 54.3% 42 42.4 Sometimes 8 27.6% 21 30.0% 29 29.3 Often 8 27.6% 7 10.0% 15 15.2 Always 9 31.0% 4 5.7% 13 13.1 Total 29 70 99
Table 38 shows the responses for the languages spoken by the students with their extra-curricular activity leaders. Of the students who responded to these questions, 73.2% always spoke English, 48.5% never spoke French, and 92.5% never spoke any other language. At the same time, 30.9% of students reported they sometimes speak French with their extra-curricular activity leaders.
Table 38. Languages spoken with activity leaders during extra-curricular activities
English French Other Language
Frequency % Frequency % Frequency %
Never 8 8.2 47 48.5 86 92.5 Sometimes 5 5.2 30 30.9 6 6.5 Often 13 13.4 10 10.3 1 1.1 Always 71 73.2 10 10.3 0 0 Total 97 100.0 97 100.0 93 100.0 Missing 9 9 13 Total 106 106 106
The types of the extra-curricular activities that students participate are presented in Figure 12. This figure shows the number of students reporting each activity and the percentage of the total sample (106 students). Sport activities were the most commonly reported extra-curricular activity (44.8%). Other activities (volunteering and different kinds of clubs) were reported by considerably smaller numbers of students.
1.0% 1.0% 1.9% 2.9% 5.7% 7.6% 44.8% 0 10 20 30 40 50
Sports Volunteering Comic Book Club
Dance Club Music Computer
Club
Enginering Club
Figure 12. Extra-curricular activities reported by students
The students were asked a number of questions about their spare time activities. Figure 13 shows the activities most commonly reported by the students. Sports were the most common activity,
reported by 75.5% of students. Nearly 20% of students in the sample reported enjoying music, reading, movies, computers, and spending time with friends.
Figure 13. Favourite activities reported by students
One hundred and four students reported the languages they use during their favourite spare time activities. The distribution of their responses is presented in Figure 14. The majority of students (51%) spoke English during their free time. A smaller percentage (34%) spoke both English and French during their free time. An even smaller percentage (13%) spoke only French in their spare time.
French 13% English 51% Other Language 2% English and French 34%
Figure 14. Languages spoken by students during their favourite activities
More than half of the students (52%) reported having both Anglophone and Francophone friends. A large percentage (38%) had only Anglophone friends. As shown in Figure 15, the percentage of students who had only Francophone friends is considerably smaller (4%).
Francophone 4% Other 6% Anglophone 38% Francophone and Anglophone 52%
Figure 15. Language identification of friends reported by students
For this question, the responses of the students at School A and School B were significantly different ( 2(3) = 20.14, p < .001). Table 39 shows that whereas the majority of School A students
reported having both Anglophone and Francophone friends (79.4%), only 42.7% of School B students reported having both Anglophone and Francophone friends. About 50% of School B students reported having only Anglophone friends.
Table 39. Language identification of friends reported by students by School
School Name Total School A School B Francophone 3 10.3% 1 1.3% 4 3.8% Anglophone 2 6.9% 37 49.3% 39 37.5% Francophone and Anglophone 23 79.4% 32 42.7% 55 52.9% Other 1 3.4% 5 6.7% 6 5.8% Total 29 75 104
The students were asked whether they worked full-time or part-time and whether they did any volunteer work. Nearly 27% of the students reported working part-time and only 1.9% of students reported working full-time (Table not shown). Only 42 students answered the question about volunteer work and almost 60% of the sample did not answer this question. Of the students who responded to this question, 50% did volunteer work. The types of volunteer work reported by students are shown in Figure 16. The category reported by most students (37%) was child care (babysitting, helping at an elementary school, helping in a church nursery school).
School Committees 5% House-keeping 10% Church 10% Child Care 37% Health Care 19% Sports 19%
Figure 16. Types of volunteer work reported by students
Students who did paid work or volunteer work were asked what languages they spoke at work. The distribution of their responses is given in Figure 17. The percentages of students who spoke either English or French at work were almost equal (35% and 36%, respectively). A slightly smaller percentage (24%) reported speaking both languages at work.
English, French and some other language 5% English 35% French 36% English and French 24%
9. Concluding Remarks on the Results
The results of the survey indicate that a clear majority of students claim to have either a bilingual or trilingual identity (only one student in Table 6 identified himself as Anglophone). At School A, 80% of the students identified themselves as having a bilingual identity and 20% a trilingual identity. School B had 30.3% of the students identifying as having a bilingual identity and an astonishing 68.4% claimed a trilingual identity.
To better understand these results, we have to look at the social context in which these students live. A bilingual identity is more prevalent in the discourse of students attending School A. As stated at the beginning of the report, School A is located on the Montreal south shore where both Francophones and Anglophones live in an integrated bilingual community. Many students enrolled in this school live in exogamous families, where one of the parents is Francophone. The use of English and French on a daily basis is a fait accompli for many of them.
In the case of the high number of students at School B who claim to have a trilingual identity, the situation can be explained by the fact that the student population is heavily represented by
individuals from an Italian background. The school originally recruited most of its students within the Italian community living in the East part of Montreal. The past years have seen the student population change somewhat. It remains, however, mostly Italian.
Results also demonstrate that resources in English are readily available for students both in and outside the home. Having access to resources in the minority language does not seem to pose a major problem for the students who participated in the survey. This is an interesting finding when we compare the situation to the one lived by the other offical minority in Canada; the Francophones outside of Quebec. An ethnographic study performed with a group of adolescents enrolled in high schools in the Toronto and Ottawa areas came to the conclusion that resources in French were scarse,
even in the nation’s capital (Gérin-Lajoie, 2003). In the case of these Francophones, the challenge of living in French on a daily basis impacted heavily on the use of the minority language and culture in their activities. This does not seem to be the case for the students in the two Anglophone high schools in the present study.
The survey has been useful in providing valuable information on the linguistic reality of the two groups of students who participated. It showed that even though the students attended two Anglophone high schools, differences existed between the two realities. In the context of our larger program of research, we need to keep in mind that the present survey was also used as an exploratory tool to put in place the ethnographic component of the study.
Bibliography
Gérin-Lajoie, D. 2003. Parcours identitaires de jeunes francophones en milieu minoritaire. Sudbury: Les Éditions Prise de parole, 190 pages.