To cite this version:
Aimar, Pierre and Bacchin, Patrice Concentrated phases of colloids
or nanoparticles: Solid pressure and dynamics of concentration
processes. (2010) In: Nanoscience: Colloidal and Interfacial
Aspects. (Taylor & Francis Surfactant science series ). Taylor &
Francis (CRC Press), USA, pp. 1-256. ISBN 978-1-42-006500-8
Any correspondence concerning this service should be sent to the repository administrator: [email protected]
O
pen
A
rchive
T
oulouse
A
rchive
O
uverte (
OATAO
)
OATAO is an open access repository that collects the work of Toulouse researchers and makes it freely available over the web where possible.
This is an author-deposited version published in: http://oatao.univ-toulouse.fr/
Ref :
P. Aimar, P. Bacchin, Concentrated phases of colloids or nanoparticles: Solid pressure and dynamics of concentration processes, in Nano-science:colloidal and interfacial aspect, ed. V.M. Starov, Taylor Francis Inc, United States (2010)
ISBN: 9781420065008
Concentrated phases of colloids or nanoparticles:
Solid pressure and dynamics of concentration processes
Authors: P. Aimar and P. Bacchin Laboratoire de Génie Chimique Université Paul Sabatier 31062 Toulouse Cedex 9
[email protected], [email protected]
Introduction
The behaviour of colloids concentrated at an interface is strongly affected by surface interactions occurring on the nanoscale between colloids and between the colloids and the surface. For instance, processes such as ultrafiltration, nanofiltration or reverse osmosis which are classically used to purify, eliminate and concentrate colloids or nanoparticles strongly depend on these interfacial phenomena. The level of fouling, its kinetics or even the way colloids build up (porosity, hydraulic resistance or accumulation reversibility) are driven by colloidal properties. It is therefore necessary to establish experimental and theoretical connections between colloidal properties at the local (micro) scale and the efficiency of the concentration process; this knowledge being compulsory for the control of numerous processes dealing with nanoparticles.
In this chapter, our aim is to show how the concept of solid pressure can be a good vehicle to account for particle-particle interactions in the macroscopic description of separation processes like membrane filtration, sedimentation or drying. It will be shown how solid pressure (or to be more precise its variation with the volume fraction) can be related to the way a suspension resists an increase in concentration. We shall also try to illustrate in which way the change of state of the suspension, can be put in relation to the various forms of accumulation on a surface, both from a theoretical and an experimental point of view. The resistance of the dispersion to over-concentration will be defined by osmotic pressure variation and this resistance will be linked to a Péclet number relative to filtration conditions. The importance of a critical volume fraction inducing a phase transition between fluid (dispersed) and solid (condensed) phases will be underlined in order to describe the transition between accumulation phenomena of polarisation concentration and of dense layer formation. The consequence of this transition on the reversibility of accumulated layers will be discussed. The chapter will then investigate how the variation of osmotic pressure with volume fraction can explain the variety of accumulation phenomena occurring at an interface.
1 The concept of solid pressure to depict concentrated colloidal
or nanoparticle dispersions
1.1 Behaviour of concentrated colloidal dispersion
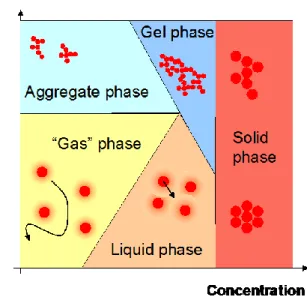
Dispersions of colloidal or nanoparticles exhibit specific behaviour when concentrated because of surface interactions which become predominant phenomena for submicron particles. These surface interactions are multiple in nature (electrostatic repulsion, Van der Waals attraction or hydrophobic-philic interaction) and have different interaction lengths; thus leading to a complex system when dispersions are concentrated. When investigating properties of concentrated colloids it can be useful to consider the phase diagram [1] as shown in Fig. 1. Five different phases appear relative to the concentration (x axis) and the degree of destabilisation (y axis):
"gas" phase: diluted dispersion of stable particles having a free and random motion
"liquid" phase: network of stable colloids interacting by repulsion and then moving from and towards equilibrium position (if particles are monodisperse, the network is ordered: colloidal liquid crystal)
aggregate phase: dilute suspension of aggregate
gel phase: network of colloids interacting by attraction characterised by an elastic behaviour solid phase: solid structure where colloids are in contact (with different compacities according
to the fractal dimension of the structure)
The degree of destabilisation is dependent on the surface properties (e.g; charge, hydrophobic-philic character) and on the composition of the interstitial liquid (e.g. ionic strength, ionic valency)
Figure 1: Schematised phase diagram of a colloidal dispersion
The boundaries between these areas correspond to phase transitions. The transition from the gas phase to the aggregate phase corresponds to an aggregation that occurs when the dispersion is destabilised (by adding a salt or a coagulant). When concentrating these phases, the creation of the liquid or the gel phase is due to the percolation of surface interactions leading to a network of interacting colloids (by repulsion for the liquid phase and by attraction for the gel). If concentrated again, these phases undergo spinodal decomposition [2,3] i.e. an irreversible transition leading to a solid structure where colloids are in contact and interact with strong Van der Waals attractions or chemical bonds (perfect sink of potential energy).
In this section, we will consider the concentration of stable colloids or nanoparticles that will lead to the formation of gas, liquid and solid phases. We will focus on the transition between fluid (gas or
liquid phase corresponding to a dispersed state) and the solid phase, which has important consequences on concentration processes because of the irreversible character of the transition.
1.2 Description of concentrated colloidal dispersions
Surface interactions between two particles (in a dilute dispersion) are depicted by DLVO theory. In simple dispersions, this theory allows the relative importance of repulsive and attractive interaction potential energy to be estimated as a function of the separation distance and then allows the stability of the dispersion to be determined. However, the application of DLVO theory to concentrated dispersions (with multi-body particle interaction) and/or for complex particles is tricky and often leads to calculations far from reality.
It is therefore interesting to consider the potential of the concept of solid pressure [4]. This notion combines the concept of osmotic pressure for the dispersed state of particles (section 1.2.1) and the concept of pressure yield stress for the solid state of particles (section 1.2.2). It then gives an equation of state [5] which is experimentally accessible and which describes the behaviour of the colloidal dispersion over its whole concentration range and its possible phases.
1.2.1 Osmotic pressure in the fluid phase
The osmotic pressure for colloids has been established via measurements for various dispersions: inorganic nanoparticles [6], phospholipid bilayers [7], DNA [8], clay particles such as laponite [9] or latex particles [10,11].
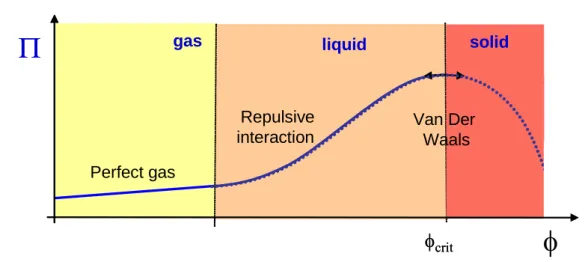
A classical theoretical variation in osmotic pressure is presented in Fig. 2 as a function of the volume fraction from computation taking into account the contribution of entropy (Brownian diffusion and excluded volume effects at high volume fraction), repulsive electrostatic repulsion and attractive Van der Waals interactions [2, 12].
vdw tic electrosta entropic osm (1) Perfect gas Repulsive interaction
gas liquid
crit Van Der Waals
solid Perfect gas Repulsive interaction
gas liquid
crit Van Der Waals
solidFigure 2: Classical variation of osmotic pressure with volume fraction for stable colloids
The first leg is a linear variation of osmotic pressure with volume fraction (Van't Hoff relationship) and corresponds to the gas phase limited by entropic contribution. When colloids are so concentrated that repulsion between particles occurs, the osmotic pressure increases more severely. This deviationspinodal decomposition [3] which is linked to an irreversible phase transition between a fluid phase where matter is dispersed to a condensed phase where matter forms a solid phase. Above the maximum, calculation with eq. 1 should give a decrease in osmotic pressure because of Van der Waals interactions. However, this part of the curve (which appears here as a dashed line) can not be experimentally observed : above the spinodal decomposition the particles form a solid state where friction between particles leads to an additional contribution not accounted actually in eq. 1. However, it is no more osmotic pressure (the osmotic pressure is a reversible thermodynamic property whereas friction are dissipative irreversible mechanisms) and then will be introduced in a new section.
1.2.2 Compressive yield pressure of colloids in a solid phase
When spinodal decomposition is reached colloids are in a “solid like” state: particles form a network under attractive interactions. In this state, an important characteristic of the network is the compressive yield stress which represents the resistance of a concentrated suspension to an external compressive field (by analogy with the compressive yield stress which represents the resistance of a concentrated suspension to an external shear field [13]. Various experiments have been performed to determine the compressive yield stress [13] and this concept has been explicitly incorporated to perform modelling of percolated particle network [14, 15].
For the estimation of compression yield pressure, calculations are classically [16] made with a power law relationship: m cp cp crit crit 1 1 1 (2)
Such an expression describes the solid pressure continuously from the critical osmotic pressure (reached at the critical volume fraction) to an infinite limit for a close packed volume fraction (physically due to Born repulsion). The exponent, m, in this relationship corresponds to the compressibility of the deposit: a small value of m corresponds to a small compressibility: the solid pressure (related to the compression) increasing rapidly with volume fraction. This compressibility can integrate physical properties of particles such as roughness, “deformability”, stickiness (degree of VdW attraction, presence of chemical bond).
1.2.3 Solid pressure: definition and example
The solid pressure corresponds to a combination of the osmotic pressure (for the dispersed phase i.e. gas and liquid phase) and the compressive yield stress (for condensed phase i.e. solid phase). It leads to a global equation of state of colloid or nano-particles from the dilute to the concentrated phase which gives a continuous picture of the different phases (gas, liquid and solid) and their associated phase transitions. phase solid in phase -liquid or gas -fluid
in Compressive yieldstress
pressure Osmotic
pressure
Solid (3)
The solid pressure is dependent on the particle size , the surface physico-chemistry, the composition of the interstitial liquid, the mechanical friction between particles, and so on. It corresponds to the resistance of the dispersion to concentration or compression and is informative on the structuration of particles during a concentration step.
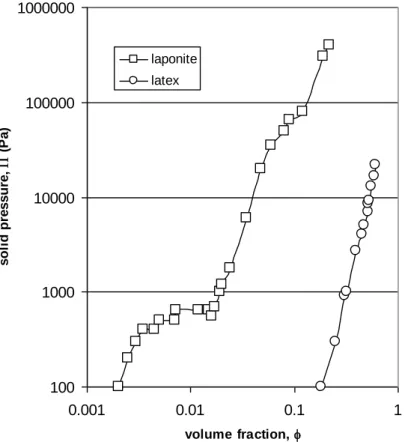
The first and greatest contribution to solid pressure comes from the particle number (Van’t Hoff equation) which, for a given volume fraction, is inversely proportional to the particle volume and thus to a3. To illustrate the way the solid pressure is correlated to particle size, figure 3 shows two different
(nanometric clay platelets: diameter of plate 30 nm for 1 nm of thickness at 10-3 M NaCl) [17] and for latex particles (spheres of 120 nm of diameter at 10-2 M KCl) [11].
100 1000 10000 100000 1000000 0.001 0.01 0.1 1 volume fraction, s ol id pre s s ure , ( P a ) laponite latex
Figure 3: Solid pressure versus volume fraction for two stable dispersions with different particle sizes: laponite particles (nanometric clay platelets: diameter of plate 30 nm, thickness 1 nm ) and latex
particles (spheres 120 nm in diameter)
The next most important contribution is from particle-particle interactions and is thus sensitive to parameters that modify the interaction (ionic strength, charge, pH, etc.). A positive contribution is expected for repulsive interactions and a negative one for attractive interactions. Figure 4 illustrates this effect through the measurement of the solid pressure of latex particles at different ionic strengths. An increase in ionic strength leads to a reduction in solid pressure: the decrease in repulsive interaction decreases solid pressure. The solid pressure in a way represents the resistance to the concentration of the dispersion: when repulsive interactions are weak the resistance is low.
0 5000 10000 15000 20000 0.2 0.3 0.4 0.5 0.6 0.7 Volume fraction (-) S o li d p re s s u re ( P a ) 10-2 M KCl (fluid phase) 10-3 M KCl (fluid phase) 10-2 M KCl (solid phase) 10-3 M KCl (solid phase)
Figure 4: Solid pressure of latex particles versus volume fraction for different ionic strengths (diamonds and circles at 10-3 M and 10-2 M in KCl respectively). Open symbols correspond to fluid
(dispersed) phase and closed symbols to solid (condensed) phase. Lines correspond to the fitting of the model described in section 2.
Solid pressure also depicts phase transition occurring during the concentration of colloidal dispersions. When particles are concentrated, the mean inter-particle distance is reduced. The Van der Waals attractive interaction (with a low distance of interaction) can then become greater than the repulsive interaction (with a large distance of interaction) as depicted through DLVO theory in terms of potential interaction energy to explain dispersion stability. In terms of solid pressure, when attractive interactions become predominant, the osmotic pressure is reduced (the ability of particles to expand in water is reduced). The attractive interactions leads to a change in the curvature of the - function towards low derivative values. Theoretically, an instability is reached when the derivative of the solid pressure with the volume fraction is equal to zero [2] :
ion decomposit spinodal 0 d d (4)
This criterion is related to the definition of the spinodal decomposition [3] which, here, relates the irreversible transition of a stable dispersed phase to a condensed phase.
Experimentally, the observation of the transition between stable and unstable dispersion through a maximum in osmotic pressure is difficult to assess. The instability is always preceded by a metastability which leads to a zone of coexistence of fluid and solid phase. However, the sol-gel transition can be assessed when the gel transition occurs over a large range of concentrations (plateau at a volume fraction of around 0.01 for laponite dispersions in fig. 3).
Such a plateau is not experimentally accessible for latex dispersions where the transition occurs in a small range of volume fraction. However the transition is distinguishable through experimental analysis of the concentrated phase in terms of the reversibility of packing [11] or of rheology [10]. Figure 4 shows a fluid-solid transition for latex particles at a volume fraction of around 0.57: the closed symbols correspond to concentrated phase, which cannot be redispersed in solvent after the compression stage (the fluid has undergone an irreversible phase transition).
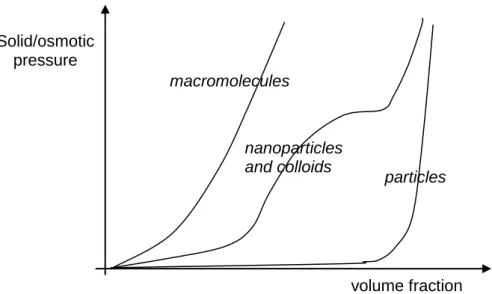
At this point, it is important to note that nanoparticles or colloidal particles present a dual behavior adopting both the behavior of macromolecules (with osmotic pressure) and that of particles (with pressure yield stress). The solid pressure is a key parameter to depict the phase equilibrium and transition occurring in this dispersion in the whole range of concentrations and then to understand the thermodynamics and the interactions in colloidal systems [18]. It represents an equation of state [5] containing all the information about colloidal and mechanical interactions.
Figure 5: Schematic representation of solid pressure for different kinds of dispersions and suspensions. Macromolecules exhibit high osmotic pressure. Particles (larger than 10 micrometers)
do not exhibit osmotic pressure but resist compression when aggregated (in the solid phase). Nanoparticles and colloids have a dual behaviour and can exhibit a gel behaviour (plateau in osmotic
pressure [19]) at high volume fraction.
These examples illustrate the variety of information that solid pressure can give in a large variety of situations, making the experimental techniques for its determination an indispensable tool for the physical chemist working with colloids or nanoparticles.
1.3 Solid pressure and the dynamics of concentration
During a concentration process, the presence of a particles number gradient produces a solid pressure gradient through the system. This solid pressure gradient induces a force on particles which leads to a macroscopic flux of particles from high to low concentration zone. This transport phenomenon can be depicted through a gradient (or collective) diffusion (defined as the collective diffusion of colloids in a concentration gradient in contrast with self-diffusion which acts on a single particle).
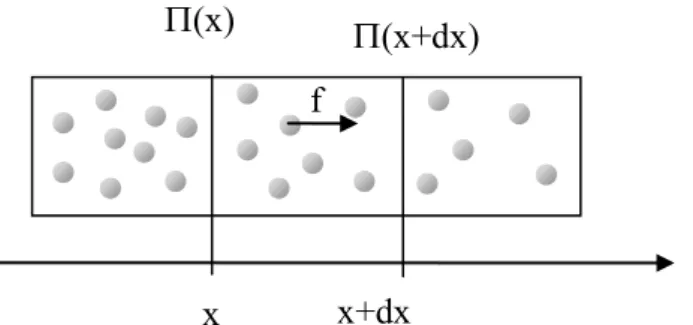
When considering a cylinder of section A, a gradient in the solid pressure induces an axial force in the volume, A dx, according to:
A dx x x) ( )) ( ( (5) macromolecules nanoparticles and colloids particles Solid/osmotic pressure volume fraction
Figure 6: Force, f, acting on one particle in a gradient of solid pressure
This force acts on all the particles contained in this volume. The number of molecules is given by:
p V Adx
(6) where is the volume fraction of the dispersion and Vp the volume of a particle.
The force acting on one particle is then given by the ratio of relationships (5) and (6):
dx d V f P
(7)
The dynamics of the concentration process is dependent on solid pressure via this force in a concentration gradient, a velocity or a diffusion coefficient (see box). The dynamics is then consequently a function of:
particle size
interparticle interactions which are dependent on: o surface properties (zeta potential),
o dispersal properties (ionic strength, ion specificity).
x
x+dx
f
(x+dx)
(x)
Box 1 : Solid pressure and its consequences in terms of force, velocity and diffusivity This force leads to a particle velocity being:
dx d V m mf up p (8)
where m is the mobility of the particle which is dependent on the volume fraction in concentrated dispersions according to:
) (
0K
m
m (9)
where m0 is the mobility of particles in dilute dispersion (1/(6a) for a sphere) and K() is the
hindered settling coefficient (which corresponds to the ratio of the settling velocity in concentrated to diluted conditions U()/U0). The function K can be usually estimated with the Happel [20] or the
Batchelor [21] functions. The velocity of particles induced by the omostic pressure gradient can be considered as diffusive mass transport, N, according to:
dx d d d mV u N p p (10)
Comparing this equation to Fick’s law, N D , it is possible to define a diffusion coefficient linked to the variation in osmotic pressure, , with the volume fraction, , by the generalized Stokes Einstein relationship [8]:
d d K kT V D D p b (11)where K() is the hindered settling coefficient, Db is the bulk diffusion coefficient (for infinite
dilution) and Vp the volume of the colloid. The generalized Stokes Einstein equation accounts for
hydrodynamic and thermodynamic interactions through K and respectively which depend strongly on volume fraction for concentrated dispersions. By using this relationship, the diffusion gradient coefficient corresponding to solid pressure variations can be deduced. The diffusion coefficient is constant for dilute dispersions (gas phase). On increasing the concentration, the diffusion gradient increases rapidly because of the concentration of particles in repulsive interaction (repulsion acts as compressed springs causing extensive collective diffusion of particles). In contrast, for higher volume fractions when attraction becomes important, the diffusion coefficient is reduced. Diffusion is reduced to zero when spinodal decomposition occurs (this nil value is synonymous of irreversibility: the mass cannot return naturally to the bulk by diffusion). In the solid phase, the diffusion coefficient defined by eq. 11 is similar to the concept of filtration diffusivity which plays the role of a diffusion coefficient for determining the time scale of filtration processes in consolidated porous media [15]. Such diffusion has been defined from compressional rheology studies according to the definition first given by Landman et al. 1995 [22] and developed by Sherwood et al. 1997 [23]:
d d kr D 1 (12)where is the compressive yield stress, k is a convenient pressure scale and r() may be thought of as a hindered settling factor or as a Darcy law constant for flow in porous media (according to the definition given in [22]). The generalized Stokes Einstein law (eq. 11) depicts the dynamic transport of colloids from the solid pressure in the solid phase (section 1.2.2.) like the concept of filtration diffusivity (eq. 13).
2 Modelling of solid pressure
The osmotic pressure (or solid pressure in the fluid phase) of a dispersion is usually modelled by a power law relationship:
crit if b p a kT V (13)
where the first term proportional to the number of particles (or to the volume fraction) is relative to Van’t Hoff relationship and the second term is relative to the increase induced by repulsive interactions between particles (a having positive values for stable repelling particles).
For volume fractions over the critical volume fraction, a typical law for compressive yield can be applied according to:
crit if m cp cp crit crit 1 1 1 (14)
However, relationships 13 and 14 do not depict the fluid-solid transition undergone by the dispersion at the critical volume fraction. This transition is theoretically indicated by a nil derivative of solid pressure with volume fraction (see section 1.2.3.).
To account for the transition, Gaussian fluctuations of the critical solid pressure around the critical point can be considered. The critical solid pressure is distributed around a mean value, crit and with
a standard deviation with a normal (or Gaussian) distribution characterised by the probability density function - pdf()-, or by the cumulative distribution function -cdf()-. These distribution functions are classically defined by the following equations:
2 2 2 2 1 ) ( crit crit e pdf crit (15)
pdf crit d crit cdf( ) ( ) (16)The probability density function (pdf) is the density of probability such as the probability that the critical solid pressure will be in the interval [a, b] which is given by the integral of this function between a and b. The pdf function can then give the probability of finding the critical solid pressure between two values. The cumulative distribution function (cdf) is then the probability that the critical solid pressure, crit, is less than or equal to a given osmotic pressure .
The probability of finding the fluid/solid transition occurring is linked to the probability of finding the critical solid pressure between the solid pressure and zero. The probability for this event is:
) 0 ( ) ( ) 0 ( cdf cdf p crit (17)
This probability is deduced from the solid pressure with a weighable factor leading to a nil derivative of ’ at the critical volume fraction (condition for a spinodal decomposition):
) ( ) 0 ( ) ( ' crit pdf cdf cdf (18)
This negative contribution to the solid pressure is physically linked to the attractive interactions which are the cause for the fluid/solid transition. The parameter in this model corresponds to the distribution of critical solid pressure around the mean value and can then be related to all the sources of heterogeneity within the colloidal system and to the metastability zone that precedes the spinodal decomposition.
It can be noted, that with such a model, the gradient diffusion coefficient resulting from the derivative of the solid pressure (see box 1) is given by:
) ( ) ( 1 crit p b pdf pdf d d kT V K D D (19) and consequently leads to a nil derivative when =crit.Such a model for the solid pressure depicts the experimental value of the solid pressure and accounts for the fluid-solid transition. Figure 4 illustrates the model of the experimental solid pressure obtained for latex particles. The model is fitted from a minimisation of the gap between the model and the experimental data by a least squares method1 using a, b, m and as variables and with a constraint on
the value of the mean critical solid pressure and the critical volume fraction given by experimental determination. The resulting parameters are given in table 1. This model of solid pressure will be used in the next sections to describe the concentration process by filtration (dead end or cross flow), by sedimentation or centrifugation or by drying.
Table 1 : Parameters of the model (eq. in section 2) for solid pressure plotted in figure 4 latex 10-3 M latex 10-2 M R 4.00E-08 4.00E-08 Vp 2.6808E-22 2.6808E-22 a 8.04E+05 1.39E+07 b 6.67 13.1 m 0.2738564 0.25317859 5000 5000
3 Description of concentration process
It is possible to concentrate a dispersion by:o exerting an external force on particles by sedimentation or centrifugation
o extracting the fluid through a filter or a membrane (filtration) or at a gas-liquid interface by evaporation (drying processes)
All these processes are controlled by the properties of particles in the dispersion [24] and in the materials (gel, deposit) created during the concentration process. The solid pressure depicts the behaviour of interacting particles over the whole concentration range (as mentioned in the previous section) and can be used (as presented in next section) to describe the concentration gradient existing during the concentration processes (driven by the filtration rate, gravity or the evaporation rate for filtration, sedimentation and drying respectively).
3.1 Filtration
During a filtration, an equilibrium is reached if the permeation drag force, J/m, is balanced by the force for dispersion introduced in eq. 7:
0 m J dx d VP (20)
This equation can be similarly seen as a flux balance or the application of Darcy law as discussed in box 2. It leads to a relationship where the local differential Péclet number (given for a distance to the membrane) is linked to the solid pressure:
K d kT V D Jdx p b ) ( (21) 21
0
J
p
d
dp
b
bp
(induced by the permeate flux J over a distance dx) and the second term concerns the energy relative to the resistance at the over concentration induced by dispersion forces (both terms being normalized by kT). Such an equation can be used to describe the accumulation in the polarised layer near the membrane surface.
Box 2 : A single law to depict a force balance, a flux balance and the Darcy law
The relationship to depict the equilibrium during filtration is established with a force balance in eq. 20. However, it has to be noted that the same relationship can be obtained by considering the equilibrium in terms of flux with the classical convective-diffusive flux balance:
0 ) ( dx d D J (22)
which establishes a balance between a convective flux, J, and a diffusive flux. By writing the diffusion gradient as in box 1 it can easily be demonstrated that eq. 22 can be written as a function of the solid pressure as in eq. 21.
Furthermore, the velocity of the flow through the porous media under a pressure gradient is given by the Darcy law:
dx dp k J (23)
In a porous medium (here relative to the network of particles accumulated on the membrane), if the flow is sufficiently slow the forces acting on the particles and on the liquid are in equilibrium leading to the sum of the pressure of the liquid and the solid pressure being constant [23]:
cons t dp d p tan (24)
Such an approach, considering the balance between the permeation drag force and the force due to the pressure loss in the deposit, leads to the following relationship between the deposit permeability k and the hydrodynamic coefficient K () [25]:
mVp K a k 9 2 2 (25)According to Eq. 24 and 25, the Darcy law (eq. 23) can then be rewritten as in eq. 20.
At this point, it is interesting to note that very different kinds of balance (drag and dispersion force, convective and diffusive flux, permeation and compression) lead to the same equation. The solid pressure then offers a unique way to depict these equilibria and to account for the properties of the solid (in terms of force of dispersion, diffusivity or compressibility) during concentration processes.
3.1.1 Dead end filtration
During dead end filtration, the accumulated layer is continuously growing. In order to rigorously depict the accumulation, the transient expression for flux balance should be considered:
0 N t (26) However, it has been shown [26] that numerical simulation of the transient equation from eq. 26 leads to the same results in the conventional range of filtration, microfiltration and ultrafiltration as a pseudo-stationary model considering successive equilibrium states over time.
In these conditions, the evolution of the accumulated volume of particles (here in m3 of particles per
m2 of surface area) should be considered with time by assuming that the whole quantity of particles
brought by permeation, J, accumulates at the surface:
f b t b a dx Jdt V V
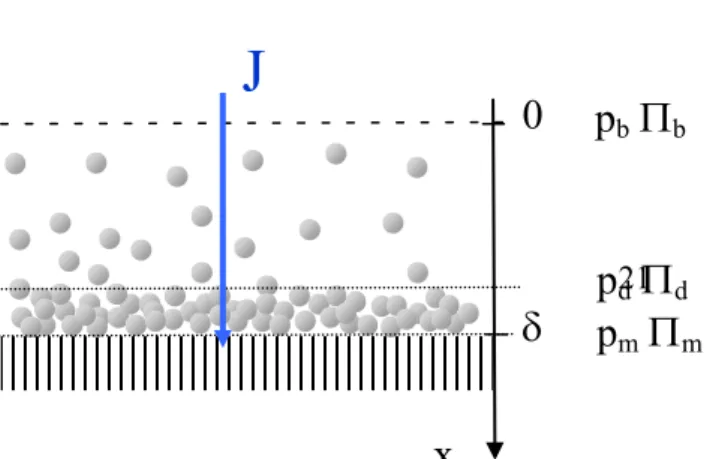
0 0 (27)By considering a succession of equilibria with time, eq. 20 can be integrated through this accumulated volume (i.e. from the solid pressure in the bulk, b, to the solid pressure at the membrane, m)
according to:
m b d K kT V D JV Pe a p de ( ) 0 (28)where the Péclet number here indicates the energy dissipated by friction on all the particles accumulated during the filtration of a volume of liquid equivalent to the particle volume, 6aJVa,
over the thermal energy, kT. The numerator of this equation corresponds to the energy relative to the force undergone by the particle near the membrane surface: the particle undergoes the sum of drag forces undergone by all the particles accumulated above the membrane [27] considering that the particles are stopped by the membrane and that they transmit their force through repulsive interactions from the top to the bottom layers. The Péclet number increases when filtration conditions are more severe because of an increase in flux, an increase in volume fraction or in filtration time.
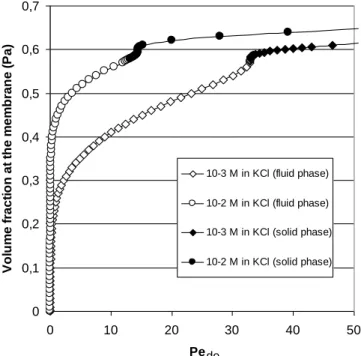
Knowing the properties in terms of solid pressure of the colloidal or nanoparticle dispersion, it is then possible to estimate the consequences of the Péclet number (and thus the filtration conditions) on the solid pressure of the materials at the membrane surface. Figure 8 represents the increase in volume fraction at the membrane resulting from an increase of the Péclet number. A more rapid increase in volume fraction at the membrane is observed for the latex dispersion with the higher ionic strength (lower stability). This result is linked to the fact that the increase in ionic strength reduces the repulsive interaction between particles. It leads to a network of particles at the membrane surface presenting less resistance to concentration. Similarly, it should be noted that the Pe number for which a solid phase is formed at the membrane surface is lower for less stable dispersions: these critical Pe number are 32.9 and 13.5 for the latex dispersion at 10-3 M and 10-2 M respectively in KCl.
0 0,1 0,2 0,3 0,4 0,5 0,6 0,7 0 10 20 30 40 50 PeS V o lu m e f ra c ti o n a t th e m e m b ra n e ( P a ) 10-3 M in KCl (fluid phase) 10-2 M in KCl (fluid phase) 10-3 M in KCl (solid phase) 10-2 M in KCl (solid phase)
Figure 8: Volume fraction at the membrane versus the Pe number, Pede. Calculations were done with equation
28 and for the latex dispersion presented in section 2. The bulk volume fraction is taken at 0.00001. de
3.1.2 Cross-flow filtration
In cross-flow filtration, when the stationary state is reached, accumulation takes place in a mass boundary layer with a fixed thickness with time at a given position along a membrane. In more complex situations, the thickness can change along the length of the membrane. The accumulation can then be depicted through the equilibrium introduced in eq. 21 integrated through the boundary layer thickness (according to the boundary conditions introduced in figure 7):
m b d K kT V D J Pecf p () 0 (29)where the first term of this equation is relative to a Peclet number which represents the energy dissipated by friction on a particle during the filtration of a volume of liquid, covering length over the thermal energy. It has to be noted that the ratio Pede/Pecf (given by eq. 28 and 29) is representing
the ratio of Va/ which is the mean volume fraction in the polarised layer.
This Péclet number is linked to the resistance to concentration induced by dispersion forces taking into account the solid pressure (last term of eq. 29). A figure similar to that obtained for Pede (figure 8) can
be plotted for Pecf. It the same way, the existence can then be noted of a critical Péclet number that
will lead to the formation of a solid at the membrane surface. Calculations give Pecf at 87.8 and 36.1
for the latex dispersion at 10-3 and 10-2 M respectively in KCl.
3.2 Concentration by sedimentation and centrifugation
As already discussed [28], during sedimentation or centrifugation, the balance between gravity (or centrifugal force) and diffusion lead to an equilibrium which can be described by the following relationship: 0 ) ( dx d D used (30) where the mass flux induced by the centrifugation velocity, used, is
counterbalanced by diffusion. As for filtration, this equilibrium can also be written by taking into account the solid pressure through eq. 11 leading to: 0 ) ( dr d V g Vp p w p
(31) where the first two terms represent the net force acting on the particle (the difference between the gravitational force and the buoyancy force: p and w being the density of the particle and the
water respectively) and the second term is the force resulting from the solid pressure gradient (thermodynamic force).
This equilibrium allows the classical Pe number to be introduced for sedimentation according to:
bot d kT V kT r r g V Pesed p p w bot p int int ) ( (32) Likewise, the equilibrium in a centrifugal force field can be depicted:
bot d kT V kT r r w V Pecentrif p p w bot p int 2 int 2 2 ) ( (33) where w is the angular rotation speed.
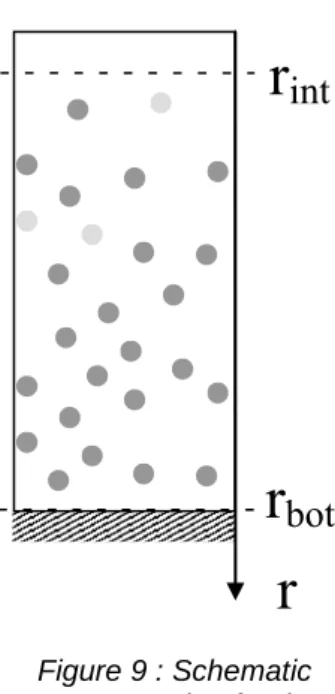
r
r
int
r
bot
Figure 9 : Schematic representation for the
sedimentation or centrifugation process.
3.3 Concentration during the drying process
During a drying process, water is extracted from the dispersion at the liquid/gas interface, selectively concentrating the particles. A gradient of concentration through the thickness of the drying film then appears. The over-concentration at the film-air interface can induce skin formation. Comprehensive modelling [29] has shown the importance of the evaporation rate on the processes of film formation. During film formation, if the particle velocity induced by natural convection is negligible, the particles in the film are only submitted to the force induced by the solid pressure gradient (diffusion transport). The flux of particles in the system can then be written as:
dx d mV
N p (34) The local volume fraction of solid, , satisfies the mass conservation equation:
0 N t (35)
By assuming a pseudo-steady state regime, the mass conservation equation in the steady state can be considered to lead to a constant flux of particles: dx d mV N p constant (36) At the free surface, the evaporation of water (where the evaporation rate h is expressed in m3/(m2.s)) leads to the removal of water while
the particles stay in the film. Per volume of liquid extracted, the volume of particles remaining in the film is /(1) which represents the solid ratio (ratio of solid volume over liquid volume). Assuming a constant evaporation rate, evaporation contributes to an influx of particles at the free surface:
e x e x e x h N 1 (37)
The mass conservation equation then leads to:
0 1 e x e x p dx h d mV (38)
During drying, the volume of accumulated particles, Va, (here in m3 of particles per m2 of surface area)
represents the excess of particles induced by the reduction of film thickness from e0 to e:
e e
Va 0 0 (39)
where 0 is the initial volume fraction of particles in the film. Assuming that for the initial stage of
drying the volume fraction near the substrate is always close to the initial volume fraction, x0 b, integrating eq 38 throughout the volume of accumulated particles in the film leads to:
i b d K T k V D e e h Pe B p e x e x dry ( ) 1 0 0 0 (40) where the Péclet number (similar to the one defined in [30]) links the drying operating conditions to the dispersion properties. This simplified approach is valid only when the zone where the polarization occurs is thinner than the total film thickness, e, i.e. for the first step of drying (as confirmed by the calculation in section 5.3). When the polarisation layer and the film thickness are of the sameEvaporation x
0 e(t)
Figure 10 : Schematic representation of the drying
4 Pe number and concentration processes
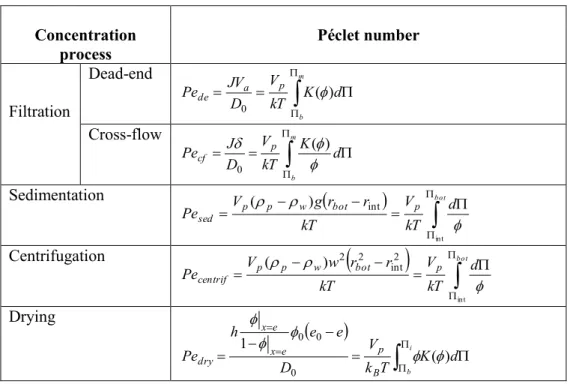
As demonstrated in the previous section, the concentration processes can be depicted by means of the Péclet number which links the operating conditions of the concentration processes to the properties of the material being concentrated (table 2). By definition, the Péclet number is the ratio between the acting force leading to the concentration processes (J the filtrate flux for filtration, g gravity for sedimentation, w rotation during centrifugation, h the evaporation rate during drying) and the dispersing force (Brownian diffusion).
force diffusion the of energy ion concentrat the for force acting the of energy Pe (41)
These process operating conditions are linked to the properties of the dispersion which are the solid pressure, , and the sedimentation coefficient, K, integrated from the bulk volume fraction to the interfacial volume fraction (at the membrane surface for filtration, at the bottom of the tube for centrifugation and sedimentation or the gas/liquid interface for drying). It can be noted that for sedimentation and centrifugation equilibrium the sedimentation coefficient, K, does not appear in the Peclet number: during these operations, when equilibrium is reached there is no relative displacement between particles and the liquid phase.
For an ideal solution (i.e. at low concentration when multi-body interactions are negligible), the sedimentation coefficient is around unity (K->1) and the solid pressure, , follows the Van’t Hoff law. The integrals can then be simplified to a form involving the constant diffusion coefficient. For instance, in cross-flow filtration this simplification leads to the classical film model where the permeate flux varies with the logarithm of the ratio of the concentration at the membrane to the concentration in the bulk.
Table 2: Péclet numbers describing the mass transfer equilibrium under different concentration processes
Concentration process Péclet number Filtration Dead-end
m b d K kT V D JV Pe a p de ( ) 0 Cross-flow
m b d K kT V D J Pecf p () 0 Sedimentation
bot d kT V kT r r g V Pesed p p w bot p int int ) ( Centrifugation
bot d kT V kT r r w V Pecentrif p p w bot p int 2 int 2 2 ) ( Drying
i b d K T k V D e e h Pe B p e x e x dry ( ) 1 0 0 0 The variation of the Pe number with the solid pressure and the volume fraction is illustrated in figure 11 plotting, in a double graph, the variation of solid pressure with the volume fraction (for the dispersion of latex particles in 10-3 M KCl in the right plot) and the solid pressure versus Pe number
(in the left plot). The left graph can be considered as representing operative functions (which are a general description of mass balance in each processes) and the right graph the equation of state of the dispersed matter (an equilibrium property of the dispersion of colloids or nanoparticles).
Figure 11: Evolutions (in the right sector) of the solid pressure, , with the volume fraction, , for the dispersion of latex particle in KCl 10-3 M and (in the left sector) of the solid pressure versus the Pe number for different
concentration processes (b for this calculation is taken at 10-4)
Such a representation can be used to determine the Péclet number required for compression from an initial concentration to the interfacial concentration. For example, the Pe number needed to increase the concentration from an initial value of 0.001 to an interfacial value of 0.5 can be given by the difference of Pe number for each of these concentrations as represented by the dashed lines in Figure 11. Compression of this type occurs for Péclet numbers of Pe dry = 150, Pede= 367, Pecf = 981 and Pesed or centrif = 19 400. These values represent the energy (in terms of kT) of the acting force required to
compress the dispersion to a volume fraction of 0.5 at a given point in the process. It can be seen that for a low volume fraction (ideal dispersion without interaction), the energy to compress dispersion layers becomes greater with sedimentation, centrifugation and cross-flow whereas for a large volume fraction (highly interactive particles) cross flow becomes a more “economic” way to compress layers than dead-end filtration. These values can then help to determine the operation conditions (for example in terms of acting force) relative to the concentration process but also to determine the conditions for which the critical volume fraction is reached locally in the process.
5 Critical conditions of concentration processes
The Péclet numbers introduced in the previous section allow us to define critical Péclet numbers that lead to the appearance of a solid at the surface (i.e. when the solid pressure at the membrane reaches
0.01 1 100 10000 1000000 0.001 0.1 10 1000 100000 10000000 Péclet Number ( P a ) cross flow filtration sedimentation or centrifugation dead-end filtration drying Série5 Série6 0.0010.001 0.01 0.1 1
the irreversibility of the liquid-to-solid transition (spinodal decomposition) which can have various consequences on the way concentration processes work as illustrated in figure 12 and analysed in the next section.
Deposit
during filtration
Sediment during
centrifugation
Skin formation
during drying
xg
Figure 12: Critical conditions of concentration a) during filtration with formation of a deposit b) during centrifugation with formation of sediment c) during drying with formation of a skin
5.1 Critical conditions of filtration
In dead-end filtration, the critical Pe number results from a combination between the permeate flux, J and the accumulated volume of particles, Va (table 2). Va is dependent on the filtered volume, Vf (and
thus on filtration time), according to equation 27. The critical conditions are linked to the accumulated volume because a particle at the membrane surface supports all the drag that the permeate flux exerts on particles in the polarized layer. Accumulation then leads to the aggregation of the particles near the surface. Figure 13a indicates the values of the pair “permeate flux/filtered volume” for which the solid phase is formed (or not formed) at the membrane surface. No solid phase is formed for conditions of low permeate flux and low filtered volume. These conditions are more restrictive for less stable dispersions (i.e. for 10-2 M in KCl).
Figures 13 a and b: Representation of operation conditions leading to the presence or to the absence of solid phase at the membrane for dead-end a) and cross-flow b) filtration. Conditions are dependent
on the permeate flux, J and the filtered volume Vf in dead-end filtration and on the permeate flux and
the cross-flow velocity in cross-flow filtration.
In cross-flow filtration, the formation of a solid phase at the membrane surface is linked to the production of the permeate flux and the boundary layer thickness according the critical Pe number, Pecf (eq. 29). The absence of solid phase is favoured for conditions of low permeate flux and for low
boundary layer thickness. Low boundary layer thickness corresponds to conditions of high cross-flow velocity. The classical Leveque relationship has been used to link the boundary layer thickness to the cross flow velocity (by considering a tubular membrane device with a diameter of 6 mm and a length of 1.2 m using the dispersion data given in previous sections). Figure 13b reports the conditions in permeate flux, J and cross-flow velocity for which a solid phase exists on the membrane (conditions of high flux and low cross-flow velocity) or in contrast the conditions for which no solid phase forms.
sub-critical
filtration
over-critical
filtration
sub-critical
filtration
over-critical
filtration
dead-end filtration
cross-flow filtration
Figure 14 : Application of critical filtration conditions to the determination of sub-critical filtration in dead-end and cross-flow filtration modes avoiding the formation of solid phase at the membrane. These critical conditions allow filtration with no solid phase formation at the membrane (which are
0 0.1 0.2 0.3 0.4 0.5 0 5 10 15 20 J (10-6 m /s) u ( m /s ) 10-2 M in KCl 10-3 M in KCl Formation of solid phase at the membrane No solid phase formation at the membrane 0 1 2 3 4 5 0 5 10 15 20 J (10-6 m /s) V f (m 3 /m 2 ) 10-2 M in KCl 10-3 M in KCl Formation of solid phase
at the membrane
No solid phase formation at the membrane
filtration time) allows successive filtration and rinse steps without solid phase formation at the membrane.
In actual process applications, however there can be uneven distribution of permeate flux (locally on the membrane) and also, under cross-flow conditions, inhomogeneities in boundary layer thickness because of the progressive build up of material along the membrane surface [33]. Because of these heterogeneities, solid phase can form locally even if the mean conditions are sub-critical.
5.2 Critical conditions in sedimentation or centrifugation
For batch sedimentation or centrifugation, eq. 33 has to be solved with global mass balance over the sedimentation or centrifuge cell:
bot r r bot init r r dr int int (41)Eq. 32 and 41 allow the concentration profile to be determined along the cell. Figure 15 represents the evolution of the volume fraction along the centrifuge cell (rint=0.1 m and rbot=0.15 m) for different
rotation speeds in rpm. The different rotation speeds: 100, 500 and 1000 rpm correspond to 16 g, 410 g and 1600 g respectively. The volumic mass is taken to be 1300 kg/m3 for the particles and 1000
kg/m3 for water. The initial volume fraction of the dispersion is 0.01.
0 0.1 0.2 0.3 0.4 0.5 0 0.001 0.002 0.003 0.004 0.005
Distance from the bottom of the tube (m)
V o lu m e f ra c ti o n ( -) 10-3 M in KCl at 100 rpm 10-3 M in KCl at 500 rpm 10-2 M in KCl at 1000 rpm 10-2 M in KCl at 100 rpm 10-2 M in KCl at 500 rpm 10-2 M in KCl at 1000 rpm
Figure 14: Particle concentration profiles during centrifugation of latex particles.
It can be seen that the more stable latex particles, dispersed in 10-3 M KCl, (round symbols) are less
compressed than the those dispersed in 10-2 M in KCl (triangles). The repulsive electrostatic interaction, more pronounced in stable dispersions, leads to greater resistance to compression induced by the external force field.
The centrifugal force can overcome the repulsion between particles (which is responsible for the dispersion) when a critical value for the rotation speed is exceeded. This happens when the critical value of the Pe number is reached:
crit crit d kT V Pecentrif p int (42)
These critical values are 1.2 10+5 and 9.6 10+4 for the latex dispersion at 10-3 and 10-2 M respectively in
more stable the dispersion, the higher the centrifugal rotation speed required to collapse the particles at the bottom of the cell and to form a sediment. If this speed is not reached, the diffusion induced by repulsive interaction between particles will lead to a redispersion of the particles on withdrawal of the centrifugal force . 5200 5400 5600 5800 6000 6200 6400 6600 6800 C ri ti c a l v a lu e f o r th e c e n tr if u g a l ro ta ti o n s p e e d ( rp m ) 10-3 M in KCl 10-2 M in KCl
Figure 16: Critical value for the rotation speed during centrifugation leading to the formation of a sediment.
5.3 Critical conditions in drying
Solving equation 40 gives the vertical concentration gradient in the film during drying. Figures 17 present the evolution of the volume fraction profile with time during drying of a film (initial volume fraction of particles 0.05 and initial thickness 2 mm) of a dispersion of latex in 10-3 M KCl (Figure
17a) and in 10-2 M KCl (Figure 17b). These calculations were performed for the first step of the drying
process in order to satisfy the assumption made in the simplified model presented in section 3.3 and to avoid taking into account the increase in ionic strength induced by the concentration of the film. The calculations were stopped when the critical volume fraction was reached: the model is based on a constant evaporation rate and does not take account of the reduction in evaporation rate induced by skin formation at the interface.
0 0.1 0.2 0.3 0.4 0.5 0.6 0.7 0 0.0005 0.001 0.0015 0.002 e (m) t=150 s t=300 s t=420 s t=550 s 0 0.1 0.2 0.3 0.4 0.5 0.6 0.7 0 0.0005 0.001 0.0015 0.002 e (m) t=300 s t=600 s t=900 s t=1200 s 10-2 M in KCl 10-3 M in KCl
For dispersion of particles exhibiting high repulsive interactions in 10-3 M KCl, the volume fraction at
the interface increases more slowly than for particles with less repulsive interactions (dispersed in 10-2
M KCl). These results clearly show that the dynamics of concentration by drying is controlled by the solid pressure of the dispersion: stabilized particles resist the concentration process as already mentioned for filtration or centrifugation.
The main consequence on the process is that the formation of a skin at the interface will occur later for stable dispersions (after 1200 s for dispersions in 10-3 M KCl and after 550 s for dispersions in 10-2 M
KCl). Recent experiments [34] clearly show that operating with destabilized dispersions (under the critical coagulation concentration - ccc - i.e. without aggregation) led to the formation of skin (that dramatically reduced the evaporation rate) more quickly during the drying (salt-induced skin formation). In contrast, if the addition of salt leads to particle aggregation (above the ccc), the consequences on skin formation are the opposite: the aggregation leads to settling of the particles toward the substrate thus limiting skin formation at the gas/liquid interface.
Skin formation occurs when the volume fraction at the interface reaches its critical value:
crit b critical kT K d V D e e h Pe crit p crit dry ( ) 1 0 0 0 (43) The critical values for the latex dispersions are 14.6 at 10-3 M KCl and 7.0 at 10-2 M KCl. Thesecritical conditions result from a critical pair of operating conditions given by the evaporation rate, h, and 0(e0-e) which is the product of the initial concentration with the film thickness reduction (or the
0 0,00005 0,0001 0,00015 0,0002 0 0,5 1 1,5 2 h (10-6 m/s) 0 (e 0 -e ) (m ) 10-2 M 10-3 M Skin formation No skin formation
Figure 18: Representation of the critical pair of drying operating condition leading to skin formation. Skin formation is favoured for high evaporation rates, h, and high values of the term 0(e0-e) (i.e. for example for
high initial concentrations in the film). Destabilisation of the dispersion favours the operating conditions where skin formation occurs.
Figure 18 presents the range of operating conditions where skin formation will occur at the interface. It can be seen that the conditions where skin formation will not occur is favoured:
when drying more stable dispersions (particles in 10-3 M KCl); when drying a dilute dispersion (low initial volume fraction, 0);
when operating at low evaporation rates;
when the volume of water evaporated per interface area (e0-e) does not exceed a critical value.
The approach proposed here allows these drying regimes to be quantified from the properties of the dispersion in terms of solid pressure.
6 Conclusion
The description of the concentration processes in colloidal or nanoparticle dispersions (filtration, centrifugation, drying) has to take into account the presence of surface interactions between entities (electrostatic repulsion, Van der Waals attraction, etc.) as they play a key role among transport phenomena. This source of complexity can be depicted through the concept of solid pressure. Solid pressure can be considered as the equation of state for the solid matter (particles or macromolecules) in the liquid. The solid pressure is considered as a combination of the osmotic pressure (for the dispersed state of matter) and the compressive yield stress (for the condensed state of matter at higher concentrations). This equation of state is at the base of the description of phase transitions in colloidal or nanoparticle dispersions, induced by surface interactions. This chapter shows how the solid pressure can be used to depict the dynamics of the concentration processes. The model demonstrates the existence of critical operating conditions during the concentration process which lead to the formation of a condensed phase on a membrane (fouling during filtration), at the bottom of a centrifugal cell
7 References
[1] V.J. Anderson, H.N.W. Lekkerkerker, Insights into phase transition kinetics from colloid science, Nature, 416, 6883: (2002) 811-815.
[2] A.S. Jönsson, B. Jönsson, Ultrafiltration of colloidal dispersions – A theoretical model of the concentration polarization phenomena, J. Colloid Interface Sci., 180 (1996) 504-518
[3] W.B. Russel, D.A. Saville, W.R. Schowalter, Colloidal Dispersions, Cambridge University Press, Cambridge (1989).
[4] P. Bacchin, M. Meireles, P. Aimar, Modelling of filtration : from the polarised layer to deposit formation and compaction, Desalination, 145,139-147 (2002)
[5] M. Dubois, M. Schönhoff, A. Meister, L. Belloni, T. Zemb, H. Möhwald, Equation of state of colloids coated by polyelectrolyte multilayers, Physical Review E 74, 051402 (2006)
[6] H. R. E. Kruyt, Colloid Science _Elsevier Press, New York, 1952.
[7] Y. H. Tsao, D.F. Evans, R.P. Rand, V.A. Pargesian, Osmotic stress measurements of
dihexadecyldimethylammonium acetate bilayers as a function of temperature and added salt, Langmuir 9, (1993) 233-241.
[8] R. Podgornik, H. H. Strey, V. A. Parsegian, Molecular Interactions in Lipids, DNA, and DNA-lipid Complexes _Marcel Dekker, Inc., New York, NY, 2000.
[9] L. J. Michot, I. Bihannic, K. Porsch, S. Maddi, C. Baravian, J. Mougel, P. Levitz, Phase diagrams of Wyoming Na-montmorillonite clay. Influence of particle anisotropy, Langmuir, 20, (2004) 10829-37. [10] C.Bonnet-Gonnet, L.Belloni, B.Cabane, Osmotic pressure of latex dispersions, Langmuir, 10,11 (1994),
4012-21.
[11] B. Espinasse, P. Bacchin, P. Aimar, Filtration method characterizing the reversibility of colloidal fouling layers at a membrane surface: Analysis through critical flux and osmotic pressure, Journal of Colloid and Interface Science, 320 (2008) 483–490.
[12] P. Bacchin, D. Si-Hassen, V. Starov, M.J. Clifton, P. Aimar, A unifying model for concentration polarization gel-layer formation and particle deposition in cross-flow membrane filtration of colloidal suspensions, Chem. Eng. Sci., 75 (2002) 77-91
[13] GM Channell, CF Zukoski, Shear and compressive rheology of aggregated alumina suspensions AIChE J., 43, 7, (1997) 1700-1708
[14] R.Buscall, L.R. White, The consolidation of concentrated suspensions. Part 1.- The theory of sedimentation, J. Chem. Soc. Faraday Trans., 83, (1987) 873-891
[15] KA Landman, JM Stankovich, LR White, Measurement of the filtration diffusivity D(phi) of a flocculated suspension, AIChE J., 45, 9 (1999) 1875-1882.
[16] K.A. Landman and L.R. White, Determination of the hindered settling factor for flocculated suspensions, AIChE J., 38 (1992) 184-192.
[17] C. Martin, F. Pignon, A. Magnin, M. Meireles, V. Lelièvre, P. Lindner, B. Cabane, Osmotic Compression and Expansion of Highly Ordered Clay Dispersions,Langmuir, 22 (2006) 4065 -4075
[18] D. Carrière, M. Page, M. Dubois, T. Zemb, H. Cölfen, A. Meister, L. Belloni, M. Schönhoff, H. Möhwald, Osmotic pressure in colloid science: clay dispersions, catanionics, polyelectrolyte complexes and polyelectrolyte multilayers Colloids and Surfaces A: Physicochem. Eng. Aspects 303 (2007) 137–143 [19] A. Mourchid, E. Lecolier, H. Van Damme, P. Levitz, On viscoelastic, birefringent, and swelling
properties of Laponite clay suspensions : revisited phase diagram, Langmuir, 14 (1998), 4718-4723 [20] J. Happel Viscous flow in multiparticle systems, slow motion of fluids relative to beds of spherical
particles. AIChE J., 4 (1958), 197,
[21] G. K. Batchelor, Brownian diffusion of particles with hydrodynamic interactions. J. Fluid. Mech. 74, (1976) 1–29.
[22] KA Landman, LR White, M Eberl. Pressure filtration of flocculated suspensions." AIChE J., 41 (1995) 1687-1700
[23] J.D. Sherwood, Initial and final stages of compressible filtercake compaction, AIChE J., 43 (1997) 1488-1493
[24] D. N. Petsev, V. M. Starov, I. B. Ivanov, Concentrated dispersions of charged colloidal particles: Sedimentation, ultrafiltration and diffusion, Colloids and Surfaces A: Physicochemical and Engineering Aspects, 81, 13 (1993), 65-81
[25] A.A. Zick, GM. Homsy, Stokes flow through periodic arrays of spheres, J. Fluid Mechanics, 115 (1982) 13-26.
[26] Y. Bessiere, Filtration frontale sur membrane: mise en évidence du volume filtre critique pour l’anticipation et le contrôle du colmatage, Thèse de l’Université Paul Sabatier, Toulouse, 2005.
[27] P. Harmant, P. Aimar, Coagulation of colloids in a boundary layer during cross flow filtration, Colloids Surf. 138 (1998) 217–230.
[28] K.E. Davis, W.B. Russel, An asymptotic description of transient settling and ultrafiltration of colloidal dispersions, Physics of fluids. A, 1 (1989) 82-100
[29] A.F. Routh, W.B. Russel, Horizontal drying fronts during solvent evaporation from latex films,AIChE Journal,44 (2004) 2088-2098.
[30] A.F. Routh, W.B. Russel, A process model for latex film formation: limiting regimes for individual driving forces, Langmuir, 15 (1999) 7762-7773.
[31] P.Bacchin, P. Aimar, R. Field, Critical and substainable fluxes : theory, experiments and applications, Journal of membrane science, 281, (2006), 42-69
[32]
Y. Bessiere, N. Abidine, P. Bacchin, Low fouling conditions in dead end filtration : evidence for a critical filtered volume and interpretation using critical osmotic pressure, Journal of membrane science, 264, 1-2, (2005), 37-47
[33]
P. Bacchin, B. Espinasse, P. Aimar, Distributions of critical fouling conditions: modelling, experiments analysis and consequences for cross flow membrane filtration, Journal of Membrane Science, 250, 1-2, (2005) 223-234
[34] S. Erkselius, L. Wadsö, O.J. Karlsson, Drying rate variations of latex dispersions due to salt induced skin formation,Journal of Colloid and Interface Science, 317 (2008) 83–95