Journal of Fundamental and Applied Sciences is licensed under aCreative Commons Attribution-NonCommercial 4.0 International License.Libraries Resource Directory. We are listed underResearch Associationscategory.
Laboratory of Thermal and Renewable Energies, Department of Physics, Unit of Training and Research in Pure and Applied Sciences, University Joseph KI-ZERBO of Ouagadougou, PO
Box 7021 Ouagadougou, Burkina Faso
Received: 27 December 2016 / Accepted: 28 April 2017 / Published online: 01 May 2017
ABSTRACT
In this work, a modeling study of the effect of the junction quality on the performance of a silicon solar cell is presented. Based on a one dimensional modeling of the solar cell, the continuity equation of excess minority carriers is solved with boundary conditions taking into account the intrinsic junction recombination velocity and led to analytical expressions of photocurrent density, photovoltage and electric power. The effect of the intrinsic junction recombination velocity or the solar cell junction quality on photocurrent, photovoltage and electric power, is exhibited and we determine the maximum electric power, the junction dynamic velocity at the maximum power point and the conversion efficiency according to the junction quality of the solar cell. From the electric power lost at the junction, we calculated the shunt resistance of the solar cell according to the junction quality.
Keywords: Efficiency; Intrinsic junction recombination velocity; Joule effect; Solar cell;
Shunt resistance.
Author Correspondence, e-mail:izerbo@hotmail.com doi:http://dx.doi.org/10.4314/jfas.v9i2.26
1. INTRODUCTION
The characterization of the minority carriers’ recombination parameters such as carriers
diffusion length L, back surface recombination velocity Sb and intrinsic junction recombination velocity Sf0 is important to design any solar cell device because the recombination of the photogenerated charge carriers limits the solar cell's performance [1]. Among all of these parameters, the intrinsic junction recombination velocity Sf0 related to interface states characterizes the losses of excess minority carriers at the solar cell emitter-base junction. The intrinsic junction recombination velocity Sf0 is an electronic parameter that accounts for the losses of carriers at the solar cell junction therefore so it characterizes the quality of the junction emitter-base [2]. Some authors [3-5] proposed and used experimental method to extract solar cell's intrinsic junction recombination velocity Sf0. The aim of this paper is to show how intrinsic junction recombination velocity Sf0can affects the performance of a silicon solar cell. From the continuity equation, we calculated the density of excess minority carriers in the base and with the associate photocurrent and photovoltage across the junction. The electric power is then derived and its dependence on intrinsic junction recombination velocity Sf0 or junction quality is discussed. The solar cell's maximum electric power and the corresponding junction dynamic velocity at the maximum power point are deduced from the electric power curves versus junction dynamic velocity, and then the conversion efficiency of the solar cell is calculated. From the electric power lost by Joule effect at the junction, we calculated the shunt resistance of the solar cell for various intrinsic junction recombination velocity Sf0.
2. THEORY
2.1. Density of excess minority carriers
A polycrystalline back surface field silicon solar cell, presented in figure 1, is studied under multispectral illumination and in the quasi-neutral base assumption [6, 7].
Fig. 1. Silicon solar cell illuminated by multispectral light
When the silicon solar cell is illuminated with a multispectral light, the solution of the continuity equation of excess minority carriers is:
3 1 2 1 i i b i n n x e K L x sh A L x ch A x (1) With 1 2 2 1 n i n i i L b D a KThe constants Ln and Dn are respectively electrons diffusion length and diffusion coefficient. Coefficients ai and bi are tabulated values of the generation rate for solar radiation spectrum under Air Mass 1, 5 standard conditions [8].
For a complete determination of the density of excess minority carriers, constants A1 and A2 must be determined by solving the two boundary conditions:
- At the junction emitter-base (x = 0)
0 x Sf x x D 0 x n (2)- At the rear side of the solar cell (x = H)
H x Sb x x D H x n (3)Sf is the junction dynamic velocity and it is the sum of two contributions: the intrinsic junction recombination velocity (Sf0) and the junction dynamic velocity (Sfj) imposed by an external load resistance and which defines the operating point of the solar cell [7].
j Sf Sf
Sf 0 (4)
For an ideal solar cell the losses of carriers at the junction interface are neglected and so that the intrinsic junction recombination velocity (Sf0) is null. In this case, in open circuit (Sf tends to zero) there is no current flux that crosses the junction because carriers are stocked on both sides of the junction while in short circuit (large values of Sf, Sf ≥ 106cm.s-1), all the carriers collected at the solar cell's junction cross this junction [7]. But for a real solar cell, in open circuit state (Sfjtends to zero), there is a current flux but it is drifted in the shunt resistance of the solar cell and carriers are lost at the junction. This current that is lost because of interface phenomena is a leakage current and is represented by an electronic parameter which is the intrinsic junction recombination velocity (Sf0). Conversely, in short circuit condition (Sfjtends to large values , Sfj ≥ 106 cm.s-1), the current flux imposed by an external load resistance characterized by the electronic parameter (Sfj) called junction dynamic velocity [7] is higher
than the current lost at the solar cell’s junction.
Sb is the effective back surface recombination velocity and it quantifies the losses of carriers at the solar cell's rear side.
2.2. Photocurrent densities
From Fick's law applied at the solar cell junction, one can derive the expression of the total photocurrent density that the solar cell can produce.
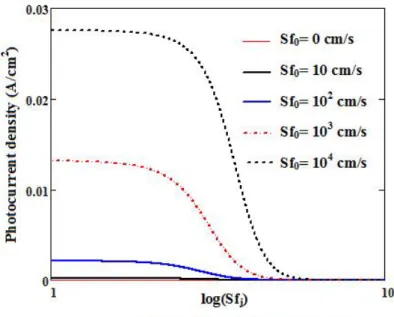
x ) , (x, , 0 0 x 0 Sf Sf D q Sf Sf Jph j n j (5)We present in figure 2 a plot of the total photocurrent density curves versus junction dynamic velocity (Sfj) for various intrinsic junction recombination velocity.
Fig. 2. Total Photocurrent density versus junction dynamic velocity for different values of
intrinsic junction recombination velocity (L=0.02cm; H=0.03cm;D=26cm2/s)
We observe on the curves in figure 2 that, taking into account or no of intrinsic junction recombination velocity don't have any influence on the short circuit photocurrent (large values of Sfj). Curves in figure 2 show also that, without intrinsic junction recombination velocity, the open circuit photocurrent (corresponding to small values of Sfj) is null. But if we take into account the intrinsic junction recombination velocity, the open circuit photocurrent is not null. The open circuit photocurrent, also called leakage photocurrent, is proportional to the intrinsic junction recombination velocity and evolves towards the value of short circuit photocurrent for large values of intrinsic junction recombination velocity.
We have already shown in a previous work that the photocurrent density produced by the solar cell's junction can be divided in two components: a component that depends only on the intrinsic junction recombination velocity Sf0 and a second component that depends on the impedance of the external circuit and also the intrinsic junction recombination velocity Sf0 [9]. Applying this result [9] , the photocurrent density that crosses the external circuit and the one that is lost because of interface phenomena can be expressed respectively by:
Sfj,Sf0
T q Sfj
x 0,Sfj,Sf0
Sfj,Sf0
F q Sf0
x 0,Sfj,Sf0
Jph (7)
In figures 3 and 4, we plot respectively the curves of photocurrent density that crosses the external load versus junction dynamic velocity (Sfj) and the photocurrent density lost at the junction (leakage photocurrent) versus junction dynamic velocity (Sfj) for different values of intrinsic junction recombination velocity.
Fig. 3. External load photocurrent density versus junction
dynamic velocity for different values of intrinsic junction recombination velocity (L=0.02cm; H=0.03cm;D=26cm2/s)
Fig. 4. Leakage photocurrent density versus junction dynamic velocity for different values of
intrinsic junction recombination velocity (L=0.02cm; H=0.03cm;D=26cm2/s)
Curves in figures 3 and 4 show that the effects of interface states are more noticeable in open circuit than in short circuit. That explain why some authors [3-5] used the intercept point between the calibration curve of photovoltage versus junction dynamic velocity and the experimental open circuit voltage for the determination of the intrinsic junction recombination velocity (Sf0).
The consequence of the noticeable effects of interface states in open circuit will be a decrease of the theoretical open circuit voltage.
From curves in figure 3, we determine the values of photocurrent density lost at the junction according to intrinsic junction recombination velocity.
The results are given in Table 1.
Table 1. Leakage photocurrent for various intrinsic junction recombination velocity
Sf0(cm/s) 0 10 102 103 104
JphF(mA/cm2) 0. 0.227 2.131 13 28
The results of Table 1 confirm that the leakage photocurrent is proportional to the intrinsic junction recombination velocity.
2.3. Junction photovoltage
Using Boltzmann’s relation, the photovoltage across the junction of the solar cell is expressed:
ln x 0, , 1 , 2 i 0 0 + n Sf Sf δ N V = Sf Sf Vph j T B j (8)VT is the thermal voltage, niis the density of intrinsic carriers at thermodynamic equilibrium and NBis the base doping density.
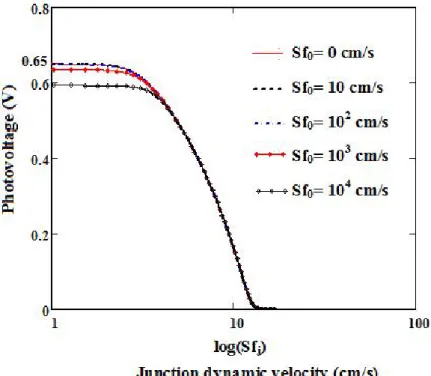
The photovoltage curves versus junction dynamic velocity (Sfj) imposed by an external load resistance for different values of intrinsic junction recombination velocity are plotted in figure 5.
Fig. 5. Photovoltage versus junction dynamic velocity for different values of intrinsic junction
recombination velocity (L=0.02cm; H=0.03cm;D=26cm2/s)
The shape of the different curves in figure 5 show a decrease of open circuit voltage with intrinsic junction recombination velocity increase. The decrease of open circuit voltage is the consequence of the increase of carriers losses at the junction of the solar cell with the increase of the intrinsic junction recombination velocity.
Fig. 6. Total electric power delivered by the solar cell versus junction dynamic velocity for
different values of intrinsic junction recombination velocity (L=0.02cm; H=0.03cm;D=26cm2/s)
The shapes of the different curves show that to the neighborhood of the short circuit, the total electric power delivered by the solar cell base is null. However, we observe on the curves that, at the neighborhood of the open circuit, if the intrinsic junction recombination velocity increases, the total electric power is none the less null but increases. This behavior of the electric power of the solar cell near the open circuit is the consequence of the leakage photocurrent that exists in this operating point. Indeed, the open circuit electric power which represents the electric power lost at the junction, is proportional to the intrinsic junction recombination velocity and evolves toward the value of the maximum electric power for large values of intrinsic junction recombination velocity.
As for the photocurrent density produced by the solar cell's junction, the electric power delivered by the base of the solar cell can be divided in two components: a component that depends only on the intrinsic junction recombination velocity Sf0(electric power lost at the junction) and a second component that depends on the impedance of the external load and also the intrinsic junction recombination velocity Sf0 (electric power delivered to an external load).
The electric power delivered to an external load and the one that is lost by Joule effect at the junction can be expressed respectively by:
Sfj Sf
T =Vph
Sfj Sf
Jph
Sfj Sf
TP , 0 , 0 , 0 (10)
Sf j Sf
F =Vph
Sf j Sf
Jph
Sf j Sf
FP , 0 , 0 , 0 . (11)
We plot in figure 7 the variations in electric power delivered to an external load versus junction dynamic velocity (Sfj) for various intrinsic junction recombination velocity.
Fig. 7. Electric power crossing external load versus junction dynamic velocity for different
values of intrinsic junction recombination velocity (L=0.02cm; H=0.03cm;D=26cm2/s
Curves in figure 7 have the same shape than those of previous works [2,7,9]. The maximum of each curve that represents the maximum electric power decreases with intrinsic junction
dynamic velocity at the maximum power point) and so we calculate the solar conversion efficiency using equation (13):
inc T j el P Sf Sf P Sf0 , 0 max (12)In this expression, Pinc= 100 mW/cm2in Air Mass 1,5 standard conditions, is the power of the flux of the incident light.
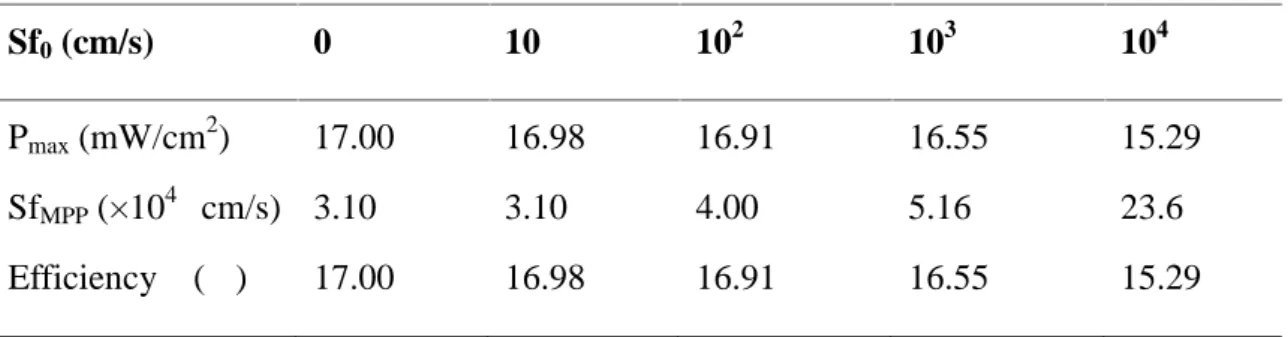
The results are given in Table 2.
Table 2. Conversion efficiency of the solar cell for various intrinsic junction recombination
velocity.
Sf0(cm/s) 0 10 102 103 104
Pmax(mW/cm2) 17.00 16.98 16.91 16.55 15.29
SfMPP(×104 cm/s) 3.10 3.10 4.00 5.16 23.6
Efficiency η (℅) 17.00 16.98 16.91 16.55 15.29
The results of Table 2 show that the solar cell's maximum electric power and conversion efficiency decrease while intrinsic junction recombination velocity increases. We also observe that, the junction dynamic velocity at the maximum power point SfMPP increases with the increase of intrinsic junction recombination velocity, and this behavior corresponds to a displacement of the solar cell's operating point.
We plot in figure 8 the electric power lost at the junction versus junction dynamic velocity (Sfj) for various intrinsic junction recombination velocity.
Fig. 8. Electric power lost at the solar cell's junction versus junction dynamic velocity for
different values of intrinsic junction recombination velocity (L=0.02cm; H=0.03cm;D=26cm2/s
Curves in figure 8 show that the electric power lost at the solar cell's junction is only noticeable in open circuit and it is proportional to the intrinsic junction recombination velocity. In the Shockley five-parameter model of a solar cell, a shunt resistance represents the leakage current along the edges of the solar cell [10]. Thus, the electric power lost at the solar cell's junction is lost in this shunt resistance by Joule effect.
Using the curves of electric power lost at the junction plotted in figure 8, we determine the values of electric power lost at the junction according to intrinsic junction recombination velocity and then we calculate the shunt resistance using equation (14):
2 0 0 0 F F el shSf
Jph
Sf
P
Sf
R
(14)The results of table 3 show that the shunt resistance of the solar cell decreases while intrinsic junction recombination velocity increases resulting an increase of the leakage photocurrent. This behavior means that the increase of intrinsic junction recombination velocity leads to a decrease of the external load's electric power and confirm the derivation of a part of generated current on the shunt resistance.
4. CONCLUSION
A modeling of the effect of intrinsic junction recombination velocity on the performance of a silicon solar cell has been presented.
From a one-dimensional model, we pointed out the effects of intrinsic junction recombination velocity, none the less on the photocurrent and the solar cell's conversion efficiency but also on its shunt resistance. It appears in this work that, due to the carriers recombination at the solar cell junction characterized by the intrinsic junction recombination velocity, the photocurrent transmitted to the external load decreases with intrinsic junction recombination velocity increase. This behavior led to the decrease of the solar cell's maximum electric power which moves toward large values of junction dynamic velocity (SfMPP) and also to the decrease of the solar cell's efficiency with the increase of intrinsic junction recombination velocity. The increase in junction dynamic velocity at the maximum power point with intrinsic junction recombination velocity (SfMPP) corresponds to a displacement of the solar cell's operating point.
The modeling of carriers’ recombination in the solar cell junction as the derivation of leakage
velocity effect on shunt resistance. It appears also that the shunt resistance decreases with intrinsic junction recombination velocity increase. As the decrease of shunt resistance means an increase of leakage photocurrent, this result confirms also the reduction of the solar cell's photocurrent and maximum electric power with intrinsic junction recombination velocity increase.
5. REFERENCES
[1] Orton J. W. and Blood P. The Electrical Characterization of Semiconductors: Measurement of Minority Carrier Properties. London: Academic Press, 1990
[2] Zerbo I, Zoungrana M, Seré A D, Zougmoré F. IOP Conf. Ser.: Mater. Sci. Eng., 2012,29, 012019, doi:10.1088/1757-899X/29/1/012019
[3] Sissoko G, Nanema E, Corréa A, Biteye P M, Adj M, and Ndiaye A L. Silicon solar cell recombination parameters determination using the illuminated I-V characteristic. Proceedings of World Renewable Energy Congress, Florence-Italy, 1998, 1848-1851.
[4] Lemrabott O H, Ly I, Maiga A S, Wereme A, Barro F I, and Sissoko G. Bulk and surface recombination parameters measurement in silicon double sided solar cell under constant monochromatic illumination. J. Sci. , 2008, 8(1): 44-50.
[5] Nzonzolo, Lilonga-Boyenga D, and Sissoko G. Illumination level effects on macroscopic parameters of a bifacial silicon solar cell. Energy Power Eng. , 2014, 6, 25-36
[6] Misiako K, Wang C H, Neugroschel A, and Lindholm F A. Simultaneous Extraction of Minority-Carrier Parameters in Crystalline Semiconductors by Lateral Photocurrent. J. Appl. Phys.,1990, 67(1): 321-333
[7] Zerbo I, Zoungrana M, Sourabié I, Ouedraogo A, Zouma B, Bathiebo D J. Turk. J. Phys., 2015, 39(3), 288-294, doi:10.3906/fiz-1505-10.
[8] Mohammad S N. An alternative method for the performance analysis of silicon solar cells. J. Appl. Phys., 1987, 61(2), 767-772
[9] Zerbo I, Zoungrana M, Ouedraogo A, Korgo B, Zouma B, and Bathiebo D J. Influence of electromagnetic waves produced by an amplitude modulation radio antenna on the electric power delivered by a silicon solar cell. Global. J. Pure Appl. Sci., 2014, 20, 139-148