Climate Economics Chair Publications
Combining cap-and-trade with offsets:
Lessons from CER use in the EU ETS in 2008 and 2009
Raphael Trotignon
1The EU ETS is the first full scale example of a cap and trade system linked to project based mechanisms. While most papers on the subject focus on the policy design point of view, few have analyzed the facts. Offsets have been used by European industrial installations in 2008 and 2009. If the linking with an offset mechanism is successful, one should find evidence that offsets are used on a large scale, i.e. that significant volumes of credits go from a large number of projects to a large number of installations, independently from their sector, size or position, and that the limit of import is fully used at the end of the phase. This paper is an ex-post analysis of offsets used in the EU ETS in terms of intensity, frequency, and efficiency. This allows us to answer partially those questions and to identify possible explaining factors.
JEL Classification: Q49, Q50, K32
Keywords: EU ETS, Clean Development Mechanism, Linking
n° 2011-03
Working Paper Series
1. PhD Student at Paris-Dauphine University (CGEMP/LEDa) and researcher at the Climate Economics Chair.
2 INTRODUCTION
The European Union Emission Trading Scheme (EU ETS) is the first large scale CO2 emission trading system in the world1. Created in 2003, it entered into force in 2005, covering more than 10 000 industrial installations in 25 countries2. The aim of the EU ETS is to help Member States reach their Kyoto target (over 2008-2012), and, since the vote of the Climate Energy Package3 in December 2008, to help meet the European target of 20% greenhouse gas emission reduction in 2020 compared to 1990.
During Kyoto’s Commitment Period, the EU ETS is closely related to the international Kyoto trading system. The CO2 permits associated to the EU ETS, called European Union Allowances (EUAs) are, between 2008 and 2012, conversion of AAUs (Assigned Amount Units), the permits allocated to Annex B Parties of the Kyoto Protocol. In the same way countries can use emissions credits from project mechanisms in the emission trading system associated to the Kyoto Protocol, industrial installations covered by the EU ETS are allowed, since the vote of the “Linking Directive4” in 2004, to meet part of their emission reduction targets with credits (CERs or ERUs) starting from 2008.
Both systems (“cap and trade” and “baseline and credits”) give a price to GHG emissions and are incentive to reduce them. They are complementary because cap-and-trade is not always the most suitable policy (e.g. in sectors with diffuse emissions). The scope of activities covered by a price can be larger when combining both systems, thus possibly lowering the equilibrium price on the market and the total cost of compliance. Reducing cost is the main argument for establishing a link between the EU ETS and Kyoto’s project based mechanisms. This was clearly stated in the European Commission’s impact assessment, in 20035.
As summarized by Olander and Murray (2008), there are many concerns associated with the incorporation of offsets into a cap-and-trade system: damage to the integrity of the cap (if offsets are not real – additional – reductions, they can undermine the cap and trade
1 For an analysis of the EU ETS’ first phase, readers can refer to Ellerman, Convery and de Perthuis
(2010).
2 Now 30 countries, EU27 + Norway, Iceland and Liechtenstein
3 See European Commission (2009a) and European Commission (2009b)
4 See European Commission (2004)
5
3 system linked to the offset program), money flows to foreign countries (the likely lower cost of international offsets will result in wealth transfers to foreign nations), negative co-effects in host countries (tradeoffs in air pollutants, reduced water availability, replacement of native vegetation…), and outsourcing emission reductions (if an unlimited use of offset is allowed, the cap can be met without any participants reducing emissions domestically).
While most papers focus on those benefits and concerns from a policy design point of view6, few have analyzed the positives facts7. We now have two years of data, 2008 and 2009, when the EU ETS is linked to CDM and JI and credits have been used by industrial installations (a little above 80Mt or 4% of emissions in the EU ETS each year). This article is an empirical analysis of the offsets surrendered for compliance by installations in the EU ETS for the first two years of phase 2. It analyzes the characteristics of imports in terms of intensity, frequency, and efficiency and identifies explaining factors. For concision and because their use in the EU ETS has been relatively small (48,000t in 2008 and 3.5Mt in 2009), credits from the Joint Implementation (ERUs) are excluded from this study. This is an important limit because larger volumes of ERUs could possibly become available before the end of Kyoto’s Commitment Period.
The first section explains the frame for importing credits in the EU ETS in terms of quantity and timing - factors that can impact directly the nature of the demand for credits; and describes the main characteristics of the offer originating from CDM projects. It then briefly reviews theoretical expectations from an economical point of view. Section 2 is an overview of CER use in the EU ETS based on surrendered units. It presents the main characteristics of CERs surrendered in the EU ETS and compares it to CERs that were available at that time; the aggregate flows between countries that result from CER imports; and an estimate of direct savings realized by installations. Section 3 analyses CER imports at the installation level in terms of intensity, frequency, stability in time and concentration, by sector, size and position (deficit or surplus of allowances). Section 4 concludes.
6 See for example Michaelowa (2007), Jaffe and Stavins (2008), Ramseur (2008), Aldy and Stavins (2009), Tol (2009), Grüll and Taschini (2010), Michaelowa et al. (2010)
4 1. THE FRAME FOR IMPORTING CREDITS
The rules for using credits in the EU ETS are stated in the so-called “linking” Directive of 2004. The process is decentralized. The percentage of offsets allowed is expressed as a share of the allocation, and determined separately by each Member State at the beginning of the phase. It must be compatible with Member State’s Kyoto Commitments to be accepted by the Commission. In phase 2, all types of credits are accepted in the EU ETS, except CERs and ERUs generated from nuclear facilities and temporary credits resulting from land use, land use change and forestry activities. There are also restrictive criteria for large hydro projects8.
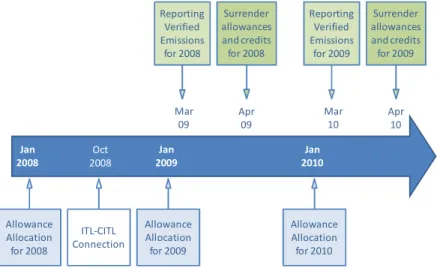
Installations covered by the EU ETS have a compliance process to follow (see Figure 1). At the beginning of the year, each installation receives a free allocation consisting of EUAs. Emissions over the year have to be monitored and verified. The year after (before end April Y+1) installations must surrender as many allowances as verified emissions in year Y. This is the moment when CER/ERUs can be used instead of EUAs to match verified emissions. Since the beginning of phase 2 in January 2008, installations have had the opportunity to surrender credits twice9.
Figure 1 – The compliance process for EU ETS installations (simplified)
Jan 2008 Jan 2010 Jan 2009 Mar 09 Apr 09 Mar 10 Apr 10 Allowance Allocation for 2008 Allowance Allocation for 2009 Allowance Allocation for 2010 Reporting Verified Emissions for 2008 Surrender allowances and credits for 2008 Reporting Verified Emissions for 2009 Surrender allowances and credits for 2009 ITL-CITL Connection Oct 2008
Source: European Commission
8 See European Commission (2009) 9
5 For environmental integrity reasons, it is necessary for the registries of both system (EU ETS and Kyoto Protocol) to be linked. Importing credits into installations accounts requires a direct connection between the accounting registries of each Member States10 and the registry associated to the Kyoto Protocol (the ITL). That connection occurred on October 16th 2008, ten month after the start of the phase, but still well before the deadline for surrendering allowances. This delay has had virtually no impact on the ability for operators to import credits in 2008.
1.1 Import limits
The majority of emissions reductions induced by the Kyoto Protocol and the EU ETS has to be realized domestically. To take that into account, the amount of credits that can be used is limited to a certain percentage of the conventional allocations. On average, installations can surrender credits from Kyoto’s project mechanisms up to 13.5% of allocations (or 1,420Mt over 2008-2012). This limit11 varies from 0% (in Estonia) to 20% (Germany, Spain, Norway, and Lithuania) of allocated allowances. Because import limits are expressed as a share of allocations, the quantity of offset allowed for import is larger in the major emitting Member States. Installations from Germany can import 450 million credits over the phase, more than a fourth of the total volume allowed. Seven Member States (Germany, Spain, Italy, France, Poland, the United Kingdom, and Czech Republic) account for more than 75% of total import volumes allowed.
1.2 Variability of the authorized use of credits over time
The limit of 1420 Mt is set over the phase, but Member States can decide to establish annual import limits. Limits can also vary inside a country depending on sectors. In the UK for example, the percentage allowed for Large Electricity Producers (LEP) is slightly higher than for other sectors. The limit in the UK is set annually, but installations may bank any unused limit to the next year.
The rules differ significantly among countries. As a consequence there is a great amount of spatial and temporal variability in the potential demand for credits in the EU ETS. Three factors have an impact on determining the exact quantity of credits that can be imported every year: differences of treatment between industries, banking of unused annual import limit, and borrowing of next year’s annual import limit.
10 All national registries connected to the central registry of the EU ETS, the CITL 11
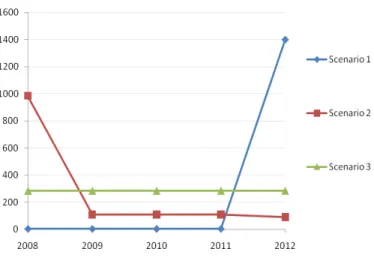
6 As a consequence, there is no real limit for importing credits in a given year (5 years of credits’ import at any time for most installations). In 16 countries representing 160Mt (56%) of average annual potential credits imports, installations have full flexibility (i.e. one limit for the phase as a whole). In 5 other countries (37% of average annual potential credit imports), installations can bank their limit but cannot borrow it from future years. In the three remaining countries, namely Hungary, Latvia and Lithuania, installations can neither bank nor borrow any annual import limit, i.e. the limit is strictly annual. Figure 2 shows three possible scenarios of offsets demand given the actual rules.
Figure 2 – Flexibility of the annual import limit
Scenario 1: Credits are used as late as possible (maximum banking)
Scenario 2: Credits are used as early as possible (maximum borrowing)
Scenario 3: Credits are used evenly every year (no banking, no borrowing)
Source: own calculation from Fages et al. (2009).
This lack of harmonization in the rules may cause imperfect information for market actors, and make the interpretation of data at the installation level more complicated. Moreover, as explained by Vasa (2010), it is a source of potential inefficiency, because the lack of harmonization in the rules may prevent imports to happen where they are most efficient.
1.3 The rule for importing credits after 2012
In order to give installations more flexibility, the revised Directive for Phase 3 enables them to bank any unused portion of their Phase-2 import limit into Phase 3. This will be added to any additional phase 3 import limit decided by Member States and the European Commission with regards to international negotiations and to the level of the European reduction target (-20% or -30%). Installations of the EU ETS are thus free to spread the use of
7 their Phase-2 import limit however they like over 2008-2020, but it will not be allowed to borrow possible credits import limits from Phase 3 to Phase 2. The quantity of offsets accepted in Phase 3 will thus be around 1420 – import limits used in Phase 2 + any new limit accepted by then.
In details, the rules for importing credits after 2012 are complicated and very uncertain. With the EU-ETS being a sub-component of Member States’ Kyoto compliance strategy over 2008-12, Member States are only interested to accept from ETS installations CERs/ERUs that they can use for their own Kyoto obligations until 31 March 2015 (Kyoto’s compliance deadline), both in terms of quality and timing12.
1.4 Opportunity cost is an incentive to optimize compliance
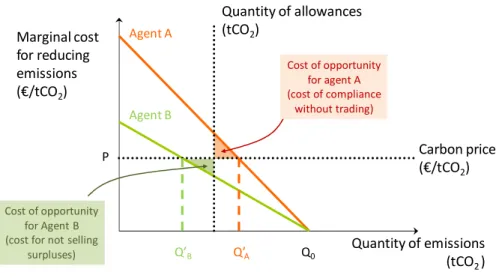
All installations covered by the emissions trading scheme face a cost of opportunity (the cost of not selling an allowance), no matter if the installation is actually in deficit of allowance (short, i.e. allocation < emissions) or in surplus (long, i.e. allocation > emissions). As can be seen on Figure 3, installations should either reduce emissions if the price of an allowance or a credit is greater than their marginal emission reduction cost; or buy allowances and/or credits if their prices are inferior to the marginal emission reduction cost. This does not depend on the quantity of allowances allocated, neither on the nature of the allocation (free or auctioned).
Figure 3 – Cost of opportunity in a cap and trade system
Marginal cost for reducing emissions (€/tCO2) Quantity of emissions (tCO2 ) Agent A Agent B Q0 Q’A Q’B P Carbon price (€/tCO2) Quantity of allowances (tCO2) Cost of opportunity for agent A (cost of compliance without trading) Cost of opportunity for Agent B (cost for not selling
surpluses)
Note: this figure assumes that A and B received the same quantity of allowances
12
8 1.5 Price spread is an incentive to use as much offsets as possible
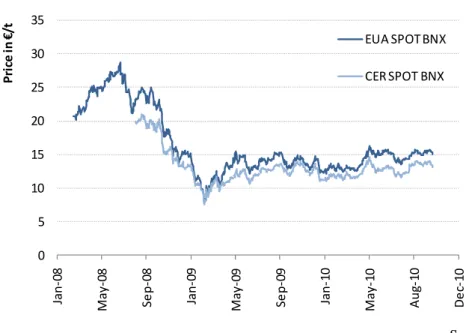
As long as the price of a credit is below the price of an EUA, all installations have an incentive to buy credits instead of EUAs, which can then either be sold or used for compliance, to save the difference (spread) between EUAs and credits prices13. This will be done as a transaction on the market (secondary CERs) or directly by financing a project (primary CER market). Figure 6 shows observed spot price for EUAs and secondary CERs. Figure 4 shows that offsets have always been cheaper than EUAs, so that in theory all installations have had an incentive to surrender as much credits as they are allowed to.
Figure 4 – EUA and CER prices over the period 2008-2010
0 5 10 15 20 25 30 35 Ja n -0 8 M a y -0 8 S e p -0 8 Ja n -0 9 M a y -0 9 S e p -0 9 Ja n -1 0 M a y -1 0 A u g -1 0 D e c-1 0 P ri ce in € /t EUA SPOT BNX CER SPOT BNX Source: BlueNext
We see that the price spread is not constant over time, which means that the incentive to use offsets for installations is variable (as we have seen in section 1.3, most installations have the flexibility to decide when to use the option value of surrendering a credit during the phase). Their actual imports of offsets can depend on current but also on expected price spreads between EUA and offsets.
9 1.6 The offer of offsets: observed and forecasted CER issuance
There can be no imports of offsets without offsets. Information on existing projects and offsets issuance is made available every month from the United Nations14. To date there are more than 6,500 different projects, among which 802 are implemented and regularly issuing credits. To date, most credits come from industrial gases activities (reduction of HFC and N2O represents 70% of the credits issued in 2009 and 2010), and renewable energy projects (Wind and Hydro represent 10%). The large share of industrial gases projects is logical because the first projects to be implemented are expected to be the the most efficient (high reductions at low cost). In terms of location, most CERs come from emerging countries with large emission reductions potential: China (nearly half of it), India, South Korea, and Brazil make 90% of the cumulated issued CERs in 2008 and 2009.
The amount of CER issued does not directly indicate CERs available for compliance in the EU ETS, because there are other sources of demand for offsets: Kyoto’s international market (for Annex B Parties), and regional or voluntary markets. Real offset demand on Kyoto international market is hard to estimate because the demand spreads after 2012 (Kyoto’s compliance process) and because CERs are substitute to AAUs, which can be less expensive and are largely available (global surplus of Kyoto international market). Regional and voluntary demand is also very uncertain.
All in all, credits generated by CDM projects and potentially available for EU ETS installations represent a maximum of 280 Mt for 2008 (with the hypothesis of no demand from the international Kyoto market, and no credits set aside by other market actors), and around 300 Mt in 2009 (all credits generated less those used in the EU ETS in 2008). This quantity of credits available in 2008 and 2009 is low, and probably lower than the average annual limit of imports taking into consideration other sources of demand.
As shown on Figure 5, issuance forecasts see total cumulated CERs below 1,200Mt at the end of the phase 2 compliance period (April 2013). A linear extrapolation of issuance gives a total amount of nearly 800Mt over EU ETS phase 2, much less than the 1,420Mt authorized for imports. There is thus high chance that there will not be enough CERs to meet the maximum target. But ERUs, which are not included in this study, can also be used to meet this cap.
14
10 Figure 5 – CER issuance forecasts until end Apr. 2013
0 200 400 600 800 1000 1200 1400 D e c-0 6 D e c-0 7 D e c-0 8 D e c-0 9 D e c-1 0 D e c-1 1 D e c-1 2 C u m u la te d is su e d C E R s (M t)
Issued CERs (UNEP Risoe) CDC Climat Research forecast UNEP Risoe forecast
11 2. OVERVIEW OF CER USE IN THE EU ETS BASED ON SURRENDERED UNITS DATA
2.1 Presentation of the CITL data
In the EU ETS, compliance is recorded in accounts associated with each emitting installation that are maintained in registries. These registries record the initial allocations to installation accounts, all transfers in and out of accounts, and the annual surrender of allowances for compliance. In the case of the CITL, which is the central registry for the EU ETS, data is provided for the holding account of every affected installation. These accounts record the annual allocation of allowances to the installation, its emissions for the year, and the number of allowances surrendered for compliance15. In addition, the registry of origin for every allowance surrendered is reported, although not the identity of the installation to which the allowance was initially issued. As far as Kyoto credits, the project identifier and country of origin (the project’s host country) of each surrendered credit is reported. This installation-level data can then be aggregated by ETS sector, country, size etc.
2.2 Main characteristics of CERs surrendered in the EU ETS
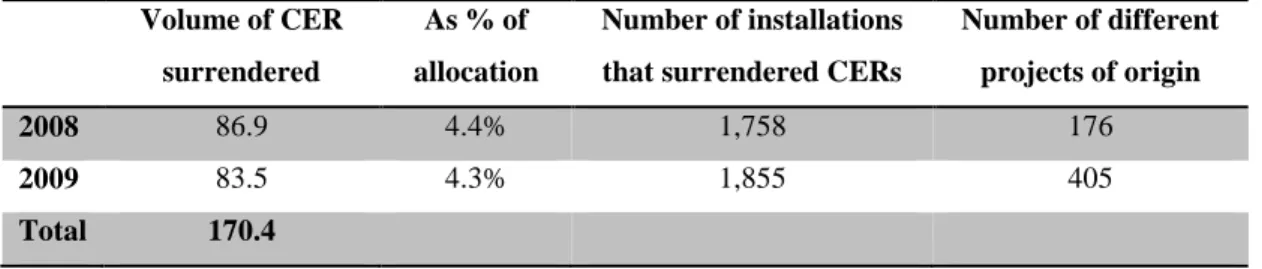
In two years, 170 million CERs have been surrendered for compliance in the EU ETS (a little bit more in 2008 than in 2009), that is around 4% of allocations or a third of the average annual import limit. The number of installations using at least one CER has gone up between the two years, and so did the number of project of origin (see Table 1), which can be interpreted as a classic market development pattern.
Table 1 – General picture of CER use in the EU ETS
Volume of CER surrendered
As % of allocation
Number of installations that surrendered CERs
Number of different projects of origin 2008 86.9 4.4% 1,758 176
2009 83.5 4.3% 1,855 405
Total 170.4
Source: CITL and UNEP Risoe
15
12 One could ask if surrendered credits are similar to those issued (the potential offer). The answer is yes: the subset of credits used for compliance in the EU ETS reflects the offer in terms of project types and host countries (with, as shown in Figure 6, slightly more HFC and Indian projects and less Hydro and Wind projects).
Figure 6 – Cumulated CER issuance versus CER use in the EU ETS
China India South Korea Brazil Mexico 0% 10% 20% 30% 40% 50% 60% 0% 20% 40% 60% S h a re o f h o st c o u n tr ie s in C E R s u rr e n d e re d in 2 0 0 8 + 2 0 0 9
Share of host countries in cumulated offer in May 2010
HFCs N2O EE own generation Hydro Wind 0% 10% 20% 30% 40% 50% 60% 70% 0% 10% 20% 30% 40% 50% 60% 70% S h a re o f p ro je ct t y p e s in C E R s su rr e n d e re d in 2 0 0 8 + 2 0 0 9
Share of project types in cumulated offer in May 2010
Source: CITL and UNEP Risoe
Note: data points closer to the diagonal line are those for which the credits surrendered in the EU ETS are similar in terms of origin (left graph) or type (right graph) to the credits issued. Points above (respectively below) the line (India, HFCs – resp. Brazil, Wind, Hydro) are the criteria for which there is a larger (resp. smaller) share of credits of this type surrendered in the EU ETS than in the credits issued.
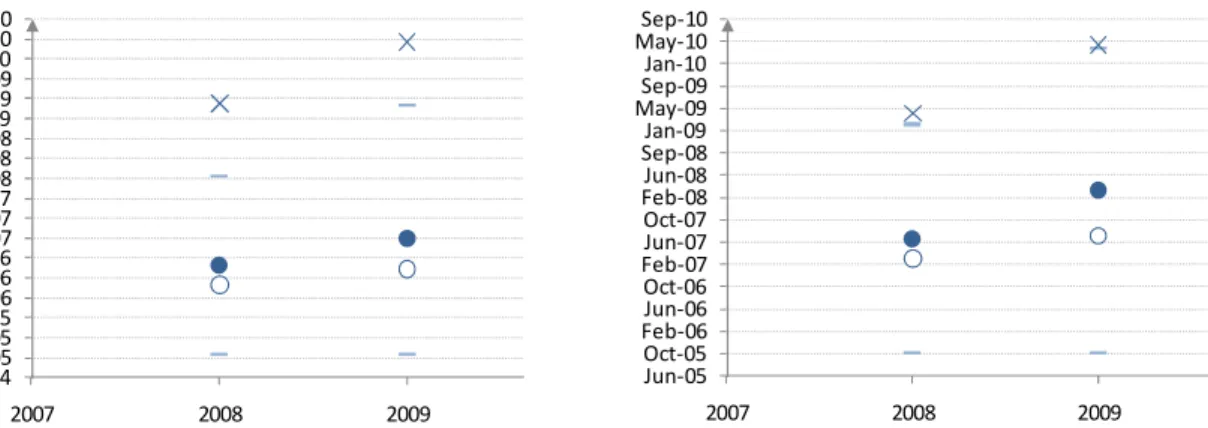
Looking at the registration and first issuance dates of projects from which surrendered credits came from, we see that the use of offsets follows the evolution of the offer (see Figure 7). In both years, credits surrendered were coming from projects registered on average three years before. Credits surrendered in 2009 incorporated more credits coming from younger projects. Again, this is what is expected to happen in theory. We can note that credits imported in the EU ETS match the largest spectrum of CDM projects (from the earliest projects to the oldest). Adding to that, the time between the issuance of a credit and its use in the EU ETS can be very short in some cases, which proves that demand (imports) can react in the short term to change in the offer (issuance).
13 Figure 7 –Max, min and average registration date/first issuance date of surrendered credits’ projects, by year
Registration date First issuance
Oct-04 Feb-05Jun-05 Oct-05 Feb-06Jun-06 Oct-06 Feb-07Jun-07 Oct-07 Feb-08Jun-08 Sep-08Jan-09 May-09Sep-09 Jan-10 May-10Sep-10 2007 2008 2009 Jun-05 Oct-05 Feb-06 Jun-06 Oct-06 Feb-07Jun-07 Oct-07 Feb-08Jun-08 Sep-08 Jan-09 May-09Sep-09 Jan-10 May-10Sep-10 2007 2008 2009
Note : • average, O volume weighted average, - minimum and maximum observed, X deadline for surrendering credits
Source: CITL and UNEP Risoe
2.3 Final CER flows to Europe
Final flows from country to country are the result of compliance trading by installations (primary or secondary CDM), they do not reveal intermediary trades (secondary market) but only the country of origin (the project’s host country) and the country of destination (the installation’s Member State). The biggest flows are shown below in Figure 8.
Figure 8 – Largest final flows between countries resulting from CER use by EU ETS installations 2008 14 Mt 11 Mt 7 Mt 6.4 Mt 2.7 Mt 2.6 Mt 2.4 Mt 1.6 Mt 1.9 Mt 2.1 Mt 1.9 Mt 1.4 Mt 1.4 Mt 1.4 Mt 1.3 Mt 1.2 Mt 1.1 Mt Brazil India China South Korea
14 2009 Brazil India 14 Mt 8.5 Mt 6.6 Mt 5.9 Mt 4.7 Mt 2.5 Mt 2.4 Mt 2.3 Mt 2.2 Mt 2.2 Mt 2.1 Mt 2.0 Mt 1.8 Mt 1.7 Mt China South Korea Source: CITL Note: in both figures, flows represent 70% of annual imports
We see that a large majority of imports involve mainly a small number of countries. We saw earlier that due to the rules for importing credits, the majority of the potential demand would come from Germany, Spain, Italy etc. Ex post observations show that the majority of flows answer to that demand. The flow from China to Spain in 2008, or the flow from China to Germany in 2009 make nearly 17% of all imports.
2.4 How much money was saved?
Savings can be attributed to offsets. The major impact of importing CERs is to lower the demand for EUAs, thus lowering the equilibrium price on the EUA market. Those savings are theoretically spread across all installations. The total cost saving resulting from this effect is difficult to estimate and is not the purpose of this paper, though this question would deserve more attention.
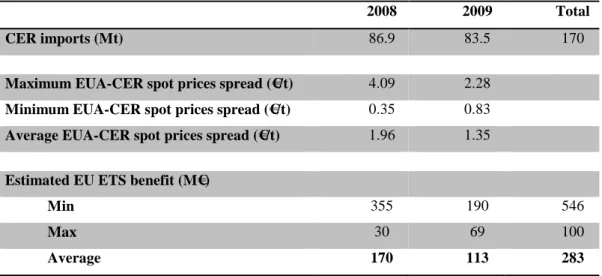
Another cost saving due to offsets is the benefit from the EUA-CER spread. This saving is more direct, but benefits to a smaller number of installations. A back of the envelop calculation consists in multiplying the volume of credits imported by the average EUA-CER spread over the period. Table 2 below gives estimates of an average 280 M€ saved over the first two years of Phase 2. This figure corresponds to the savings directly realized by installations when surrendering CERs instead of EUAs. This method supposes installations
15 bought CER on the secondary market (savings would probably be higher for installations which got the credits from financing a project).
Table 2 – Estimated direct EU ETS benefit from importing CERs
2008 2009 Total CER imports (Mt) 86.9 83.5 170
Maximum EUA-CER spot prices spread (€/t) 4.09 2.28
Minimum EUA-CER spot prices spread (€/t) 0.35 0.83
Average EUA-CER spot prices spread (€/t) 1.96 1.35
Estimated EU ETS benefit (M€)
Min 355 190 546
Max 30 69 100
Average 170 113 283
16 3. INSTALLATION LEVEL ANALYSIS OF CER USE IN THE EU ETS BASED ON SURRENDERED UNITS DATA
We analyze here the use of CER at the installation level by category of installation (sector, size position) in terms of intensity, frequency, stability, and concentration.
3.1 Intensity and frequency of CER use by category of installation
The “specific intensity” of CER use is calculated as the sum of CER surrendered by category (sector, size or position), divided by the sum of allowances (all types aggregated) surrendered by installations which surrendered at least one CER. It describes the average importance of CER use for installations which surrendered credits. The “frequency” of CER use is calculated as the number of installations in the category (sector, size or position) that surrendered at least one CER for compliance, divided by the total number of installations in that category. It describes the awareness of a category for project based mechanisms and compliance cost minimization. From the specific intensity and the frequency indicators, we can derive the intensity of use for all installations (taking into account installations which surrender no credits at all). Intensity represents the average level of credit imports as a compliance tool among all installations (if offsets are a central piece for compliance, or just used as a little bonus if not used at all). Figure 9 below shows intensity, specific intensity and frequency of CER use by sector, size and position.
17 Figure 9 – Intensity and frequency of credit imports, by sector, size and position
Intensity
(CER surrendered / Total units surrendered)
Specific intensity
(CER surrendered / Total units surrendered) Only installations that surrendered CERs
Frequency
(nb of installations importing credits/total nb of installation) 0% 2% 4% 6% 8% 10% 12% Combustion Refineries Coke ovens Metal ore Iron and Steel Cement Glass Ceramics Paper and board Opted-in Total 2008 2009 2008+2009 0% 10% 20% 30% 40% Combustion Refineries Coke ovens Metal ore Iron and Steel Cement Glass Ceramics Paper and board Opted-in Total 2008 2009 2008+2009 0% 10% 20% 30% 40% Combustion Refineries Coke ovens Metal ore Iron and Steel Cement Glass Ceramics Paper and board Opted-in Grand Total 2008 2009 2008+2009 0% 1% 2% 3% 4% 5% 6% < 25 000 t/yr < 100 000 t/yr < 500 000 t/yr > 500 000 t/yr Total 2008 2009 2008+2009 0% 10% 20% 30% 40% < 25 000 t/yr < 100 000 t/yr < 500 000 t/yr > 500 000 t/yr Total 2008 2009 2008+2009 0% 10% 20% 30% 40% < 25 000 t/yr < 100 000 t/yr < 500 000 t/yr > 500 000 t/yr Total 2008 2009 2008+2009 0% 1% 2% 3% 4% 5% Long Short Total 2008 2009 0% 5% 10% 15% 20% Long Short Total 2008 2009 0% 5% 10% 15% 20% Long Short Total 2008 2009
18
A little less than one fifth (or 20%) of the installations surrendered at least one CER for compliance in 2008 or in 2009. The main results of this analysis allow us to characterize this use.
Considering the use of CERs by industries, we see that CER imports are frequent and stable in all sectors. Most frequent uses of CERs are in the Cement and Refinery sectors. CER intensity is relatively small and constant across sectors (4% on average). Most intense uses of CERs are in the Paper, Ceramics and Iron and Steel sectors. We can note that the combustion sector does not stand out of the line contrary to what is commonly accepted. But this sector is by far the largest of the EU ETS (in number of installation and in volumes of allocation). It gathers a wide range of installations going from small scale externalized combustion for industries to large scale electricity plants. This may explain why figures for the combustion sector are close to the average.
The size of installations does matter in term of frequency. Smaller installations are clearly using CER imports less frequently than the others. One third of installations > 500,000t/yr surrendered at least one CER, against one out of ten for installations <25,000t/yr. These differences can be explained by transaction costs and market awareness. Even if the size of the installation does not seem to matter in terms of intensity, smaller installations tend to surrender a slightly larger share of offsets compared to allowances. This is striking in term of specific intensity. This confirms previous point, in that smaller installations will have an incentive to surrender as much credits as possible to minimize transaction costs (as shown by Jaraite et al. (2010), transaction costs represent a more significant share of the cost for small installations than for the others16).
Installation’s position (emissions > or < to allocation) does not matter. This may be surprising given the possible asymmetry between the long and the short installations17. Long installations even surrendered more CERs in term of intensity than the short. Apparently installations did not use credit imports as a way to be compliant but as a way of minimizing the total cost of compliance, which is what is expected in theory. In terms of frequency of CER use, position does not make a difference either. Among installations which surrendered CERs, almost two thirds are long installations. This clearly shows that installations swapped out CERs in order to bank or sell EUA surpluses.
16 See Ellerman, Convery and De Perthuis (2010)
17 Shorts installations have to find allowances or offsets to be compliant, when long installations only have the possibility but not the obligation of selling surplus.
19
3.2 Stability of CER imports over time
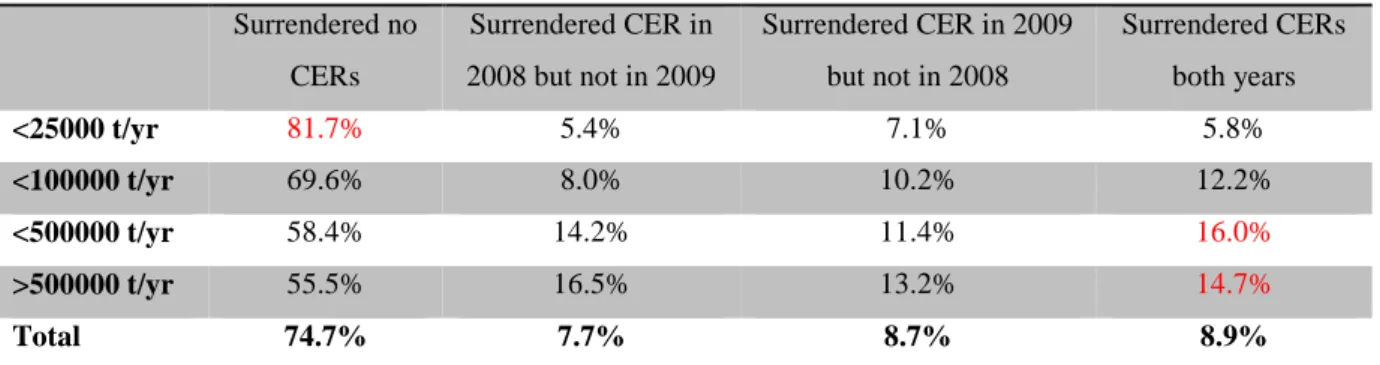
Table 3 below shows, by size category, the share of installations that never surrendered a credit, that surrendered credits both years, and that surrendered credits one year but not the other. On average, roughly 70% of the installations never used this opportunity, 10% always used it (though not up to the limit), and 20% used it one year but not the other. We are thus far from a situation where the possibility of importing offsets is fully used. Here again, an important result is that size is a strong driver for stability in CER imports.
Table 3 – Comparison between 2008 and 2009
Share of installations that…
Surrendered no CERs Surrendered CER in 2008 but not in 2009 Surrendered CER in 2009 but not in 2008 Surrendered CERs both years <25000 t/yr 81.7% 5.4% 7.1% 5.8% <100000 t/yr 69.6% 8.0% 10.2% 12.2% <500000 t/yr 58.4% 14.2% 11.4% 16.0% >500000 t/yr 55.5% 16.5% 13.2% 14.7% Total 74.7% 7.7% 8.7% 8.9% Source: CITL
We can conclude from the last two sections that, among the factors tested, the size of installations is by far the strongest driver for CER imports in the EU ETS, even though in terms of intensity imports are more or less equally spread whatever the factor considered (sector, size or position).
3.3 Concentration of CER use
The concentration of CER flows observed on the maps of section 2 is reflected by the installation level analysis of CER use. A few installations are responsible for a large share of imports (in terms of volume), and a largest number of small imports by many installations makes the rest. Figure 10 below indicates that in 2008, 70% of CERs have been surrendered by 10% of the installations that surrendered CERs (1.5% of all installations). Imports are even more concentrated in 2009 (80% of imports by 10% of importers).
20
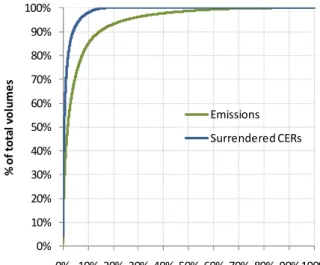
Figure 10 – Concentration of CER use and comparison with emissions
0% 10% 20% 30% 40% 50% 60% 70% 80% 90% 100% 0% 10% 20% 30% 40% 50% 60% 70% 80% 90% 100% C u m u la te d n u m b e r o f cr e d it s su rr e n d e re d
% of the total number of installations that surrendered CERs 2008 2009 0% 10% 20% 30% 40% 50% 60% 70% 80% 90% 100% 0% 10% 20% 30% 40% 50% 60% 70% 80% 90%100% % o f to ta l v o lu m e s
% of total number of installations Emissions Surrendered CERs
Source: CITL Note: on the right, figures are for 2009. Results are similar in 2008
This is an important feature of observed CER imports in the EU ETS: the majority of it results from a small number of actors. The use of CERs is more concentrated among installations than emissions.
What is the link between the 1,800 installations which imported credits and the 400 projects of origin of those credits? A large majority (more than 60%) of installations surrendered credits coming from a single project. Less than 3% of installations surrendered credits coming from more than 20 projects. The record is held by Vattenfall’s Reuter West Power Station in Berlin, surrendering 1.25 million CERs in 2009 coming from 135 different projects. This is not very surprising given that large installations will have to diversify the source of credits to gather the quantity needed. On the contrary, smaller installations will reach the import limit more quickly (smaller import volumes), and have interest to import larger chunks of offsets because of transaction costs.
Another way to look at the concentration of CER final flows is to consider the number of different installations which surrender credits coming from the same projects. This reveals that 5% of the projects of origin have seen their credits being surrendered by more than 50 different installations.
The offer of credits is also very concentrated. Table 4 details the top 10 projects from which credits imported in the EU ETS originated. Those ten prjects represent more than 65%
21
of CERs surrendered in the EU ETS. Lessons that can be drawn from this table are first, that major sources of credits to the EU ETS are projects registered long before the moment credits are needed for compliance. Projects need time to generate large amounts of credits. HFC and N2O projects are large and were among the first to be developed and among the least expensive. Secondly, a large share of the credits issued by those old and large projects have already been used in the EU ETS (55% on average for top 10 projects). This implies that in case the demand for offsets grows over the years, many smaller projects will be required to replace the disappearing stock of offsets from large and old projects. And third, we see that initially large chunks of credits are eventually found divided among a diverse number of installations. This indicates that the secondary market is useful and used by installations.
Table 4 – Top 10 projects from which credits imported in the EU ETS originated (2008 and 2009 combined) Id Host Country Type Registration date First Issuance Total CERs issued in May 2010 Share in total CERs imported in the EU ETS Nb of installations that surrendered at least 1 credit from this project 99 S. Korea N2O 27-nov-05 24-nov-06 38.7Mt 12% (20.2Mt) 593
1 India HFCs 08-mar-05 10-avr-06 25.4Mt 10% (17.1Mt) 445
232 China HFCs 13-mar-06 01-jun-07 24.1Mt 10%(16.9Mt) 261
115 India HFCs 24-dec-05 16-jan-06 16.5Mt 6% (10.8Mt) 355
306 China HFCs 08-aug-06 12-apr-07 28.0Mt 6% (10.4Mt) 306
116 Brazil N2O 25-dec-05 05-mar-07 21.3Mt 6% (9.6Mt) 283
11 China HFCs 04-jun-06 03-may-07 23.9Mt 5% (9.0Mt) 381
1238 China N2O 30-nov-07 28-jul-08 13.0Mt 5% (7.8Mt) 295
550 China HFCs 27-oct-06 20-aug-07 12.6Mt 4% (6.5Mt) 87
868 China HFCs 05-apr-07 18-jun-08 10.9Mt 4% (6.4Mt) 204
Note: the first non HFC/N2O project in this list is the 13th, Id 350, an Energy efficiency project in India registered in January 2007, which issued 4Mt, 3.1Mt of which have been surrendered in the EU ETS.
22
4. CONCLUSIONS
4.1 Global efficiency of CER imports
Linking a cap and trade system to a project based mechanism has three main interests18. The first is to extend the range of possible emissions reductions. In terms of climate science, emissions of greenhouse gases have the same heating effect on the lower atmosphere wherever they are initially emitted. The location of emissions reduction does not matter. Coupling a cap and trade system with an offset mechanism thus extends the possible range of emission reductions worldwide. The second interest is to reduce costs for participants. The probability of finding low-cost reductions is greater when the range of potential emissions reductions is wide, and reductions will occur first where they are least expensive. This lowers the total cost of compliance for participating installations. The third is to diffuse low carbon technologies and methods outside the cap and trade boundaries. Project based mechanisms extend the price signal emanating from the share of the economy covered by a carbon price to other sectors and other regions of the world.
If the linking of the EU ETS with an offset mechanism is successful, one should find evidence that offsets are used on a large scale, i.e. that significant volumes of credits go from a large number of projects to a large number of installations, independently from their sector, size or position, and that the limit of import is fully used at the end of the phase. Our ex-post analysis of CER use in the EU ETS allows us to answer partially those questions, and to draw four conclusions.
Offsets have been used significantly in the first two years of the EU ETS: more than 40% of offsets issued before May 2010 have been surrendered in the EU ETS. A large share of offsets’ final flows goes from the major sources of credits to the countries with the higher import limits. Despite the economic crisis and the consequent drop of demand in the EUA market, installations have used as much offsets in 2009 than in 2008. This confirms the economic theory, despite the asymmetry between the longs and the shorts. Evidence show that even long installations actively swapped CERs to bank or sell EUAs.
The use of offsets is concentrated and not yet very intense or frequent: results vary across categories of installations, but the combustion sector does not stand out as one could
18 For a detailed explanation of how cap and trade systems can be combined with offset mechanisms, see De Perthuis C. (2010), Economic Choices in a Warming World, Cambridge University Press.
23
expect. The installation level analysis shows evidence that smaller installations face higher relative transaction costs (a less frequent but more intense use of offsets). A few big installations surrendered a large share of the total offsets (the use of offsets is more concentrated than the emissions). For the European limit to be reached, all installations should individually import the maximum amount of offsets. We are far from this situation up to now (only 9% of installations have imported CERs in 2008 and 2009), though the time-flexibility given to installations leaves this possibility almost intact.
Surrendered CERs came from the largest, oldest and most profitable projects: 65% of CER surrendered in the EU ETS came from 10 large HFCs or N2O projects in emerging countries. On average, projects are registered two to three years before we find their credits in the EU ETS. But our analysis also showed that younger projects are becoming new sources of offsets for the EU ETS over the years. The number of different project of origin of surrendered credits has nearly doubled between 2008 and 2009, which suggests diversification. Once a project made its first issuance, two to three months are enough to successfully export some credits in the EU ETS. On average, the offsets used in the EU ETS reflect the nature of the offer in terms of project type and host country, and does not reveal any preference of treatment.
The secondary market for CERs has been useful and used by installations: the number of projects of origin of surrendered credits shows that credits surrendered are often a collection a smaller chunks originating from a wide variety of projects.
4.2 Limiting factors to importing credits in the EU ETS
Imports of offsets in the EU ETS could undoubtedly have been smaller. But it is difficult to know whether imports could have been higher in the first two years. This could have been possible (cumulated CER issuance over the first two years has been higher than actual imports) but did not happened for some reasons. We identified here five possible limiting factors to importing credits in the EU ETS, on the demand and on the offer side.
The rules: the discrepancies between Member States make the demand at the country level concentrated and the timing of potential imports very unpredictable. All installations would have to import the maximum amount over the phase for the European limit to be reached. Complicated and decentralized rules cause imperfect information among participants.
24
Transaction costs: analysis at the installation level showed that size matters. Smaller installations tend to surrender offsets less frequently, but more intensively than larger installations. This suggests that transaction costs are not negligible when importing credits.
Awareness and openness to market based instruments: some installations might not be aware of the existence of such mechanisms, or not recognize their benefits, or just avoid using them.
CER offer and demand from other markets: cumulated CER issuance until April 2013 is not expected to be above 1,200Mt, which is below the global import limit in the EU ETS. Demand from other markets, including Parties to the Kyoto Protocol, is not precisely known but could be a serious competitor.
Uncertainty about ERUs: this study focuses on CERs, but one must not forget that ERUs generated by Joint Implementation are also eligible as offsets in the EU ETS. For the moment, available volumes are small and so are surrendered volumes in the EU ETS (48,000t for 2008, 3.5Mt for 2009). But they could become much less negligible towards the end of the phase (around 100Mt cumulated).
4.3 Questions remaining to be answered
This paper is a first step on the road to better understand the link between cap and trade and offset mechanisms. All in all, it is still not clear whether observed imports in the EU ETS can be qualified of low or high in the two first years of the EU ETS. Many questions remain to be answered.
Impact on EUA price: imports of offsets have already transformed into direct savings for some installations, though global benefits obtained via the modification of the EUA equilibrium price are probably more important and benefiting to a larger share of installations, but are more difficult to capture. The potential impact of offsets’ on EUA prices will last as long as credits are available (and less expensive) and that installations can use them. Extending this analysis would require to investigate price formation on the European market in detail, and to evaluate EUA price elasticity with respect to the demand. A focus on EUA banking and borrowing would surely reveal interesting facts.
ERU issuance and potential differences in the use of ERUs compared to CERs: ERUs are important because they are perfect substitutes to CERs and their offer may grow significantly towards the end of the phase. The expected issuance of ERUs and CERs combined can satisfy a significant share of EU ETS installations’ need for compliance, and thus represent a real opportunity to lower the total cost of emissions reductions.
25
International negotiations and their impact on the rules for using offsets after 2012: CDM and JI are mechanisms based on complicated UNFCCC and Kyoto rules, which could not entirely survive in case no UN-recognized commitment period takes place after 2012. The subject is complicated and, as far as EU ETS installations are concerned, introduces uncertainty in terms of timing, quantity and quality of importable offsets.
26
BIBLIOGRAPHY
Aldy J. and Stavins R., eds. (2009), Post-Kyoto International Climate Policy, Cambridge University Press
De Perthuis C. (2011), Economic Choices in a Warming World, Cambridge University Press, available from March 2011
Ellerman A. D., Trotignon R. (2009), Cross Border Trading and Borrowing in the EU ETS, Energy Journal, Volume 30, Special Issue #2, pp. 53-78
Ellerman A. D., Convery F. and De Perthuis C., eds., (2010), Pricing Carbon: the European Union Emission Trading Scheme, Cambridge University Press, January 2010
Elsworth R., Worthington B. (2010), International Offsets and the EU 2009, Sandbag, July 2010
European Commission (2003), Extended Impact Assessment of the Directive of the European Parliament and of the Council amending Directive 2003/87/EC establishing a scheme for greenhouse gas emission allowance trading within the Community, in respect of the Kyoto Protocol’s project mechanisms, COM(2003)403-final, July 2003
European Commission (2004), Directive 2004/101/EC of the European Parliament and of the Council amending Directive 2003/87/EC establishing a scheme for greenhouse gas emission allowance trading within the Community, in respect of the Kyoto Protocol’s project mechanisms”, October 2004
European Commission (2009a), Decision No 406/2009/EC of the European Parliament and of the Council of 23 April 2009 on the effort of Member States to reduce their greenhouse gas emissions to meet the Community’s greenhouse gas emission reduction commitments up to 2020
27
European Commission (2009b), Directive 2009/29/EC of the European Parliament and of the Council of 23 April 2009 amending Directive 2003/87/EC establishing a scheme for greenhouse gas emission allowance trading within the Community
European Commission (2010), Community Independent Transaction Log (CITL), accessible
at www.ec.europa.eu/environment/ets
Fages E., Tatrallyay N., and Sadaka M. (2009), 2008 compliance data: what can we learn from it?, Orbeo - Societe Generale Commodities Research, May 2009
Grüll, G.and Taschini, L. (2010), Cap-and-trade properties under different hybrid scheme designs, Centre for Climate Change Economics and Policy Working Paper No. 35, Grantham Research Institute on Climate Change and the Environment Working Paper No. 26, September 2010
Jaffe J., and Stavins R. (2008), Linkage of Tradable Permit Systems in International Climate Policy Architecture, Discussion Paper 08-07, Harvard Project on International Climate Agreements
Jaraite J., Convery F., and Di Maria C. (2010), Transaction costs for firms in the EU ETS: lessons from Ireland, Climate Policy, 10 (2):190-215(26)
Lewis M., and Curien I. (2010), A Reminder of the EU-ETS Rules on Banking for EUAs & CERs/ERUs, Deutsche Bank Global Market Research, October 2010
McGuinness M. and Trotignon R. (2007), Technical Memorandum on Analysis of the EU ETS Using the Community Independent Transaction Log, MIT CEEPR Working Paper n°WP-2007-012, December 2007
Michaelowa A. (2007), Michaelowa Proposal: Graduation and Deepening, Policy Brief, Harvard Project on International Climate Agreements, Belfer Center for Science and International Affairs, Harvard Kennedy School, September 2007
28
Michaelowa A., Wara, M., Broekhoff, D., Kosloff, L., Spitzer, M., and Trexler, M. (2010), The Upset About International Offsets, The Environmental Forum and Environmental Law Insitute, Washington DC, May/June 2010
Mansanet-Bataller, M., Chevallier, J., Herve-Mignucci, M., and Alberola, E. (2011), EUA and sCER phase II price drivers: Unveiling the reasons for the existence of the EUA–sCER spread, Energy Policy, forthcoming
Olander L. and Murray, B. (2008), Offsets: An Important Piece of the Climate Policy Puzzle, Nicholas Institute for Environmental Policy Solutions, Duke University, August 2008
Ramseur, J. (2008), The Role of Offsets in a Greenhouse Gas Emissions Cap-and-Trade Program: Potential Benefits and Concerns, Congressional Research Service, Report for the US Congress, April 2008
Tol, R. (2009), Intra- and extra-union flexibility in meeting the European Union's emission reduction targets, Energy Policy, 37(11), 4329-4336
Trotignon R. and Delbosc A. (2008), Allowances Trading Patterns during EU ETS Trial Period, Mission Climat Research report, n°13, Caisse des Depots et Consignations, June 2008
Trotignon R. and Ellerman A. D. (2008), Compliance Trading in the EU ETS: Cross Border Trading, Banking and Borrowing, MIT CEEPR Working Paper n°WP-2008-012, September 2008
Trotignon R. and Leguet B. (2009), How many CERs by 2013?, Mission Climat Working Paper n°2009-5, Caisse des Depots et Consignations, August 2009
UNEP Risoe (2010), CDM and JI Pipeline for May 2009, May 2010, and November 2010,
29
Vasa, A. (2010), Efficiency of limits to the use of Clean Development in the EU ETS, Discussion Paper No. 1032, German Institute for Economic Research (DIW Berlin), July 2010
Climate Economics Chair Publications
n° 2011-03
Working Paper Series
Contact us :
Chaire Economie du Climat - Palais Brongniart (4e étage)
28 Place de la Bourse, 75 002 Paris Tel : +33 (0)1 49 27 56 34
Fax : +33 (0)1 49 27 56 28
Email : [email protected]
n° 1 • June 2010 A two-sector model of the European Union Emissions Trading Scheme?
by Suzanne Shaw
La Chaire Economie du Climat est une initiative de CDC Climat et de l’Université Paris-Dauphine sous l’égide de la Fondation Institut Europlace de Finance
n° 2 • November 2010 Public and private risk sharing in the financing of low- emitting urban
infrastructure projects: the case of CDM projects in the waste sector by Dorothee Teichmann
Working Papers Publication Director: Pierre-André Jouvet
Les opinions exposées ici n’engagent que les auteurs. Ceux-ci assument la responsabilité de toute erreur ou omission
n° 2011-01 CO2 Prices and Portfolio Management during Phase II of the EU ETS
by Maria Mansanet-Bataller
n° 2011-02 Tradable pollution permits in dynamic general equilibrium: can optimality
and acceptability be reconciled?
by Thierry Bréchet, Pierre-André Jouvet and Gilles Rotillon
n° 2011-03 Combining cap-and-trade with offsets: lessons from CER use in the EU ETS
in 2008 and 2009 by Raphael Trotignon