HAL Id: tel-01160280
https://pastel.archives-ouvertes.fr/tel-01160280
Submitted on 4 Jun 2015
HAL is a multi-disciplinary open access
archive for the deposit and dissemination of sci-entific research documents, whether they are pub-lished or not. The documents may come from teaching and research institutions in France or abroad, or from public or private research centers.
L’archive ouverte pluridisciplinaire HAL, est destinée au dépôt et à la diffusion de documents scientifiques de niveau recherche, publiés ou non, émanant des établissements d’enseignement et de recherche français ou étrangers, des laboratoires publics ou privés.
Copyright
From Human Routine to More Efficient Mobile
Networks
Eduardo Mucelli Rezende Oliveira
To cite this version:
Eduardo Mucelli Rezende Oliveira. From Human Routine to More Efficient Mobile Networks. Net-working and Internet Architecture [cs.NI]. École Polytechnique, 2015. English. �tel-01160280�
D E L A R O U T I N E H U M A I N E V E R S D E S R É S E A U X M O B I L E S P L U S E F F I C A C E S
e d ua r d o m u c e l l i r e z e n d e o l i v e i r a
Laboratoire d’Informatique
Thèse présentée pour obtenir le grade de Docteur en Informatique de L’École Polytechnique. Soutenue publiquement le 11 Mai 2015 devant le jury composé de :
Aline CARNEIRO VIANA INRIA Saclay, France (Directrice de thèse)
Marcelo D. DE AMORIM CNRS/Université Pierre et Marie CURIE, France (Rapporteur)
Marco FIORE National Research Council, Italie (Rapporteur)
Thierry TURLETTI INRIA Sophia Antipolis, France (Examinateur)
Philippe JACQUET Bell Labs et École Polytechnique, France (Examinateur)
Eduardo Mucelli Rezende Oliveira: De la Routine Humaine vers des Réseaux Mobiles Plus Efficaces, © Mai 2015
d i r e c t r i c e d e t h è s e:
Aline Carneiro Viana
l i e u:
F R O M H U M A N R O U T I N E T O
M O R E E F F I C I E N T M O B I L E N E T W O R K S
e d ua r d o m u c e l l i r e z e n d e o l i v e i r a
Laboratory of Informatics
Thesis presented to obtain the grade of Doctor in Computer Science of the École Polytechnique. Publicly defended on 11 May, 2015 in the presence of the jury
composed by:
Aline CARNEIRO VIANA INRIA Saclay, France (Advisor)
Marcelo D. DE AMORIM CNRS/Université Pierre et Marie CURIE, France (Reviewer)
Marco FIORE National Research Council, Italy (Reviewer)
Thierry TURLETTI INRIA Sophia Antipolis, France (Examiner)
Philippe JACQUET Bell Labs and École Polytechnique, France (Examiner)
Eduardo Mucelli Rezende Oliveira: From Human Routine to More Efficient Mobile Networks, © May 2015
s u p e r v i s o r:
Aline Carneiro Viana
l o c at i o n:
R É S U M E
L’omniprésence des communications a entraîné une récente augmen-tation des volumes de données mobiles, pour laquelle les opérateurs n’étaient pas toujours préparés. Les smartphones sont les plus gros consommateurs de données mobiles. Ces appareils peuvent être con-sidérés comme méchants à cause d’un tel traffic, mais d’un point de vue analytique ils fournissent, aujourd’hui un des meilleurs moyens afin de collecter les données sur le comportement de consommation et de mobilité de grande échelle. Comprendre le comportement des utilisateurs sur leur mobilité et leur connectivité est nécessaire à la création d’un système de communication effectifs. Nous sommes rou-tiniers. Ces cycles routiniers sont une grande partie de nos interac-tions avec le monde. Par exemple, nos habitudes definissent ce que l’on va faire le samedi ou les sites que nous consultons le lundi matin. Ces comportements répétés reflètent nos déplacements et activités en ligne. Dans cette thèse, nous allons nous concentrer sur les demandes de traffic générées par les usagers métropolitains durant leurs activ-ités quotidiennes. Nous présentons une étude détaillée des usagers selon les comportements routiniers de mobilité ou d’activité sur in-ternet. Dans une étude de cas, ou cette enquête serait utile, nous pro-posons une stratégies de déploiement de points de accès qui prendra en compte les aspects routiniers de la mobilités des utilisateurs.
Nous étudirons en premier lieu, les modèles de mobilité en milieu urbain. Nous analyserons les données de mobilité à grande échelle dans de grandes villes comme Beijing, Tokyo, New York, Paris, San Francisco, London, Moscow, Mexico City. Cette contribution se fait en deux étapes. Premièrement, nous observerons les similitudes des dé-placements peu importe la ville concernée. Ensuite, nous mettrons en évidence trois caractéristiques présentes dans les déplacements d’une population urbaine typique: Répétivité, utilisation de raccourcis, con-finement. Ces caractéristiques sont dues à la tendance qu’ont les per-sonnes à revisiter les même rues en utilisant les trajectoires proches du chemin le plus court. D’ailleurs, les personnes ont une mobilité quotidienne inférieure à dix kilomètres par jour.
Nous avons ensuite étudié les modèles de demandes de traffic en utilisant une base de données comprenant les données de 6.8 millions d’utilisateurs. Pour cela nous avons principalement deux contribu-tions. Premièrement, une caractérisation précise des comportements de consommation des utilisateurs agrégés par modèle. Nous pouvons voir comment les routines quotidiennes impactent nos demandes de connections et la similarité de ce traffic en fonction des jours. En-suite, nous fournirons un moyen de reproduire artificiellement mais
avec cohérence les modèles des utilisateurs de données mobiles. Ces données synthétisées ont l’avantage de permettre la planification du réseau sans information sur la vie privées de utilisateurs comme les bases de données d’origine.
Afin d’évaluer l’efficacité de ces informations dans un scénario grandeur nature, nous proposerons une stratégie de deploiement de points de accès qui prend en compte les caractéristiques routinières en terme de déplacement et de demande de trafic dans le but d’améliorer la décharge de données mobile. Déployer correctement des points de accès WiFi peut être moins cher que d’améliorer l’infrastructure de réseaux mobiles, et peut permettre d’améliorer considérablement la capacité du réseau. Notre approche améliore l’évacuation de trafic comparée aux autres solutions disponibles dans la littérature.
A B S T R A C T
The proliferation of pervasive communication caused a recent boost up on the mobile data usage, which network operators are not al-ways prepared for. The main origin of the mobile network demands are smartphone devices. From the network side those devices may be seen as villains for imposing an enormous traffic, but from the ana-lytical point of view they provide today the best means of gathering users information about content consumption and mobility behavior on a large scale. Understanding users’ mobility and network behavior is essential in the design of efficient communication systems. We are routinary beings. The routine cycles on our daily lives are an essential part of our interface with the world. Our habits define, for instance, where we are going Saturday night, or what is the typical website for the mornings of Monday. The repetitive behavior reflects on our mobility patterns and network activities. In this thesis we focus on metropolitan users generating traffic demands during their normal daily lives. We present a detailed study on both users’ routinary mo-bility and routinary network behavior. As a study of case where such investigation can be useful, we propose a hotspot deployment strat-egy that takes into account the routine aspects of people’s mobility.
We first investigate urban mobility patterns. We analyze large-scale datasets of mobility in different cities of the world, namely Beijing, Tokyo, New York, Paris, San Francisco, London, Moscow and Mex-ico City. Our contribution is this area is two-fold. First, we show that there is a similarity on people’s mobility behavior regardless the city. Second, we unveil three characteristics present on the mobility of typical urban population: repetitiveness, usage of shortest-paths, and confinement. Those characteristics undercover people’s tendency to revisit a small portion of favorite venues using trajectories that are
close to the shortest-path. Furthermore, people generally have their mobility restrict to a dozen of kilometers per day.
We then investigate the users’ traffic demands patterns. We ana-lyze a large data set with 6.8 million subscribers. We have mainly two contributions in this aspect. First, a precise characterization of indi-vidual subscribers’ traffic behavior clustered by their usage patterns. We see how the daily routine impacts on the network demands and the strong similarity between traffic on different days. Second, we provide a way for synthetically, still consistently, reproducing usage patterns of mobile subscribers. Synthetic traces offer positive implica-tions for network planning and carry no privacy issues to subscribers as the original datasets.
To assess the effectiveness of these findings on real-life scenario, we propose a hotspot deployment strategy that considers routine char-acteristics of mobility and traffic in order to improve mobile data offloading. Carefully deploying Wi-Fi hotspots can both be cheaper than upgrade the current cellular network structure and can concede significant improvement in the network capacity. Our approach in-creases the amount of offload when compared to other solution from the literature.
P U B L I C AT I O N S
This thesis resulted in the following list of publications:
p u b l i s h e d
• Eduardo Mucelli Rezende Oliveira, Aline Carneiro Viana, K. P. Naveen and Carlos Sarraute, “Analysis and Modeling of Mobile Data Traffic in Mexico City”, NetMob Conference, April 2015, Mit Media Lab, Cambridge, MA, United States.
• Eduardo Mucelli Rezende Oliveira, Aline Carneiro Viana, K. P. Naveen and Carlos Sarraute, “Measurement-driven mobile data traffic modeling in a large metropolitan area”, IEEE Percom 2015, Saint Louis, United States.
• Eduardo Mucelli Rezende Oliveira and Aline Carneiro Viana, “From Routine to Network Deployment for Data Offloading in
Metropolitan Areas”, IEEE SECON, June 2014, Singapore. • Eduardo Mucelli Rezende Oliveira and Aline Carneiro Viana,
“From Routine to Network Deployment for Data Offloading in Metropolitan Areas”, École d’eté RESCOM, December 2013, Lyon, France.
• Eduardo Mucelli Rezende Oliveira and Aline Carneiro Viana, “Routine-based Network Deployment”, IEEE INFOCOM,
Stu-dent workshop, April 2014, Toronto, Canada.
• Eduardo Mucelli Rezende Oliveira and Aline Carneiro Viana, “From Routine To Better Network Services”, IEEE/IFIP WMNC,
May 2014, Algarve, Portugal.
• Eduardo Mucelli Rezende Oliveira and Aline Carneiro Viana, “Routine-based network deployment for data offloading in
metropoli-tan areas”, IEEE WCNC 2014, Ismetropoli-tanbul, Turkey.
• Eduardo Mucelli Rezende Oliveira and Aline Carneiro Viana, “From your routine to hotspot deployment for data offloading”,
ACM CoNEXT Student workshop 2012, Nice, France. u n d e r r e v i e w
• Eduardo Mucelli Rezende Oliveira, Aline Carneiro Viana, K. P. Naveen and Carlos Sarraute, “Mobile Data Traffic Modeling:
vealing Temporal Facets”, IEEE Transactions on Mobile Comput-ing.
• Eduardo Mucelli Rezende Oliveira, Aline Carneiro Viana, K. P. Naveen, Carlos Sarraute, Jorge Brea, and Ignacio Alvarez-Hamelin, “On the Consistency of Human Mobility Analysis”, Elsevier Pervasive and Mobile Computing.
A C K N O W L E D G M E N T S
“All that I am, or hope to be, I owe to my angel mother.” — Abraham Lincoln Minha mãe, a pessoa mais importante na minha vida. Obrigado por estar sempre comigo, mesmo que em distâcia, sempre me acom-panhar, me incentivar e me compreender.
“A happy family is but an earlier heaven.” — George Bernard Shaw À minha família por ter dado o apoio fundamental e necessário para que hoje eu possa concluir este trabalho. Mesmo que a distância seja grande, sinto abraçá-los todos os dias. Agradeço a minha irmã pelas conversas, pelo apoio e pela amizade, valeu, Isabele “Bibilz” Mucelli R. de Oliveira. Ao meu pai, por sempre me motivar com sua sabedoria e jovialidade, valeu, José “Gordon” de Oliveira.
“Truly great friends are hard to find, difficult to leave, and impossible to forget.” — G. Randolf To my friends, wherever you were, for the support, jokes, and good times spent together. Gustavo Dias da Silva, Felipe “Big Head” Domin-gos Cunha, K. P. Naveen, Kostas Tavlaridis-Gyparakis, Benoit Defos-sez, Thiago “Pedpano” Henrique Silva, and for my eternal friends that were far away, which I will never forget.
“Love is that condition in which the happiness of another person is essential to your own.” — Robert A. Heinlein To my beloved Sandrine, for every single wonderful smile that your presence brings to me.
“A teacher affects eternity; one can never tell where his influence stops.” — Henry Brooks Adams To all my teachers, specially to my advisor, for the necessary sup-port and guidance in order to walk this long path until the accom-plishment of this thesis work.
C O N T E N T S
1 i n t r o d u c t i o n 1
1.1 Context and motivation 1
1.2 Problem statement 3
1.2.1 What about investigating routine instead of purely
mobility? 3
1.2.2 Can we identify common traffic behavior among
mobile subscribers? 3
1.2.3 And so what? 3
1.3 Contributions of this thesis 4
1.3.1 Routine characterization of human mobility 4
1.3.2 Mobile data traffic profiling and synthetic
gen-eration 4
1.3.3 Traffic-and-mobility-aware hotspot deployment
for data offloading 5
1.4 Thesis outline 5
2 o n t h e m o b i l i t y a n d c o n t e n t a na ly s i s 7
2.1 Dataset knowledge extraction 7
2.2 Mobility insights 9
2.3 Data traffic insights 11
2.4 Conclusions 13 3 c o n t e x t a na ly s i s 15 3.1 Introduction 15 3.2 Rationale 16 3.2.1 System model 16 3.3 Mobility Dynamics 23 3.3.1 Visit behavior 23 3.3.2 Displacement behavior 27 3.3.3 Spatiotemporal behavior 33 3.4 Conclusions 38 4 c o n t e n t a na ly s i s 39 4.1 Introduction 39 4.2 Dataset 41 4.2.1 Traffic dynamics 42 4.2.2 Temporal dynamics 45
4.2.3 Age and gender dynamics 47
4.3 Subscriber profiling methodology 51
4.3.1 Similarity computation 51
4.3.2 Subscriber clustering and classification 52
4.3.3 Subscriber profiles 55
xiv c o n t e n t s
4.3.4 Profile’s age and gender 58
4.4 Measurement-driven traffic modeling 61
4.4.1 Fitting empirical distributions 61
4.4.2 Synthetic subscriber generation 62
4.4.3 Synthetic traffic model evaluation 63
4.5 Discussion 67 4.6 Conclusions 69 5 s t u d y c a s e 71 5.1 Introduction 71 5.2 Related work 73 5.3 Proposal 77 5.3.1 Graph creation 77 5.3.2 Metrics 78
5.3.3 Synthetic traffic model 79
5.3.4 Objective formalization 80 5.4 Performance evaluation 83 5.4.1 Comparison 83 5.4.2 Offloaded traffic 84 5.5 Discussion 87 5.6 Conclusions 88 6 c o n c l u s i o n s a n d f u t u r e h o r i z o n s 89 6.1 Summary 89 6.2 Future horizons 90 6.2.1 Short-term 90 6.2.2 Long-term 92 a a p p e n d i x 95
a.1 Classes and categories for Points of Interest 95
a.2 CDFs of the traffic parameters in peak and non-peak
hours 96
a.3 Synthetic traffic generator algorithm 99
L I S T O F F I G U R E S
Figure 1 Increase on the number of smartphone devices
in 7 years, Rio de Janeiro’s Copacabana beach
(a) on 2008 and (b) on 20151
. 1
Figure 2 (Better seen in colors) (a) Number of users and
trajectories per day in Beijing. (b) Number of trajectories per user grouped per day of the week in Beijing. (c) CDF of the distance from points of interest to the downtown. (d) Dis-tance from points of interest to the downtown
grouped by source. 20
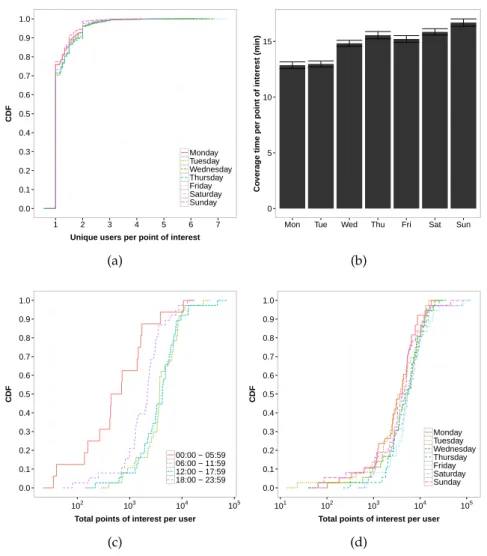
Figure 3 (Better seen in colors) (a) Number of users and
(b) mean coverage time per PI and day of the week in Beijing. Number of visited PIs per user per (c) period of the day and (d) per day of the
week in Beijing. 26
Figure 4 (Better seen in colors) (a) Bin plot of the
num-ber of PIs per cell distance in Beijing. (b) Total number of cells visited per user per day of the week in Beijing. (c) L rank for cells in San
Fran-cisco and Beijing. 28
Figure 5 (Better seen in colors) Repetitiveness of PIs per
days of the week in (a) Beijing and (b)
Mex-ico. 29
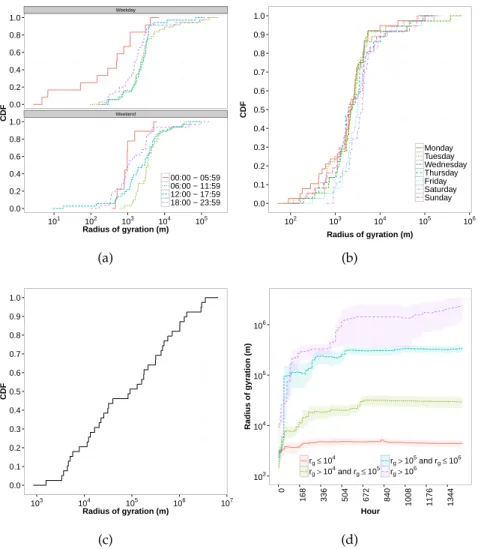
Figure 6 (Better seen in colors) Radius of gyration for
users per (a) period of the day, (b) day of the week, (c) for all periods and days, and (d) for all periods and days grouped by final radius of
gyration in Beijing. 31
Figure 7 (Better seen in colors) Radius of gyration for
subscribers per (a) period of the day and (b)
day of the week in Mexico. 32
Figure 8 (Better seen in colors) (a) CDF of the length
ratio per transportation mode grouped per pe-riod in Beijing. (b) Maximum displacement per period in Beijing. (c) Maximum displacement per period in Mexico. (d) Maximum
displace-ment per day of the week in Beijing. 34
xvi List of Figures
Figure 9 (Better seen in colors) Coverage time provided
by each of the PIs class per (a) period of the day and (b) per weekday and weekends in Bei-jing. (c) Hourly Moran’s I for the number of users on the cells (Beijing) and connected to
the antennas (Mexico). 37
Figure 10 (a) Number of subscribers and sessions on the
whole dataset. (b) Number of subscribers per day generating traffic. (c) CDF of number of days in which subscribers generate traffic. (d) CDF of number of hours in which subscribers
generate traffic per day during the week. 42
Figure 11 (a) CDF of session duration in seconds per
sub-scriber during the week. (b) CDF and (c) bin plot of the upload and download volume dur-ing the week. (d) Number of session per
sub-scriber per day of the week. 44
Figure 12 (a) Average number of sessions per user
dur-ing the week. (b) Volume of traffic for upload and download during the week. (c) Inter-arrival time per subscriber during the week. (d)
Rela-tive Standard Deviation per parameter. 46
Figure 13 (Better seen in colors) (a) Population pyramid
grouped by age and gender. (b) Subscribers by gender per age ranges. (c) Percentage of active users by age. (d) Percentage of active users by
age range. 49
Figure 14 (Better seen in colors) (a) Frequency of sessions
per age and day. (b) Mean metrics per age and gender. (c) CDF of the number of sessions per age range and gender. (d) CDF of the session
duration per age and gender. 50
Figure 15 (a) C-Index values and respective number of
clusters when re-clustering subscribers at the
3rd defined “traffic-volume”-based cluster,
ac-cording to the number of sessions similarity. (b) Histogram of best number of “traffic-volume”-based clusters indicated by the assessed stop-ping rules. (c) Histogram of best number of “number of sessions”-based clusters indicated, when re-clustering subscribers at the 2nd
de-fined “traffic-volume”-based cluster. 54
Figure 16 (Better seen in colors) (a) Mean inter-arrival
per class. (b) Number of sessions per class. (c) Volume of traffic per class. (d) Empirical CDFs
Figure 17 (Better seen in colors) (a) Percentage of sub-scribers per age before and after profiling. (b) Percentage of subscribers per gender and class. (c) Average subscribers’ age per gender and
class. 59
Figure 18 (Better seen in colors) (a) CDFs of number of
sessions and (b) session duration per subscribers’ class and age range. (c) CDFs of number of ses-sions and (b) session volume per subscribers’
class and gender. 60
Figure 19 (Better seen in colors) (a) CDF of the total
vol-ume generated by real and synthetic subscribers (b) Per-parameter BH distances between origi-nal and synthetic trace (dashed line) in D, and between the original trace in D and other days
e from the original trace (full line) (c) Volume
of traffic per class for synthetic subscribers. (d) Heatmap of the correlation between session du-ration, inter-arrival time and volume of
traf-fic. 66
Figure 20 A general view of our proposed methodology. 77
Figure 21 (a) Content generation. (b) Content offload. 81
Figure 22 (Better seen in colors) (a) Offloaded traffic by
the number of deployed hotspots per day and (b) period of the day. (c) The heatmap of hotspots by period created with the routine-based
ap-proach. 86
Figure 23 (a) Traffic parameters for LO users in peak hours.
(b) Traffic parameters for LF users in peak hours. (c) Traffic parameters for HO users in peak hours.
(d) Traffic parameters for HF users in peak hours. 96
Figure 24 (a) Traffic parameters for LO users in non-peak
hours. (b) Traffic parameters for LF users in non-peak hours. (c) Traffic parameters for HO users in non-peak hours. (d) Traffic parameters
for HF users in non-peak hours. 97
L I S T O F TA B L E S
Table 1 Characteristics of the mobility datasets 18
Table 2 Average speed ranges by transportation mode 19
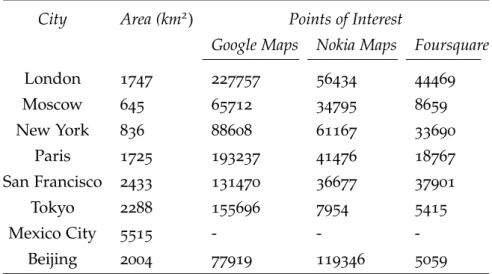
Table 3 Area and number of points of interest per city 22
Table 4 Classes and some of their categories 36
Table 5 Characteristics of the Light profile 56
Table 6 Characteristics of the Medium profile 56
Table 7 Characteristics of the Heavy profile 56
Table 8 Number of sessions: distributions and
param-eters 63
Table 9 Session volume: distributions and parameters 64
Table 10 Session mean inter-arrival times: distributions
and parameters 65
Table 11 Related work comparison 76
Table 12 Synthetic traffic model parameters 81
Table 13 Classes and their respective categories 95
L I S T I N G S
A C R O N Y M S
1
I N T R O D U C T I O N
“The most profound technologies are those that disappear. They weave themselves into the fabric of everyday life
until they are indistinguishable from it.”
— Mark Weiser [1]
1.1 c o n t e x t a n d m o t i vat i o n
We are surrounded by pervasive devices, many of them connected to the Internet. They are growing in number and capacity. There will be 50 billion connected devices by 2020, i. e., more than 6 per person
[2]. Smartphones are one of the most important instances of the
con-nected devices. Smartphone sales surpassed feature phones for the
first time in 2013 [3]. Almost 1 billion of them were sold to end users
only in 2013, a growth of 42% when compared to the previous year
[3]. From that, over half billion mobile devices and mobile network
subscriptions were added in 2013. This is a noteworthy shift towards mobile web access. As a consequence, global mobile data traffic grew
83% in 2013 being 18 times the size of the entire global Internet in
2000[4]. This is a steady trend, mobile data traffic will increase nearly
10-fold between 2014 and 2019. Figure1 shows an interesting
exam-ple of the rapid spread of mobile devices on two pictures taken 7 years apart during New Year’s Eve In Rio de Janeiro’s Copacabana Beach.
(a) (b)
Figure 1: Increase on the number of smartphone devices in 7 years, Rio de Janeiro’s Copacabana beach (a) on 2008 and (b) on 20151
.
Using better web-enabled smartphones and under growing net-work coverage, users generate traffic every time and everywhere. For instance, per minute, people around the world upload 49,000 photos
on Instagram [5], 244,000 photos on Facebook [6], 487,000 photos on
1 Ayrton 360 and Globo Television
2 i n t r o d u c t i o n
WhatsApp [7], send 348,000 tweets [8], and upload 100 hours of video
on YouTube [9].
In an interval of five years, from 2007 to 2012, AT&T faced 20,000
percent growth in mobile data traffic on its network [10]. Telco
op-erators are struggling to cope with the rapidly growing capacity re-quirements whilst keeping financial health. To do so, some technical solutions are currently being implemented such as adoption of new communication standards (e. g., LTE), video optimization, and traffic shaping.
LTE has a cost efficient deployment when compared to technologies such as 2G and 3G for reasons such as part of its equipment can be collocated with existing ones, it has higher spectral efficiency and it demands less power consumption. Therefore, it costs less to deliver a byte using LTE than it does on 3G networks. Nonetheless, many years will be required until a significant adoption of 4G devices. On Western Europe, 25% to 30% of the data traffic will be consumed
using 4G devices only by 2018 [11]. On a global perspective, 25% of
the connections will be made by a 4G-enabled device only by 2020
[12].
Considering that by 2019, 72% of total mobile data traffic will be used for mobile video streaming, a 13-fold increase between 2014 and
2019[4], Telco operators are investigating video optimization as one
of the ways to face the unprecedented growth on network demands. The network load can be reduced, for example, by fine tuning the transcoding, transrating, or by lowering video resolution. However, the end-user experience may be seriously affected by the video qual-ity degradation.
Since aforementioned approaches tackle the traffic inside the mo-bile network or try to couple with the traffic growth, there is a gen-eral belief that those solutions will not handle the demands on the next years. On the other hand, mobile traffic offloading seems to be a promising solution as it aims to shift the traffic off of the mobile net-work to Wi-Fi netnet-work. This approach has several advantages such as low cost, high data rates and easy availability of Wi-Fi hotspots. Care-ful deployment of Wi-Fi hotspots can both be cheaper than upgrade the current cellular network structure and can concede significant
im-provement in the network capacity [13,14].
In order to plan a network it is important first to understand how its subscribers generate traffic. This is challenging task due to the dif-ferences on the behavior of each one of the users. Furthermore, plan-ning a hotspot network require understanding of how people interact with the city, such as important places, which may be areas under high traffic. For instance, Telco operator’s network on metropolitan areas may facilitate the collocation of Wi-Fi hotspots on important points of the city. Those hotspots would offload the data from sub-scribers passing close by, during their daily activities. People’s
mo-1.2 problem statement 3
bility and traffic behavior are tightly related to their daily routines. Thus, it is essential to understand the dynamics that guide the ur-ban mobility and network traffic demands of people to better design network placement strategies.
The objective of this thesis is to get insights from mobile user’s routinary behavior (in terms of context and content demands) for network performance improvement.
1.2 p r o b l e m s tat e m e n t
In this thesis, we interrogate the current human mobility and network traffic analysis. We focus on two main questions and later, in a way to take advantage of them in the context of mobile networks.
1.2.1 What about investigating routine instead of purely mobility?
Considering the vast possibilities human beings have when it comes to their mobility, there is a considerable amount of aspects from which one can analyze trajectories. For instance, the mobility and the re-lation among people has been widely studied through wireless in-teraction analysis on intermittently connected networks (e. g., DTN, VANETs) networks. However, these studies overlook some key as-pects inherent to human routinary behavior and the way he/she in-teracts with the environment. Understanding those aspects may posi-tively impact on the efficiency of systems that rely on human mobility.
1.2.2 Can we identify common traffic behavior among mobile subscribers?
To better plan a mobile network it is crucial to understand its sub-scribers. That is a challenging task since each of the subscribers have their own traffic behavior, which seems to be unique among all other subscribers. Although a per-subscriber modeling is unpractical due to the large number of subscribers, there is an actual similarity in the network traffic demands among different subscribers, partly be-cause of their routines. Thus, it is important to have a solution that identifies and agglutinates similar subscribers into profiles that rep-resent common network behaviors. Additionally, once the traffic is modeled, it can be synthetically reproduced, which has advantages such as expanding the limit of the original data used in the model and the protection of subscribers’ privacy.
1.2.3 And so what?
Once the users are better understood from their mobility and net-work point of views, we can envision benefits to both them and to the
4 i n t r o d u c t i o n
network operator. Better quality of service, coverage, cost-benefit are among possible outcomes from the understanding of mobility and network traffic behavior. Our study case exemplifies a mobile data traffic offloading scenario, which takes advantage of the understand-ing from our users’ behavior pattern analysis.
1.3 c o n t r i b u t i o n s o f t h i s t h e s i s
1.3.1 Routine characterization of human mobility
When searching for patterns on the human mobility there is no evi-dence that a common set of characteristics exists for every significant sample of the population. The reason is that there is an enormous amount of possibilities one can take when roaming around during her/his daily activities. Since we are free to decide about our own mo-bility, one may expect a vast amount of variability on our daily trajec-tories. Although trajectory possibilities are immense, we are routinary beings with inclination to repeat cyclic activities. Literature presents some insights regarding human mobility for few specific cities.
As first contribution of this thesis, we study human mobility in order to find and measure a set of consistent characteristics present in the routine of human mobility. We analyze several different datasets of human mobility in 8 cities from 3 different continents. Moreover, we analyze mobility and its relation with urban scenario, i. e., points of interest in those cities. We see three core aspects present on the human mobility: the usage of shortest-paths, the confinement, and the repetitive visit to a set of points of interest.
1.3.2 Mobile data traffic profiling and synthetic generation
Network planning requires understanding of the traffic demands. Each subscriber has an important impact on the network traffic as a whole. A fine grained study of the network traffic requires a per-subscriber study, which is unpractical due to the singularity present on the be-havior of each user.
The second contribution of this thesis consists on proposing a sub-scriber profiling methodology which define a finite set of classes based on network traffic behavior. We analyze a large-scale dataset with 6.8 millions subscribers in Mexico city on a period that spans for
4months. Due to the cyclicity of our daily activities, we see that
sub-scribers network demands present more similarity in the same hours on different days than within the same day on different hours. We take advantage of this periodic behavior to classify subscribers into 6 profiles using a subset of the dataset and considering two important parameters for the traffic generation: volume and frequency. Finally,
1.4 thesis outline 5
we propose a synthetic traffic generator that consistently imitates the network demands from the original dataset.
1.3.3 Traffic-and-mobility-aware hotspot deployment for data offloading
In order to apply the previous insights, we have chosen a hotspot de-ployment study case. Our approach takes into consideration a metropoli-tan area by leveraging mobile users’ context and content, i. e., their trajectories, scenario interactions, and traffic demands. This is a chal-lenging task due to the large area covered by big cities. For instance, literature presents complete coverage approaches for this problem on very limited scenarios, such as university campus. Such solutions are prohibitive in terms of cost when it comes to a large metropolitan area.
Our proposed strategy considers the restrictions imposed by trans-portation modes to people trajectories and the space-time interaction between people and urban locations, key points for an efficient net-work planning. Using a real-life metropolitan trace with 182 users and more than 200,000 points of interest in Beijing, we show our routine-based strategy guarantees higher offload ratio than the cur-rent approach in the literature, while using a realistic traffic model.
1.4 t h e s i s o u t l i n e
The rest of this thesis is organized as follows. Chapter 2 presents a
classification on the methods used to analyze mobility and network
mobile traffic. In Chapter 3, we study several routine aspects in the
human mobility. Then, in chapter 4, we propose a profiling
method-ology based on subscribers traffic demands and a synthetic traffic
generator. Later, using previous insights, in Chapter5, we propose a
Wi-Fi hotspot deployment for mobile data offloading. Finally,
2
O N T H E M O B I L I T Y A N D C O N T E N T A N A LY S I S
“We are like dwarfs on the shoulders of giants, so that we can see more than they, and things at a greater distance, not by virtue of any sharpness of sight on our part, or any physical distinction, but because we are carried high and raised up by their giant size.” — Bernard De Chartres Related to the problems stated in the previous chapter, we present the bases of mobility and traffic dataset analysis as well as we position our work according to the literature.
2.1 d ata s e t k n o w l e d g e e x t r a c t i o n
Datasets are of enormous importance on the analysis of many scien-tific fields. They provide the convenience of a non-real time analysis, i. e., one can analyze the phenomena of interest after its parameters have been collected and logged. In the context of large-scale mobility and networks, where real-time analysis is arduous due to the enor-mous amount of elements (e. g., subscribers) and parameters (e. g., position), datasets are widely used as primary source of information. As a precious resource, few are the datasets in the literature that contain large-scale information of mobility or network measurements. Moreover, to the best of our knowledge, no freely available dataset has both large-scale information about fine-grained mobility and net-work traffic. Experiments to collect human mobility data generally involve people carrying GPS-capable devices which regularly collect their precise positioning. Due to the complexity of those experiments, they tend to be limited in number of participants (e. g., up to 35), time duration (i. e., up to few weeks), and space as in university
cam-puses [15,16,17,18,19], conference rooms [20,21], or shopping malls
[22]. Lausanne campaign [23] and GeoLife [24] represent some of the
few relatively large experiments with around 200 participants, that at-tempts to collect fine-grained human mobility. The dataset collected from the former is not publicly available, while the one from the latter is.
Aside from that, human mobility datasets covering large areas tend to rely only on automobile transportation, which is not in the scope of
this thesis. For instance, taxi cabs in San Francisco [25] and Rome [26],
vans inside Microsoft headquarters in Redmond [27], buses inside a
university campus area [28] or in the metropolitan area of Seattle [29].
Another source of human mobility data is Call Detail Record (CDR). CDR is a metadata record that describes phone communication using
8 o n t h e m o b i l i t y a n d c o n t e n t a na ly s i s
a series of data fields, e. g., the identification of callee and caller, call type (voice call or SMS), starting, ending and duration time of the
call, and GPS location of the caller’s cell tower [30]. CDR datasets are
usually released by Telco operators to a limited number of partners under a non-disclosure agreement and with limited access. As both mobility and network traffic are susceptible of giving away private users’ information, entities responsible for such data are careful on providing it to third-parties.
Besides, it is important to understand the limitations of each dataset. For instance, when modeling mobility through CDRs, one has to know its two biggest limitations: sparse in time and coarse in space. Time sparseness occurs because records are generated only when a subscriber sends or receive a call or a SMS, which makes he/she invisi-ble at all other periods of time. Space coarseness is due to the granular-ity of a cell tower sector for the subscribers’ positioning, which leads
to a location uncertainty of about 1 square mile [31]. It is important to
consider that those two characteristics are not uniformly distributed in time due to the fact that subscribers tend to place their calls in
bursts, then staying nonactive for long periods [32], around 70% of
the total time [31]. To overcome such limitation on mobility analysis,
a threshold may be set aiming to remove from the dataset subscribers
that have low call frequency [31]. Nonetheless, [33] studies the
pos-sible caveats of using CDRs to model human mobility patterns. It shows that this kind of data performs well in certain scenarios such as evaluation of subscribers’ home and work places.
Similarly, network traffic datasets in large scale are rarely available in the literature. As in CDR datasets, they are generally released by Telco operators as xDRs, an extension of CDRs that includes network traffic usage information, e. g., generated from subscriber’s brows-ing activities and background applications. In some cases, more spe-cific information such every single URL recorded during subscribers
browsing sessions are available as presented in [34].
Getting access to the dataset is the first step towards proposing a system model. Some effort has to be made to extract mobility and traf-fic knowledge from raw datasets due to their singular characteristics. For example, CDR mobility datasets generally contain, per user, a set of geolocalized points generally ascendingly sorted by timestamp per day. Assumptions must be made in order to represent disjoint trajec-tories that a user perform during the day, otherwise every user will have one single day-long trajectory, which might not represent accu-rately his displacement. Contrarily, for instance, GeoLife provides a precise set of trajectories per user, which ease the mobility analysis.
2.2 mobility insights 9
2.2 m o b i l i t y i n s i g h t s
The understanding of mobility and its modeling has started with
an-imals such as monkeys [35], jackals [36], and albatrosses [37]. Such
works indicated that animal mobility follows a random walk for which
the displacement is power-law distributed, i. e., Lévy flight [38]. Early
human mobility studies used tracking methods such as bank notes
dispersion [39]. Latterly, the lower cost of GPS devices increased the
possibility of collecting mobility datasets. In [40], the authors
evalu-ate GPS traces of 44 volunteers in various outdoor scenarios includ-ing two different college campuses, a metropolitan area, a theme park and a state fair. The analysis shows that human mobility resembles Lévy flight within a scale of less than 10 km, which corroborates
the findings from [39]. Authors then create a Lévy flight model that
captures the mobility from those individuals. More recently, easier methods for collecting human mobility in large scale such as mobile phones open new horizons for deeper human mobility investigations.
Through extensive analysis, [41] presents a seminal study on
hu-man mobility using a CDR dataset of 100,000 subscribers. Authors show that human trajectories show a high degree of temporal and spatial regularity, in disagreement with the aforementioned random trajectories predicted by the prevailing Lévy flight and random walk models. Besides, each individual is characterized by a specific travel distance that is time-independent and a significant probability to re-turn to a few highly frequented locations. The rere-turn to a previously visited location occurs with a frequency proportional to the ranking in popularity of the location with respect to other locations. It means, that humans have a strong tendency to return to locations that they visited before, due to the recurrence and temporal periodicity
inher-ent to human mobility. [42] presents an extension of this work using
two CDR datasets totalizing 3 million subscribers focusing on the vis-iting time, i. e., the period of time spent at one location. The resulting curve shows a truncated power-law with a cutoff of 17 hours, which authors link to the typical awake period of humans.
[43] analyzes CDRs dataset of 97,000 subscribers in Los Angeles
and 71,000 in New York aiming to identify important locations in peo-ples’ lives. Using ground-truth data of home and work location from
19subscribers, authors were able to identify home and work locations
with about 1 and 21 miles of error, respectively. In [44] authors
evalu-ate a dataset of CDRs with information of about 450,000 subscribers to capture city dynamics. More specifically, authors want to discover two main groups in a city, one active during the day (laborshed) and another during the night (partyshed). Their grouping strategy relies on a set of fixed rules, e. g., a subscriber is set to laborshed group if he makes 4 calls (or send 4 SMSs) during business hours using city cell towers, at least, twice per week. It is shown a 81% correlation between
10 o n t h e m o b i l i t y a n d c o n t e n t a na ly s i s
the groups identified by their algorithm and US Census dataset used as ground-truth.
In [45] authors analyze a subset of Lausanne dataset [23] with
38 participants in order to understand how temporal and personal
factors, e. g., occupation and age, affect individual mobility patterns. From the temporal analysis, they concluded that people are less ac-tive during workdays and night than during weekends and daytime. Occupational analysis shows that among full-workers and students, the former are more prone to shorter displacement during the day due to the stricter time rules imposed on companies when compared to universities. Finally, age analysis shows higher nightly mobility of younger people compared to older counterparts, which is the result of nightlife attractions being more interesting for younger people. In
[46], a study was made using a CDR dataset containing information
of 180 subscribers, which presented similar temporal findings.
Due to the routinary behavior, human mobility is highly predictable.
[31] presents a study using a CDR dataset with 50,000 subscribers
aiming to measure how predictable human mobility is. Authors mea-sure the predictability of subscribers’ next whereabouts by using three entropy metrics: (1) uniformly randomly chosen among all the loca-tions the subscriber already visited, (2) based on the frequency of the most visited locations, or (3) taking into consideration both frequency, time spent and the order of the visits. As result, for the typical sub-scriber, the uncertainty of the next location (i. e., the cell tower the subscriber will be connected to) resides, on average, in a set of less
than two locations. Moreover, [41] shows that individuals are found
at their first two preferred locations on 40% of the time.
Besides the efforts above, human mobility has been widely studied from several points of view, specially with regards to the inter-contact and contact time between people, i. e., the time gap separating two contacts and its duration considering the same pair of people. The im-portance on those studies comes from a specific problem on intermit-tently connected networks: as messages are transmitted among nodes when they get in contact with each other, the contact time between pairs of nodes is a key factor on the end-to-end communication delay. In the context of human mobility, people carrying mobile phones are nodes and a contact between devices signify respective people get-ting closer to each other. The longer they stay close, i. e., the contact duration, the larger the amount of data that can be exchanged.
In [47,48] authors show that empirical distributions of inter-contact
times present two characteristics. First, they are well fitted by log-normal curves, with exponential curves also fitting a significant por-tion of the distribupor-tions. Second, they can be well approximated by a power law over some specific time ranges, from few minutes to 12
hours. [21, 49, 50] conducted experiments involving Bluetooth
par-2.3 data traffic insights 11
ticipants at Infocom 2005 conference rooms, [49] analyses 9
partici-pants in a campus scenario, and [50] assess data collected from 16
undergraduate students. Similar results are present in those works re-garding contact duration: it is power-law distributed with variations in the power-law coefficient k inherent to the specificities on the sce-narios where the experiments were carried-out. For instance, the
con-tact duration distribution curve presented in [50] decays slower when
compared to the ones from [17, 49]. Authors associate this behavior
to students that tend to stay longer periods of time in the vicinity of each other as they may attend to the same classes.
Aforementioned works have mostly studied some aspects of the hu-man mobility unveiling characteristics on people’s displacement such as distance, high probability to revisit certain few locations, and the dynamic of encounters. Their conclusions indicate that temporal and spatial factors are recurrently impacting human mobility. However, our intuition says that people’s mobility presents other characteristics such as tendency to use shortest-paths. Besides, no large scale evalu-ation of fine-grained datasets was performed to verify this intuition nor the aspects previously assessed in the literature.
2.3 d ata t r a f f i c i n s i g h t s
The understanding of users’ content consumption has attracted sig-nificant attention of the networking community in the literature. Its improved understanding is of fundamental importance when looking for solutions to manage the increased data usage and to improve the quality of communication service provided. The resulting knowledge can help to design more adaptable networking protocols or services, as well as to determine, for instance, where to deploy networking infrastructure, how to reduce traffic congestion, or how to fill the gap between the capacity granted by the infrastructure technology and the traffic load generated by mobile users.
Earliest analysis of cellular network traffic were mostly focused on the traffic generated from micro-browsing using Wireless Application
Protocol (WAP) [51], PDAs [52], and CDMA2000 network
technol-ogy [53]. Although those studies were made more than a decade ago,
certain findings are still somehow similar to the current state of the
literature, e. g., in [51] authors detected day cyclicity on the
micro-browsing access behavior of mobile phone users. Besides, [52] shows
that most of the users tend to have short network usage sessions when accessing web sites. Compared to those first studies, current network traffic data collection and analysis involves an enormous amount of data, which raises the difficulty on the understanding, characteriza-tion and classificacharacteriza-tion of network demands and subscribers.
Within network traffic analysis, considerable effort has been made towards the classification of subscribers behavior based on their
sim-12 o n t h e m o b i l i t y a n d c o n t e n t a na ly s i s
ilarities. This is challenging task due to the heterogeneity of human behavior, while some subscribers rarely make use of the voice calls,
others perform them thousands of times per month [54]. Clustering
techniques are of frequent use in this context and are employed since
the earliest analysis on metropolitan-area wireless network traffic [55].
Clustering primary focus on the concept of similarity between ele-ments in a collection, as determined by the distance between them in a multidimensional space. Two elements belong to the same clus-ter if the distance between them is small enough. Relatively simple clustering algorithms have the capability to group a large number of elements into clusters, which generally are predefined classes with a semantical meaning.
Distinguishing between changes that are merely due to the dy-namic nature of the system and anomalies is a difficult problem. In
[56] authors develop a method to identify anomalous behavior from
subscribers’ call records. They apply a clustering technique to detect anomalous voice call pattern relative to the historical pattern estab-lished for a phone. Their evaluation makes usage of a CDR dataset comprising 500 subscribers. Their approach uses artificial neural net-works model and focus only on the voice call duration parameter. A voice call is considered abnormal if it is way longer than the
com-mon subscriber’s voice call length. Similarly, [57] applies clustering
techniques in order to find anomalous network behavior. This
ap-proach combines Leader [58] and K-means [59] clustering algorithms
into a hybrid scheme that considers voice call duration and starting time, number of sent/received SMSs, and data traffic. Authors eval-uate the framework on a 12-day CDR dataset of unspecified amount of subscribers. Resulting clusters with few members were considered to contain records anomalous voice calls. Authors evaluate several configuration for the clustering algorithms parameters and conclude that an hybrid approach composed of Leader and K-means have very limited success on anomaly detection.
In [60] authors use a CDR dataset with information about 475,000
subscribers aiming to classify subscribers into usage groups. In this study, voice call duration and number of SMSs are the only param-eters that represent subscriber’s usage. In order to create the groups, K-means clustering was used on both parameters and k = 7, i. e., a fixed number of seven usage groups. Moreover, further investiga-tion in one of the clusters show predominant activity before and after working hours, which authors link to a cluster with majority of com-muter subscribers. In another cluster, authors found higher number
of SMSs than calls, which is a characteristic of younger people [61]
and peak of SMS activity corresponding to the start of the school day, open lunch, and dismissal. Authors were able to establish con-clusively that this cluster was mostly composed by students by
ana-2.4 conclusions 13
lyzing the activity on the antenna that covers a school in the studied area and finding the same behavior.
In [62] authors propose a framework to characterize network-wide
usage profiles and evaluate it using a CDR dataset of 5 million sub-scribers. The goal is to build categories of network usages from a raw CDR dataset, which, in this case, provides hourly number of calls per antenna. The framework creates a node from each hourly mea-surement and structures all nodes as a dendogram. A set of network usage profiles results from hierarchically merging similar nodes into clusters until a certain threshold defined by two stopping metrics, Beale and C-Index. The similarity between nodes relies on two pro-posed metrics, traffic volume similarity and traffic distribution sim-ilarity, which take into consideration absolute and relative call vol-umes on all antennas inside a geographical area. Authors show that more than being able to find a coherent set of voice call usage cate-gories, their framework produces as by-product the identification of anomalous call usage profiles.
Literature presents efforts on the categorization of users by their
network activities using other parameters, e. g., visited websites [63],
and WiFi usage [13]. Additionally, [64,65] present network-wide
anal-ysis for special days such as World Cup match, Easter, Christmas, and
Carnival or special areas of a city [66]. Besides, with focus on urban
planning, [67] characterizes the usage of urban area based on the
net-work activities for typical and special days. Still towards better urban
planning, [68] proposes a framework that merges city information
from network activity, vehicle traffic, and events to provide a better understanding on how cities function and to develop more efficient urban policies.
Most studies in the literature on the analysis of network utiliza-tion are based on the analysis of calling patterns (i. e., generated only when a voice call or a short message service occurs) usually described in CDRs with no regards to the actual data traffic generated by smart-phone applications (e. g., email checks, synchronization, etc). Such analysis may provide an idea on the activity of mobile network cus-tomers but do not describe realistic data traffic demand patterns.
2.4 c o n c l u s i o n s
It is undeniable the importance of datasets in the network and mo-bility analysis, they enable an atemporal data investigation of events that otherwise would be very hard to observe and study in a real time fashion. The main drawback is the lack of publicly available rich datasets in terms of fine-grained and network traffic information. As a consequence, this thesis tackles mobility and network traffic analy-sis using different datasets, which will be presented in the following
14 o n t h e m o b i l i t y a n d c o n t e n t a na ly s i s
chapters. Our analysis from both mobility and network traffic differs from previously mentioned works in several aspects, we:
• focus on trajectory analysis and how people interact with the urban scenario
• provide large-scale fine-grained mobility study focusing routi-nary behavior
• analyze several cities at once, avoiding bias of a specific city context
• extensively analyze real cellular network data traffic and its cyclicity
With that in mind, we envision opportunities for better network
management, and planning. Therefore, in Chapter 4 we propose a
framework to automatically classify subscribers into a set of profiles based on their network usage, and a synthetic traffic generator that mimics the original network demands’ behavior. Another opportu-nity that we explore is the deployment of a supportive wireless net-work on metropolitan areas, which we evaluate as study case in
3
C O N T E X T A N A LY S I S
“We are what we repeatedly do.” — Aristotle
3.1 i n t r o d u c t i o n
On the pervasive era people are connected receiving and sharing in-formation about themselves and their surrounding scenario. People actively or passively share details about their context and the content (as investigated in the next chapter), which are important sources of insights in order to understand human routine.
People are routinary semi-rational entities, they have regular circles of actions guided by their decisions but unexpected situations may
in-terfere on their directions [69]. A person may change their itinerary
due to a traffic jam, problems on the public transportation, etc. When choosing an itinerary, people tend to use the shortest-path to reach their destination, also known as “desire line”. The desire line is the shortest line between origin and destination, and expresses the way
a person would like to go, if such a way were available [70].
Fur-thermore, the people’s itinerary is characterized by its confinement, i. e., despite of choosing the shortest-paths, people will roam close by
their main physical address [39].
Literature studies human mobility predominantly from coarse-grained datasets, from which its sparseness and coarseness plays a negative role on the understanding of some specific aspects such as the usage of shortest-path. Our main contribution in this chapter is to present an extensive human mobility analysis from several fine-grained and one additional large-scale coarse-grained dataset. Our datasets represent hu-man mobility from 8 cities in 3 different continents around the world, namely London, Moscow, New York, Paris, San Francisco, Tokyo, Mexico, and Beijing. For each of them, we first model urban sce-nario with GPS- or CDR-based trajectories and points of interest
(Sec-tion3.2.1). Our points of interest represent real venues. We have
col-lected information regarding more than 1.4 million unique venues distributed among the studied cities. Our human mobility evaluation
comprises visit, temporal and spatiotemporal aspects (Section 3.3).
From our analysis we show that human mobility presents three main characteristics: tendency to use shortest-path, confinement and a strong repetitive behavior relative to few locations.
16 c o n t e x t a na ly s i s
3.2 r at i o na l e
We analyze several different datasets aiming to find and measure a set of consistent characteristics present in the routine of human mobility. In order to avoid bias on the mobility aspects, the datasets come from
different sources, cities and periods of time. Table 1 describes the
characteristics of each of the datasets. The mobility datasets come
from OpenStreetMap2
, GeoLife[24] and a Telco operator in Mexico.
Therefore, they have different characteristics on how to represent user mobility. Before presenting our mobility analyzes, we provide in this section the insights considered in our datasets and a discussion about our system model. Due to space restrictions, graphics show results for Beijing, otherwise stated. However, we will highlight results from different cities throughout the discussion.
3.2.1 System model
For each of our datasets, we build a system model that represents a fairly real urban scenario composed by its respective users and their trajectories. Besides, we use data describing more than 1.4 million real points of interest spread in the cities we consider. Next sections describe the urban scenarios created with OpenStreetMap, GeoLife and a Telco dataset.
3.2.1.1 Urban scenario
g e o l i f e: We use the latest version of GeoLife dataset [24]. GeoLife
is considered to be unique in the literature. This is due to the fact that it provides a rich view of people mobility using 11 dif-ferent transportation modes in an urban area for a long period of time. It provides geolocalized and timestamped points from
182 people during a 4 year span, from 2007 to 2011, mostly in
Beijing. For each person, the dataset provides a set of geolocal-ized points ascendingly sorted by timestamp, i. e., a fine-grained GPS trajectory. All components are based on geolocalized infor-mation, i. e., latitude and longitude coordinates within a 2004
km2
central area in Beijing. Moreover, to better understand spe-cific behaviors inherent from different periods of the day, every day is divided into four periods of time with 6 hours, from
00:00 to 05:59, from 06:00 to 11:59, from 12:00 to 17:59, and from
18:00 to 23:59. Those periods were chosen because they
repre-sent important parts of the day, late night, morning, afternoon, and evening, respectively.
Due to the routine behavior of people and the large time scale of the GeoLife dataset, it suffices to study a subset of the whole
3.2 rationale 17
dataset in order to capture the daily behavior of subscribers. Since our work bases its premises on routinary behavior present on the mobility of people, a time subset of GeoLife data is al-ready enough to show how we can explore routine to provide a better user experience. Therefore, we select the data of the two most active months in terms of number of users and trajecto-ries. This subset spans from 1st November to 31st December of
2008and contains 39 users and 2203 trajectories. The following
results use this subset of data, unless stated otherwise.
o p e n s t r e e t m a p: We have collected trajectories using the official
OpenStreetMap API3
. OpenStreetMap is a collaborative project with more than 1.9 million registered users. It has a feature in which users can upload their geolocalized trajectories in or-der to improve the mapping. We analyze about 14,200 public trajectories uploaded to OpenStreetMap from 6 cities, London, Moscow, New York, Paris, San Francisco and Tokyo. As in Geo-Life, each user’s fine-grained GPS trajectory is a set of geolocal-ized points ascendingly sorted by timestamp. Besides, similarly to GeoLife, the days were divided in periods of 6 hours each.
t e l c o: Consists of a CDR dataset with about 6.8 million subscribers
collected in a large urban area of Mexico city. It contains the geographic position of the antenna being used and the instant of time when the call was performed for each subscriber from July to October, 2013. As usual to CDRs, in general a few num-ber of geographic points are present per user in each day due to the time sparsity of the calls. Moreover, due to the routinary behavior, people tend to make calls on the repeated areas, i. e., antennas. Thus, we have created a 1 week dataset from the orig-inal 4-month dataset as following: each day of the week has all geographic positions from this respective day throughout the original dataset, .e.g, Monday on the 1-week dataset has the GPS positions of all Mondays in the 4-month dataset for each user. Consequently, this dataset better represents the mobility of the subscribers with more geolocalized points.
3.2.1.2 Trajectories
A trajectory represents how people move around and it is described as a set of points representing GPS coordinates periodically collected. Regardless the dataset, each trajectory point has latitude, longitude and timestamp, to indicate when the position was recorded.
g e o l i f e a n d o p e n s t r e e t m a p: People may move around
build-ing their trajectories usbuild-ing at most ten different transportation
18 c o n t e x t a na ly s i s
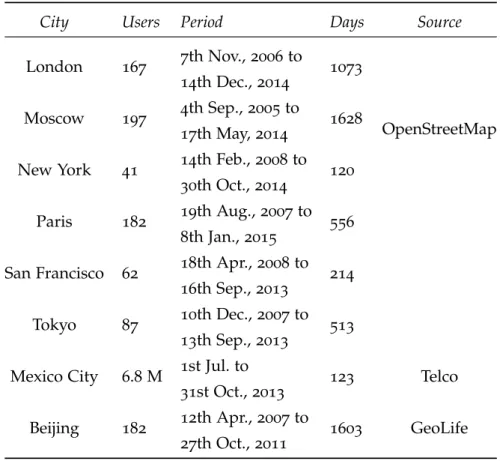
Table 1: Characteristics of the mobility datasets
City Users Period Days Source
London 167 7th Nov., 2006 to 14th Dec., 2014 1073 OpenStreetMap Moscow 197 4th Sep., 2005 to 17th May, 2014 1628 New York 41 14th Feb., 2008 to 30th Oct., 2014 120 Paris 182 19th Aug., 2007 to 8th Jan., 2015 556 San Francisco 62 18th Apr., 2008 to 16th Sep., 2013 214 Tokyo 87 10th Dec., 2007 to 13th Sep., 2013 513 Mexico City 6.8 M 1st Jul. to 31st Oct., 2013 123 Telco Beijing 182 12th Apr., 2007 to 27th Oct., 2011 1603 GeoLife
modes such as taxi, bike, run, bus, walk, train, subway, car, boat, and motorcycle. Therefore, to capture this urban behavior, we have divided each trajectory into legs. A leg is a subset of points from a trajectory with an unique transportation mode. For ex-ample, a trajectory composed by two legs, “car” and “walk” may represent a situation in which a person went by car to his work, parked the car and went walking until his office.
On the point of view of the GeoLife experiment, the transporta-tion mode is a label set by the users being tracked. However, not every trajectory from the dataset was originally labeled with a transportation mode. That is due to the fact that labeling was not mandatory for people participating on the GeoLife experi-ment. Similarly, OpenStreetMap trajectories are not labeled at all. To overcome this limitation, we have created a model that labels legs by their speed compared against known average speeds for transportation modes.
In particular, we calculate the average speed of a leg. For Bei-jing, the result is matched against known speed ranges shown
in Table 2. Lets consider we have an unlabeled leg l traveled
with average speed of 5 m/s. It is possible to see that l falls on a range in which three transportation modes present
over-3.2 rationale 19
Table 2: Average speed ranges by transportation mode
Transportation mode Average speed range (m/s)
Walk 6 1.5
Bus > 1.5 and 6 4 [71]
Bike (99.7%) or Run (0.3%) > 4and 6 4.4 [72]
Taxi (39%), Motorcycle (0.1%), or Car (60%) > 4.4 and 6 11.5 [73] Subway > 11.5 and 6 28 [74] Train > 28and 6 250 Airplane > 250
lapping average speed ranges, “taxi”, “motorcycle”, and “car”. In order to keep the proportion of legs that were originally la-beled by the users in the experiment, we have calculated the percentage of legs (shown between parentheses) on each over-lapping range. Therefore, in this example, l will be labeled ei-ther as “taxi”, “motorcycle”, or “car” with 39%, 0.1% and 60% of chance, respectively. For cities on OpenStreetMap, we apply similar methodology, but due to the lack of a sample with la-beled trajectories from the original dataset, the probabilities are equally divided, e. g., “taxi”, “motorcycle”, or “car” have 33.3% of chance.
t e l c o: As usual to mobility traces based on CDRs, we consider that
the positions of the antennas whose subscriber is connected to during the day represent the trajectory points. For each sub-scriber the points are ascendingly sorted by time of the day. In our dataset, about 70% of the antennas are inside Mexico City urban area and the median pairwise distance between sequen-tial trajectory points per subscriber is 1.5 km. It is much more coarse-grained than the 16 meters from GeoLife and from 7 to
18 meters in the cities from OpenStreetMap. Therefore,
differ-ently from the GeoLife and OpenStreetMap, no transportation mode is inferred from the trajectory points in this dataset.
Figure3.2(a) shows the total number of users and trajectories they
have performed in Beijing. As expected, the number of users and the number of trajectories are highly correlated. It is remarkable the similarity on the shape of the curves for both parameters. Indeed, Pearson’s correlation between number of users and number of trajectories is
20 c o n t e x t a na ly s i s Number of users Number of trajectories 20 40 60 20 40 60
Nov 01 Nov 15 Dec 01 Dec 15 Jan 01
(a) Number of users Number of trajectories 0 10 20 30 40 0 10 20 30 40
Mon Tue Wed Thu Fri Sat Sun
(b) 0.0 0.1 0.2 0.3 0.4 0.5 0.6 0.7 0.8 0.9 1.0 10−1 10−0.5 100 100.5 101 101.5 102 Downtown distances (km) CDF London San Francisco New York Tokyo Moscow Paris Beijing (c) Foursquare Google Maps Nokia Maps 0.0 0.2 0.4 0.0 0.2 0.4 0.0 0.2 0.4 0 20 40 60 Downtown distances (km) Density London San Francisco New York Tokyo Moscow Paris Beijing (d)
Figure 2: (Better seen in colors) (a) Number of users and trajectories per day in Beijing. (b) Number of trajectories per user grouped per day of the week in Beijing. (c) CDF of the distance from points of interest to the downtown. (d) Distance from points of interest to the downtown grouped by source.
In Figure 3.2(b), we present the average number of users and
tra-jectories on each of the week days in Beijing. The day-wise difference for the number of users slightly decreases as the week progresses. On average, the highest difference is 12% more users on Monday than on Sunday. As expected, week days present more people than on weekend days. Indeed, for the week, the average difference is 7%. For the number of trajectories, the behavior is generally decreasing, except for Friday, which has the higher average number of trajectories when compared with all days of the week. That is probable due to people that go to their usual daily activities e. g., places related to work or study and added more trajectories related to leisure during the night such as bars or restaurants. On average, the day with the highest number of trajectories, which is Friday, presents 25% more trajectories than the one with the least number of trajectories, which is Saturday. All cities
3.2 rationale 21
presented similar results, for instance, London, San Francisco, Tokyo, and Moscow have 29%, 19% 35% 46% more trajectories on Friday than on Saturday. As expected, on average, the number of trajectories is higher during the weekdays than during the weekend. The difference is, on average, 2%, 12%, 23%, 9%, and 19%, respectively for London, San Francisco, Moscow, Paris, and Beijing.
3.2.1.3 People and Points of Interest
People move, build their trajectories, and carry mobile devices ca-pable of Wi-Fi communication and able to receive GPS information. While walking by, people may “interact” with points of interest (PI), e. g., bar, bus station, supermarket, etc. Those points of interest de-scribe more than mere locations in the map but they reflect a social aspect e. g., students are frequently going to meet their colleagues in a coffeehouse close to the university they attend to. Indeed, this repre-sents a routinary behavior that involves not only people but also their interaction with points of interest in a city. In our scenario, points of interest are geolocalized physical venues generally present in most of major cities, e. g., bank, supermarket, cafe, school, stadium, train station, university, etc.
In order to study the deployment with real points of interest in Beijing, we have collected information from different databases of
places (e. g., Google Places4
). Such databases are growing and are the most accurate source of public information about points of interest. To avoid to be biased by the characteristics of one unique database, we have collected data from multiple sources namely Google Places,
Nokia Maps5
, and Foursquare6
, counting more than 1.4 million real unique points of interest with their respective IDs, latitudes and lon-gitudes. While Google Places and Nokia Maps databases provide in-formation about points of interest collected from city hall’s records, by the respective owner of the venues, etc, Foursquare provides only
information from places where its users checked in7
, generally places related with leisure and social relationships. For each set of places collected from a source, repeated ones were removed by keeping an
unique occurrence of each ID. Table 3describes the characteristics of
the sets of collected points of interest per source in 98 categories, e. g., market, library, school, etc. It is important to enhance that due to considerably higher spatial distance between trajectory points from the Telco dataset when compared to GeoLife and OpenStreetMap, we have chosen to not include points of interest for Mexico City.
Figure 3.2(c) shows the distribution of points of interest by their
distance to each of the cities’ downtown. For instance, we have
con-4 https://developers.google.com/maps/documentation/places
5 https://developer.here.com
6 https://developer.foursquare.com