Abstract
Aims: The burden of diabetes-related complications is important and increasing in France. Early screening of microvascular complications could avoid the occurrence of more severe consequences. An economic model using a 5-year time horizon was developed to estimate the potential impact in France of large screening of diabetic autonomic neuropathy using Sudoscan, a quick, non-invasive and quantitative method developed for screening of small fiber neuropathy.
Methods: A disease progression model was first developed to describe the long-term evolution of patients with type 2 diabetes regarding microvascular complications over successive time periods and patients were classified in 4 groups according to the severity. Complication-related costs were then calculated for a cohort of patients treated according to the current pattern of care and compared with the costs incurred by the same cohort assuming the introduction and widespread use of a large screening of small fiber neuropathy using the Sudoscan method. Comparison of treatment costs between the two situations was used to evaluate the potential budget impact of such a prevention policy in France.
Results: According to this general screening of early complications more than 25,000 patients could avoid more severe complications. The gross benefit of such a new prevention strategy would be around € 280 million at 5th year. After 5 years of follow-up, the cumulated gross benefit would be € 837 million and in the worst case scenario (decrease of 20% for each uncertain parameter, namely the distribution of patients among severity groups, the death rates in each severity group, and the distribution of newly diagnosed patients in each severity group) gross benefit would remain at more than € 50 million for the first year and more than € 255 million at the 5th year (using 6% as global efficacy of screening method as basal value).
Conclusion: Large screening of small fiber neuropathy could avoid more severe peripheral neuropathy and consequently decrease the burden related to such complications for a limited investment.
Potential Budgetary Impact of Large Scale Screening of Small Fiber
Neuropathy in the Follow-Up of Patients with Type 2 Diabetes in France
Pierre Levy1, Lyse Bordier2, Jean-Henri Calvet3*, Gaëlle Le Hérissé3 and Bernard Bauduceau2
1PSL, Université Paris-Dauphine, LEDa-LEGOS, 75016 Paris, France
2Service d’endocrinologie, Hôpital Bégin, 94067 Saint-Mandé, France
3Impeto Medical, 17 rue Campagne Première, 75014 Paris, France
*Corresponding author: Jean-Henri Calvet, MD, PhD, Medical director, Impeto Médical 17 rue Campagne Première 75014 Paris, France, Tel: +331-4320-1640; Fax: +331-4335-1833; E-mail: jean-henri.calvet@impeto-medical.com
Received October 07, 2015; Accepted October 15, 2015; Published October 19, 2015
Citation: Levy P, Lyse Bordier, Calvet JH, Hérissé GL, Bauduceau B (2015) Potential Budgetary Impact of Large Scale Screening of Small Fiber Neuropathy in the Follow-Up of Patients with Type 2 Diabetes in France. J Diabetes Metab 6: 618. doi:10.4172/2155-6156.1000618
Copyright: © 2015 Levy P, et al. This is an open-access article distributed under the terms of the Creative Commons Attribution License, which permits unrestricted use, distribution, and reproduction in any medium, provided the original author and source are credited.
Keywords: Microvascular complications; Diabetic autonomic
neuropathy; Sudomotor function; Prevention programIntroduction
Prevalence of treated and untreated type 2 diabetes in France was more than 4% in 2008 and continues to increase [1]. Hyperglycemia, as other metabolic dysfunction, directly damages smaller blood vessels resulting in microvascular complications including nephropathy, retinopathy and neuropathy [2]. Thus diabetes mellitus is the leading cause of blindness, end-stage renal disease and non-traumatic limb amputations [3-5]. The total annual cost of diabetes in France was estimated to be more than € 17 billion in 2010 with an annual increase of more than 3% including € 4.2 billion dedicated to complications [1]. The end organ damage resulting from microvascular complications dramatically increases the cost of diabetes [6,7].
Microvascular complications including retinopathy, nephropathy and peripheral neuropathy develop very early in the diabetes process and have been widely documented in patients with impaired glucose tolerance (IGT) [8,9].
Tight glycemic control assessed via fasting glucose or HbA1C has been shown to prevent microvascular complications in type 1; in type 2 diabetes, management of hyperglycemia as well as other metabolic risk factors is helpful to prevent microvascular complications including neuropathy [10].
Lifestyle improvement has been shown to reverse small fiber
neuropathy [11]. It has been largely demonstrated for retinopathy and nephropathy that early screening of microvascular complications with adapted treatment may delay the appearance of severe complications [12]. ACE inhibitors have been shown to reduce the occurrence of nephropathy, and fibrates to reduce retinopathy in the FIELD study [13,14]. Fibrates can also reduce amputations but their effect on small fiber neuropathy has not been fully explored due to a lack of simple tools to evaluate them [15].
Early detection of retinopathy and nephropathy can be easily done in usual practice by retinography and estimation of glomerular filtration rate with a precise gradation of early stages. Peripheral neuropathy assessment is based on measures of large fiber neuropathy, i.e. advanced neuropathy, due to the lack of a simple, quick, objective,
quantitative and sensitive test to assess early nerve damage. This situation has limited early detection of peripheral neuropathy and prevention of more severe complications.
Sweat glands are innervated by autonomic small C-fibers and measurement of sudomotor function has been proposed for screening of small fiber neuropathy [16]. Sudoscan was developed by a French company as a quick, non-invasive, objective and quantitative assessment of peripheral and autonomic small fiber neuropathy based on dynamic assessment of sudomotor function. Its performance has been evaluated through many clinical studies [17, 18].
The aim of this economic study was to explore the potential budget impact of large scale screening of small fiber neuropathy in patients with type 2 diabetes using Sudoscan in France.
Methods
A disease progression model was first developed to describe the long-term evolution of patients with type 2 diabetes regarding microvascular complications over successive time periods. Complication-related costs were then calculated for a cohort of patients treated according to the current pattern of care and compared with the costs incurred by the same cohort assuming the introduction and widespread use of a large screening of small fiber neuropathy using the Sudoscan method (see details in appendix). Comparison of treatment costs between the two situations was used to evaluate the potential budget impact of such a prevention policy in France.
Model structure and eligible population
Nephropathy is a relatively well explored microvascular complication with many detailed published data. As there is a well described progression with proteinuria and microalbumineria, it was used to build the disease progression model from the very early stages of patients with type 2 diabetes. French data issued from Entred study were used in the model to derive patient distribution among severity groups and disease progression rates. The cycle time chosen was 1 year, which corresponds to epidemiological data on annual incidence and to
the estimated mean time for a patient to move from one health state to the other from year y to year y+1.
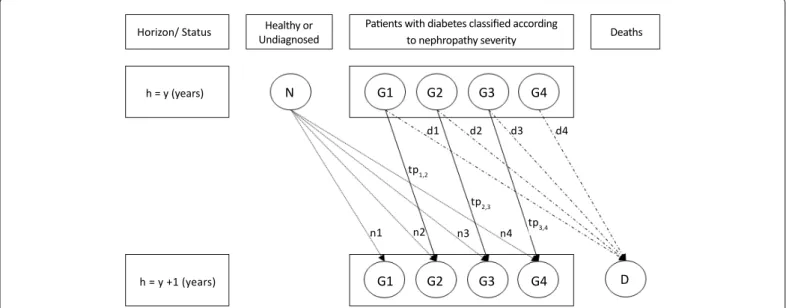
Severity of nephropathy was based on Estimated Glomerular Filtration Rate (eGFR). The model (Figure 1) considers that patients may be classified in 4 groups according to the severity of nephropathy, thus defining four health states apart from death [19,20]:
• G1, group 1: no nephropathy without any treatment for diabetes,
• G2, group 2: no nephropathy but with at least one treatment for diabetes (eGFR> 90 ml/min/1.73 m2 for both groups), • G3, group 3: mild nephropathy (eGFR between 60 and 89 ml/
min/1.73 m2)
• G4, group 4: severe nephropathy (eGFR < 60 ml/min/1.73 m2).
Data regarding this distribution were available from literature for 85% of diabetic patients [6,7]. The 15% remaining patients were allocated proportionally in the 4 groups. Distribution of total new cases expressed as percentages (N distributed in ni) in each group (i = 1, 2, 3, 4) was defined according to number of treatments received supposing that number of treatments received by a diabetic patient recently diagnosed increases with severity of his disease. Percentage of deaths in each group (D distributed in di) was calculated from data on distribution of total deaths according to severity [21,22]. All data sources used for the model are displayed in Table 1 while detailed calculations are presented in the appendix.
As a first step, the model was calibrated in order to mimic the observed disease progression between 2001 and 2007 according to published data from Entred study i.e. 1.7 million patients in 2001 and 2.4 million in 2007 [6]. The model was then validated by comparing projected results issued from this annual progression model to the actual situation of French patients in 2010 [19].
The model was then run using a 5-year time horizon, with a new patient cohort entering the model each year from 2014 until 2018.
Horizon/ Status h = y (years) h = y +1 (years) n1 n2 d1 d2 d3 d4 n3 n4 tp3,4 tp1,2 tp2,3 G1 N G2 G3 G4 G1 G2 G3 G4 D Healthy or Undiagnosed
Patients with diabetes classified according
to nephropathy severity Deaths
Figure 1: Diagram of the model. Patients were classified according to severity of nephropathy (groups G1 to G4) and evolution of these groups on one year (from y to y+1) depends on death rates (d1 to d4), new cases (n1 to n4) and probabilities of transitions from one group (tp1,2 to tp 3,4) to another. In usual conditions size remains contant. With screening strategy tp will decrease and thus size of groups will decrease for the more severe (G3 and G4) and increase for the less severe (G1 and G2).
without and with screening of small fiber neuropathies.
Costs
To reflect the third-party payer’s perspective, only direct medical costs were included. The Entred study performed in 2007 presented the distribution of costs as a Lorenz curve [23]. This curve was used to derive the total cost for each severity group according to its size and assuming that treatment cost was positively correlated with severity. The mean cost per patient in each severity group was then estimated from the total cost and number of patients in each group. Change in total costs associated with the implementation of general screening of small fiber neuropathy was then estimated according to mean patient costs in each severity group and changes in the size of each severity group.
An investment budget to acquire Sudoscan devices was also estimated for general screening.
Summary of assumptions used to build the model and
associated costs
- We assumed the stability of patient distribution among severity groups over time in the absence of a screening program of microvascular complications (current situation)
- Due to a lack of data in the literature, we assumed that the severity of the disease is positively associated with the number of prescriptions. Consequently patients newly diagnosed with diabetes (ni) are distributed in each severity group according to the number of prescriptions. For Knowing the number of patients in each group and supposing that
it remains constant, knowing new cases and death rates, transition probabilities (tpi,j) i.e. percentage of patients moving from one group to a more severe one, could be calculated.
Widespread screening of small fiber neuropathy should decrease the occurrence of complications and thus decrease tpi,j. Considering the two scenarios: usual practice i.e. without screening of small fiber neuropathy, in other words, the present situation and prevention policy with general screening of small fiber neuropathy using Sudoscan, the change in tpi,j induced by general screening of small fibers could be calculated using the following formula: tpi,j with screening = (1- ρ) tpi,j without screening, where ρ is the potential global efficacy. We assumed this overall efficacy to be the product of three factors, namely ρ = α.β.γ where:
• α = penetration of the screening method in diabetic population; • β = stabilization rate i.e. percentage of patients that should
have migrated from one stage to the following and that do not move due to screening of complications with total compliance of patients to recommendations as it could be observed in a perfect clinical trial;
• γ = compliance of patients to recommendations issued from the diagnosis of small fiber neuropathy in usual practice. Based on new tpi,j that would be observed with screening, the new size of each group could be calculated. Size changes in each patient group during the 5-year follow-up were obtained from differences between group sizes resulting from each of the two scenarios i.e.
Description of the variable Name of the variable Value: total or distribution Source
Total of patients with diabetes G 1.7 million (2001)
ENTRED 2001-2007 [1] 2.4 million (2007)
Total cost of diabetes C 7.1 billion Euros (2001)
12.9 billiion Euros (2007)
Total deaths related to diabetes D 29,971 (2001) INVS CepiDC [21]
34,599 (2009) Distribution of patients with diabetes according to nephropathy severity
G1 (Group 1) g1=12% HAS [22]
G2 (Group 2) g2=15% 100%-G1,3,4
G3 (Group 3) g3=51%
ENRED 2007 [19]
G4 (Group 4) g4=22%
Distrbution of New cases (N) according to number of treatments received and corresponding groups
N1 for G1 (With no therapy) n1=42%
HAS [22]
N2 for G2 (Monotherapy) n2=48%
N3 for G3 (Bitherapy) n3=8%
N4 for G4 (Tritherapy and more) n4=2%
Distribution of deaths according to diabetes severity
G1 5%
See appendix for details
G2 8%
G3 37%
G4 50%
Mortality Rate in each group (d)
D1 for G1 d1 d1=5% Total Death/G1 population
D2 for G2 d2 d2=8% Total Death/G2 population
D3 for G3 d3 d3=37% Total Death/G3 population
D4 for G4 d4 d4=50% Total Death/G4 population
Distribution of the total cost according to Lorenz Concentration Curve of Cost of Diabetes c1 for G1 0.50% ENTRED 2007 [23] c2 for G2 2.40% c3 for G3 27.40% c4 for G4 69.80%
example, we supposed that patients under monotherapy are in group 2 while patients with dual therapy are in group 3.
- The investment cost of a Sudoscan device is € 20,000.
- Assuming a complete follow-up and improvement of patient compliance to recommendations prescribed by the physician based on Sudoscan results, the number of screening tests to be performed according to patient severity could be:
• for patients of group 1, 1 test/year, • for patients of group 2, 2 tests/year, • for patients of group 3, 4 tests/year.
• No test for patients of group 4, since at this stage severe damage is already present and screening of small fiber neuropathy is no longer necessary.
Sensitivity analyses
Deterministic sensitivity analyses at year 1, 3 and 5 were performed to assess the impact of most uncertain parameters, namely the distribution of patients among severity groups, the death rates in each severity group, and the distribution of newly diagnosed patients in each severity group. To do so, we estimated the impact of a change of +/- 20% in each of these parameters on results. The impact of change in potential global efficacy on gross benefit was also evaluated for the five years of follow-up.
Results
Changes in the number of patients in each of the 4 severity groups resulting from the implementation of a general screening program of small fiber neuropathy are displayed in Table 2. For example by 2018 (year +5 in our model) the clinical benefit of a large screening program would enable more patients to avoid diabetes-related complications thus increasing the size of groups 1 and 2 and reducing the number of patients with mild or severe complications in groups 3 and 4. This would result in more than 25,000 patients switching from the two more
severe stages of complications to the two less severe ones.
Corresponding gross costs were estimated for each scenario (Table 2). For example in 2018 the total medical cost attributable to diabetes would be € 23.53 billion. The implementation of a generalized program of screening and follow-up of peripheral small fiber neuropathy would be associated with a total cost around € 23.25 billion. The gross benefit from this cost reduction of such a new prevention strategy would be around € 280 million in the fifth year, and the 5-year cumulative benefit would be € 837 million.
Results from the deterministic one-way sensitivity analyses on the impact of a variation in the distribution among the four identified severity groups of the diabetic population (distribution of groups), of newly diagnosed patients (distribution of new cases) and of overall mortality (distribution of deaths) are presented in Table 3. For simplicity, only the estimated value of the annual gross benefit from a large screening program at year 1, 3 and 5 resulting from a ±20% variation in selected parameters is presented.
For example in the worst case scenario (a decrease of 20% for each parameter) gross benefit would remain at more than € 50 million for the first year and more than € 255 million at the 5th year (using 6% as global efficacy as basal value).
As gross benefit is partly based on the global efficacy of the screening program on patient health status over time, we also tested the impact of this parameter on the annual cost reduction (Figure 2). For a potential global efficacy of 6%, gross benefit is € 55 million at year 1 (2014 in our model), € 168 million in 2016 and € 279 million in 2018.
The preceding results are expressed as gross benefit from the implementation of a large screening program of small fiber neuropathy in patients with type 2 diabetes. The cost of such a screening program should be taken into consideration to obtain the net benefit of the intervention. It may be estimated that nearly 7 million tests would need to be performed annually in France based on the number of patients with type 2 diabetes. The mean duration per patient of a screening
Years Change in group size resulting from a general screening program Total diabetes-related costs under actual practice Total diabetes-related costs with a screening program Gross benefit
Group 1 Group 2 Group 3 Group 4
2013 0 0 0 0 18,700,000,000 € 18,700,000,000 € -2014 2,916 3,188 -3,621 -2,483 19,666,666,667 € 19,611,005,509 € 55,661,157 € 2015 5,535 6,120 -6,587 -5,007 20,633,333,333 € 20,521,702,557 € 111,630,777 € 2016 7,905 8,826 -8,997 -7,552 21,600,000,000 € 21,432,369,935 € 167,630,065 € 2017 10,061 11,330 -10,933 -10,103 22,566,666,667 € 22,343,227,837 € 223,438,830 € 2018 12,035 13,655 -12,466 -12,647 23,533,333,333 € 23,254,448,529 € 278,884,805 €
Cumulated gross benefit 837,245,633 €
Table 2: Effects of a general screening program of small fiber neuropathy on the distribution of patients among severity groups and on the gross benefit.
Horizon Variable Worst case Base case Best case
2014
Distribution of Groups 52,428,564 €
55,661,157 €
60,062,661 €
Distibution of New cases 50,588,874 € 60,530,549 €
Distribution of Deaths 52,076,014 € 59,194,440 €
2016
Distribution of Groups 159,366,214 €
167,630,065 €
178,159,896 €
Distibution of New cases 152,695,637 € 181,868,163 €
Distribution of Deaths 157,283,076 € 177,672,595 €
2018
Distribution of Groups 267,207,912 €
278,884,805 €
292,608,984 €
Distibution of New cases 254,627,949 € 301,868,201 €
Distribution of Deaths 262,512,591 € 294,529,709 €
test is estimated to be around 10 minutes (including removal of shoes and socks, recording of demographic data and time of measurement). Consequently, assuming that Sudoscan devices would be available in 50% of medical facilities responsible for the regular care of diabetic patients, we could estimate that nearly 2,200 devices would be necessary.
The total investment cost would be around € 44 million i.e. € 8.8 million of annual investment; considering there is no consumable and the annual depreciation, this investment is very low compared to the avoided costs.
Discussion
This economic study indicates that a program of widespread screening of small fiber neuropathy could decrease the number of patients with severe complications by 2,400 for the first year and by 12,600 after 5 years of implementation thus reducing diabetes-related healthcare expenditures by € 837 million in a 5-year time period while the investment cost to perform such a screening program would be only € 44 million. Sensitivity analyses evidence that the benefit would remain significant even under the worst hypotheses.
Microvascular complications comprise retinopathy, nephropathy and peripheral neuropathy including autonomic neuropathy. Diabetic neuropathy is the most common microvascular complication [2]. To build the model, renal complications were chosen as they have been better researched, with data from very early stages easily obtainable and major publications on sub-clinical nephropathy available. This is contrary to peripheral neuropathies, which have been explored at late stages involving only large fiber nerves due to the methods recommended and used to assess them, i.e. monofilament and biothesiometer [24]. When looking at severe microvascular complications, the percentage of patients with severe neuropathies is comparable to patients with severe nephropathies, which are also comparable to the percentage of patients with severe retinopathies: this confirms the accuracy of the choice made to build the model [19].
The efficacy of a screening program for diabetes complications has been shown to efficiently reduce costs linked to complications
as evidenced by preliminary results from the Sophia program [7]. ACE prescriptions have been evidenced to reduce the occurrence of nephropathy [25]. In the same way laser treatment following retinopathy screening has been shown to reduce the occurrence of severe retinopathy [26].
At the present time, neuropathies are explored using tools like monofilaments that assess large fibers at a stage when the damage is presumed to be less reversible [24]. In addition recent studies have demonstrated that, even if there has been an improvement, only a low percentage of diabetic patients had monofilament examination by general practitioners, likely due to lack of time [7]. Smith et al. demonstrated through biopsies that small fiber neuropathies, i.e. early stages of peripheral neuropathy, could be reversed by lifestyle changes [27]. This result was confirmed by measurements performed using Quantitative Sudomotor Axon Reflex (QSART), a reference test used to measure sweat function and thus small fiber neuropathy in the research area [16]. Based on these preliminary studies one can propose that widespread screening of small fiber neuropathies at a stage when they can be reversed could avoid the occurrence of more severe complications in accordance to what has been observed for other microvascular complications such as retinopathy and nephropathy [7]. Early screening of small fiber neuropathy could be considered equivalent to microalbuminuria for detection of early nephropathy or retinography for widespread screening of early retinopathy.
In addition, the presence of two microvascular complications increases the risk of having more severe complications, reinforcing the need for screening of small fiber neuropathy in addition to screening of retinopathy and nephropathy [4].
For a potential global efficacy of 6% as chosen in our examples a penetration rate of 60% for the screening of small fiber has been suggested. For this test that is easy to use with results immediately available the penetration will depend on the strategy used and the efficacy of the prevention policy implemented. As a comparison, penetration of retinography - which needs interpretation by an 1800 1600 1400 1200 1000 800 600 400 200 0 2014 2015 2016 2017 2018
Gross benefit
Global Efficacy Gr oss bene fit in Mi lion s of Eur os 0% 5% 10% 15% 20% 25% 30% 35% 40%Figure 2: Gross benefit according to global efficacy of the screening method for the 5 years of follow-up. Global efficacy ρ = α.β.γ with α = penetration of the screening method in diabetic population, β = stabilization rate i.e. percentage of patients that should have migrated from a stage to the following one and that do not move due to screening of complication with total compliance of patients to recommendations as it could be observed in a perfect clinical trial and γ = compliance of patients to recommendations issued from the diagnosis of small fiber neuropathy in usual practice. In our examples 6% was chosen as global efficacy.
ophthalmologist - is actually lower while screening for nephropathy through biological samples is equivalent [26].
This budget impact analysis has several limitations:
- Due to the availability of data nephropathy was chosen to build the model. Distribution of severe cases is comparable for the 3 microvascular complications. Thus it was presumed that the distribution of patients according to severity should be comparable for the 3 microvascular complications.
- The model did not take into account the genetic predisposition for nephropathy.
- The percentage of screening efficacy (6%) could be lower than the one chosen to calculate benefits. Sensitivity analysis indicates that even with the worst hypothesis the benefit remains significant.
- Retinopathy and mainly nephropathy are already being evaluated and detected early. However the presence of two or more microvascular complications increases the risk to develop more severe complications. In addition it has been evidenced that peripheral neuropathy could occur before retinopathy or nephropathy.
- It was presumed that screening of one complication could decrease the global costs linked to all complications.
- In cost calculations, only the equipment was considered. According to the actual organization where diabetic patients are examined in hospital day care structures, the addition of a Sudoscan test should not add significant time to the follow-up of diabetic patients.
Conclusion
Based on this economic analysis performed through a model developed for its purpose it can be concluded that widespread screening of small fiber neuropathy using a quick and non-invasive method could avoid more severe peripheral neuropathy and decrease the economic burden linked to such complications for a limited investment.
References
1. Assogba FAG, Penfornis F, Detournay B, Lecomte P, Bourdel-Marchasson I, et al. (2013) Facteurs associés à l’hospitalisation des personnes diabétiques adultes en France. Entred 2007. Bull Epidémiol Hebd (37-38): 454-63. 2. Boulton AJ, Vinik AI, Arezzo JC, Bril V, Feldman EL, et al. (2005) Diabetic
neuropathies: a statement by the American Diabetes Association. Diabetes Care 28: 956-962.
3. Martin CL, Albers JW, Pop-Busui R (2014) Neuropathy and related findings in the diabetes control and complications trial/Epidemiology of diabetes interventions and complications study. Diabetes Care 37: 31-38.
4. Fioretto P, Dodson PM, Ziegler D, Rosenson RS (2010) Residual microvascular risk in diabetes: unmet needs and future directions. Nat Rev Endocrinol 6: 19-25.
5. Morrish NJ, Wang SL, Stevens LK, Fuller JH, Keen H (2001) Mortality and causes of death in the WHO Multinational Study of Vascular Disease in Diabetes. Diabetologia 44 Suppl 2: S14-21.
6. Fagot-Campagna A, Fosse S, Roudier C, Romon I, Penfornis F, et al. (2009) Caractéristiques, risque vasculaire et complications des personnes diabétiques en France métropolitaine : d’importantes évolutions entre Entred 2001 et Entred 2007. Bull Epidemiol Hebd 42-43: 450-5.
7. Chevreul K, Berg Brigham K, Bouché C (2014) The burden and treatment of diabetes in France. Global Health 10: 6.
8. Sumner CJ, Sheth S, Griffin JW, Cornblath DR, Polydefkis M (2003) The spectrum of neuropathy in diabetes and impaired glucose tolerance. Neurology 60: 108-111.
9. Grandinetti A, Chow DC, Sletten DM, Oyama JK, Theriault AG, et al. (2007) Impaired glucose tolerance is associated with postganglionic sudomotor impairment. Clin Auton Res 17: 231-233.
10. Ford ES (2011) Trends in the control of risk factors for cardiovascular disease among adults with diagnosed diabetes: findings from the National Health and Nutrition Examination Survey 1999-2008*. J Diabetes 3: 337-347.
11. Smith AG, Russell J, Feldman EL, Goldstein J, Peltier A, et al. (2006) Lifestyle intervention for pre-diabetic neuropathy. Diabetes Care 29: 1294-1299. 12. Gregg EW, Li Y, Wang J, Burrows NR, Ali MK, et al. (2014) Changes in
diabetes-related complications in the United States, 1990-2010. N Engl J Med 370: 1514-1523.
13. Ravid M, Lang R, Rachmani R, Lishner M (1996) Long-term renoprotective effect of angiotensin-converting enzyme inhibition in non-insulin-dependent diabetes mellitus. A 7-year follow-up study. Arch Intern Med 156: 286-289. 14. Keech AC, Mitchell P, Summanen PA, O’Day J, Davis TM, et al. (2007) Effect
of fenofibrate on the need for laser treatment for diabetic retinopathy (FIELD study): a randomised controlled trial. Lancet 370: 1687-1697.
15. Rajamani K, Colman PG, Li LP, Best JD, Voysey M, et al. (2009) Effect of fenofibrate on amputation events in people with type 2 diabetes mellitus (FIELD study): a prespecified analysis of a randomised controlled trial. Lancet 373: 1780-1788.
16. Low PA (2004) Evaluation of sudomotor function. Clin Neurophysiol 115: 1506-1513.
17. Casellini CM, Parson HK, Richardson MS, Nevoret ML, Vinik AI (2013) Sudoscan, a noninvasive tool for detecting diabetic small fiber neuropathy and autonomic dysfunction. Diabetes Technol Ther 15: 948-953.
18. Smith AG, Lessard M, Reyna S, Doudova M, Singleton JR (2014) The diagnostic utility of Sudoscan for distal symmetric peripheral neuropathy. J Diabetes Complications 28: 511-516.
19. http://www.invs.sante.fr/Dossiers-thematiques/Maladies-chroniques-et- traumatismes/Diabete/Etudes-Entred/Etude-Entred-2007-2010/Resultats-epidemiologiques-principaux-d-Entred-metropole
20. Recommandations HAS Janvier (2013) RECOMMANDATION DE BONNE PRATIQUE. Stratégie médicamenteuse du contrôle glycémique du diabète de type 2. Méthode Recommandations pour la pratique Clinique, Page 10 21. Romon I, Jougla E, Weill A, Eschwège E, Simon D, et al. (2009) Description de
la mortalité et des causes de décès dans une cohorte d’adultes diabétiques, en France métropolitaine. Étude Entred 2001. Bull Epidémiol Hebd 42: 469-72. 22. Argumentaire épidémiologique HAS Janvier 2013. Extrait de l’argumentaire scientifique de la RBP : « Stratégie médicamenteuse du contrôle glycémique du diabète de type 2: Chapitre : Epidémiologie et coût du diabète de type 2 en France. Page 6-7
23. Ricci P, Chantry M, Detournay B, Poutignat N, Kusnik-Joinville O, et al. (2009) Coûts des soins remboursés par l’Assurance maladie aux personnes traitées pour diabète : Études Entred 2001 et 2007 pour le comité scientifique d’Entred. Bull Epidémiol Hebd 42-43: 464-469.
24. Tesfaye S, Boulton AJ, Dyck PJ, Freeman R, Horowitz M, et al. (2010) Diabetic neuropathies: update on definitions, diagnostic criteria, estimation of severity, and treatments. Diabetes Care 33: 2285-2293.
25. Ruggenenti P, Cravedi P, Remuzzi G (2012) Mechanisms and treatment of CKD. J Am Soc Nephrol 23: 1917-1928.
26. Aubert JP, Massin P, Audran G, Ben Mehidi A, Bernit B, et al. (2007) [Evaluation of a screening programme for diabetic retinopathy (DODIA study)]. Rev Prat 57: 1203-1209.
27. Gordon Smith A, Robinson Singleton J (2006) Idiopathic neuropathy, prediabetes and the metabolic syndrome. J Neurol Sci 242: 9-14.
Citation: Levy P, Lyse Bordier, Calvet JH, Hérissé GL, Bauduceau B (2015) Potential Budgetary Impact of Large Scale Screening of Small Fiber Neuropathy in the Follow-Up of Patients with Type 2 Diabetes in France. J Diabetes Metab 6: 618. doi:10.4172/2155-6156.1000618
Appendix
Brief description of Sudoscan method
SUDOSCAN® (Impeto Medical, Paris, France) is a new device designed to perform a quick, non-invasive and quantitative analysis of sweat gland function based on an electrochemical reaction between the chlorides in sweat and stainless-steel electrodes at low direct current (DC) voltage. To conduct the test, the individual is required to put the palms of the hands and soles of the feet in contact with the electrodes for 2 minutes. Electrochemical skin conductance (ESC) in the hands and feet, i.e. the ratio between current generated and the constant DC stimulus, is displayed on a monitor immediately after the end of the test. Neither special subject preparation nor specially trained medical personnel are required. Results are expressed as hands and feet ESC and the units are microSiemens (µS).
Formula used for the calculation of size of groups, deaths,
new cases in each group and transition probabilities
Formula, derived with the two time steps y and y-1, are defined to calculate size of groups, deaths, new cases and tpi,j for year y. Same formula can be applied for following years. The cohort used in the model was the total number of patients with diabetes in France according to Entred study i.e. 1.7 million in 2001 and 2.4 million in 2007 (Table 1).
Formula Description . = ∑ y y j j k k G g G Distribution of groups 1 − = − + ∑y ∑y ∑y ∑y k k k k k k k k N G G D New cases . = ∑ y y j j k k
N n N Distribution of new cases
1 . − = y y y j j j D d G Deaths 1 1 1 1 1 1, 2 1 1 − − − + − = y y y y y y G D N G
tp G Probability of transition from Group 1 to Group 2
1 1 2 2 2 1, 2 1 2 2, 3 1 2 . − − − − + + − = y y y y y y y y G D N tp G G
tp G Probability of transition from Group 2 to Group 3
1 1 3 3 3 2, 3 2 3 3, 4 1 3 . − − − − + + − = y y y y y y y y G D N tp G G
tp G Probability of transition from Group 3 to Group 4
Death distribution
Based on the hypothesis that half of patients with diabetes die from their complications it can be supposed that half of deaths in total population occur in group with more severe complications (group 4). In patients without complications with a mean age of 55 years, percentage of deaths is about that will represent 5% of total deaths of patients with diabetes. Considering that death rates increase with severity death rate in group 2 is lower than in group 3 and should be between 6 and 10% of total death in the population of patients with diabetes: 8% was kept as a mean value. As total rate is 100% it gives 37% for group 3 (100-50-8-5).
Costs
Cost calculation was based on Lorentz curve showing the increase in cumulated costs with complications. From this curve were defined the total cumulated costs for each group of complications (see steps and formula used in table below) and thus the cost per patient for each group (total cost of the group divided by the number of patients of the group) allowing the calculation of change in difference of costs induced by change in size of groups due to general screening.
Adapted from Ricci et al. [23]
Distribution of costs for each group
Groups Distribution of patients with diabetes according to groups (g1,2,3,4) Cumulated distribution of patients with diabetes according to groups (g1,2,3,4) Corresponding cumulated costs according to distribution of patients by severity Distribution of cost (c1,2,3,4) for each group
(G1,2,3,4) G1 12.00% 12.00% 0.46% 0.46% G2 15.06% 27.06% 2.81% 2.35% G3 50.59% 77.65% 30.18% 27.36% G4 22.35% 100.00% 100,00% 69.82%
Sensitivity analysis
To perform sensitivy analysis on costs according to Tornado diagram it was necessary to evaluate in a first step the effect of a change of ± 20% on size of groups, distribution of new cases and deaths in each group. As size of groups depend on sizes of other groups, effects on other groups of a change in one group (*) are displayed in the variation table (below). Considering that changes in costs induced by screening strategy depend on changes in transition probabilities that themselves depend on size of groups, death rates and new cases for each group, sensitivity analysis for costs as described in Table 3 could be performed.
Variable Worst case Base case Best case
Distribution of Groups G1 G2 G3* G4 14.5% 18.1% 40.8% 26.6% 12% 15% 51% 22% 9.5% 11.9% 61.2% 17.4% Distribution of New cases G1** G2* G3 G4 42% 38% 16% 4% 42% 48% 8% 2% 42% 57,6% 0,32% 0,08% Distribution of Deaths G1 G2 G3 G4* 5% 10% 45% 40% 5% 8% 37% 50% 5% 7% 28% 60% * Group with application of +/- 20%
** Unmodified because literature ensured the information Variation table